(1)
Ospedale Civile di Vigevano, Vigevano, Italy
Introduction
Ectopic Beats (Extrasystoles)
Extrasystoles are abnormal impulses originating at points in the myocardium other than the physiological pacemaker. Depending on the actual location, they are described as supraventricular or ventricular.
Supraventricular Ectopic Beats
These beats are characterized by a QRS complex that is premature (relative to the baseline R-R cycle) but, in general, morphologically similar to normal sinus complexes (Fig. 6.1). The complex may thus be narrow or, if there is an associated bundle-branch block (BBB), wide ectopic beats are referred to as atrial (if there is a P wave differing in morphology and axis from the sinus P wave and a PR interval of ≥120 ms) or junctional (when there is a negative P wave in the inferior leads and a PR interval of <120 ms or no atrial deflection at all). Supraventricular ectopic beats (SVEBs) can occur singly or in groups. They are generally followed by an incomplete or noncompensatory pause (i.e., one lasting less than twice as long as the normal P-P cycle), which is the result of SA node depolarization by the ectopic impulse. If the atrial extrasystole is very premature, it may reach the AV node while the latter is still refractory, and in this case it will not be conducted to the ventricles (nonconducted premature atrial complex or blocked atrial extrasystole). If instead the refractoriness is encountered in one of the bundle branches, the supraventricular impulse will be conducted with a QRS configuration unlike that of the baseline tracing, i.e., resembling that associated with bundle branch block (aberrantly conducted supraventricular extrasystole) (Fig. 6.2). SVEBs can also trigger short bursts of atrial tachycardia (Fig. 6.3).
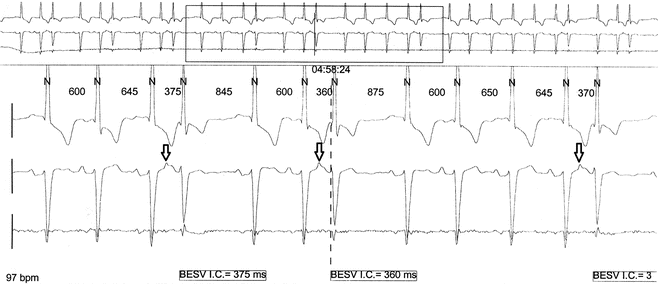

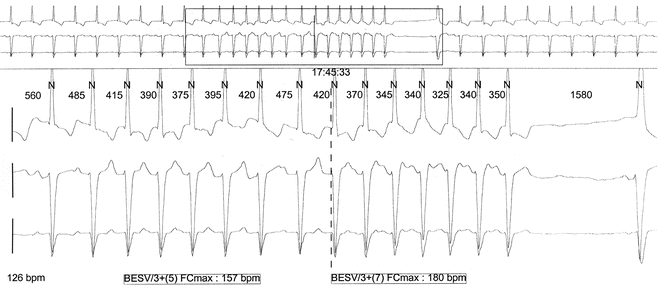

Fig. 6.1
Atrial extrasystoles documented by Holter recording. Compared with the baseline rhythm, the fourth, seventh, and last QRS complexes are premature but morphologically normal, and each is preceded by a P wave (arrows)

Fig. 6.2
Holter recording showing repetitive atrial extrasystoles. The second complex is conducted with partial aberrancy (QRS slightly different from baseline complexes). The third and fourth QRS complexes are followed by a premature P wave that is not conducted (nonconducted premature atrial complex or blocked atrial extrasystole). The result is severe bradycardia that can easily be misinterpreted. The key to the correct diagnosis is the lower tracing, which shows distortion of the T wave by the nonconducted premature P wave (arrows). The last complex is an atrial extrasystole that has been aberrantly conducted (right bundle-branch-block pattern)

Fig. 6.3
During normal sinus rhythm, an atrial extrasystole can trigger a short run of atrial tachycardia, as documented by this Holter recording
Ventricular Ectopic Beats
If the premature complex is morphologically different from that of the baseline tracing (i.e., wide QRS complex) and not preceded by an atrial wave, the extrasystole is ventricular in origin. These ventricular ectopic beats (VEBs) may occur in isolated form, in bigeminal or trigeminal patterns (characterized by a VEB after every one or two sinus beats, respectively) (Fig. 6.4a), or in couplets or triplets. (The rapid succession of three or more VEBs with a rate >100 bpm is usually referred to as unsustained ventricular tachycardia [VT].) VEBs are followed by a compensatory pause (i.e., one that is twice as long as the previous R-R cycle) (Fig. 6.4a), because in most cases the extrasystole does not depolarize the SA node, and the latter continues to emit impulses at its own discharge rate. Sometimes, however, the VEB fails to retrogradely penetrate the AV node or penetration is incomplete: in these cases the postextrasystolic sinus impulse will be conducted to the ventricles with a slight delay, as compared with normal atrioventricular conduction (Fig. 6.4b). When the rates of the normal and ectopic QRS complexes are similar, the morphology of the complexes may be intermediate between that observed during a normally conducted rhythm and that of the ectopic beat (fusion complex) (Fig. 6.4c). Particular attention should be reserved for premature VEBs falling near the peak of the previous T wave (the R-on-T phenomenon), which can provoke protracted tachyarrhythmic events, especially in the presence of repolarization abnormalities, such as QT interval prolongation (Fig. 6.5).
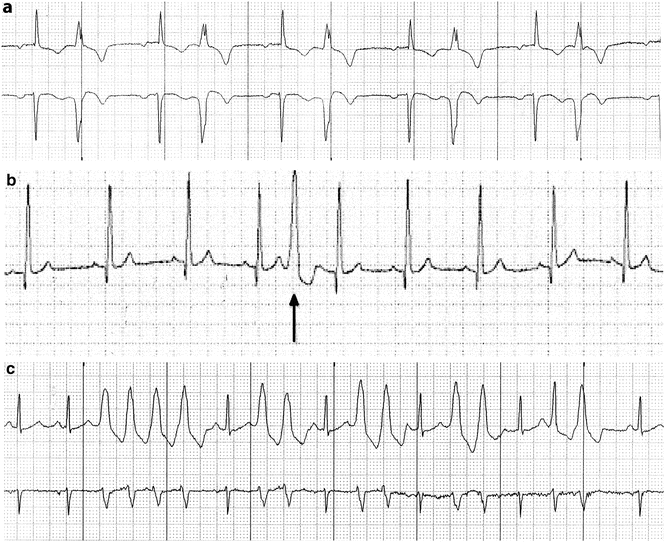


Fig. 6.4
Ventricular extrasystoles. (a) Bigeminy. The morphology of the premature QRS complexes is different from that of the normal complexes, and they are not preceded by atrial waves. There is also a compensatory pause, whereas in (b) the extrasystole is not followed by a compensatory pause and is therefore referred to as interpolated extrasystole. In this case, the phenomenon produces only a slight increase in the normal QRS cycle secondary to mildly delayed of conduction of the sinus impulse to the ventricles (PR interval longer than that of the baseline rhythm). (c) The morphology of the third complex from the right is midway between that of a normally conducted and ectopic QRS complexes. See text for details

Fig. 6.5
Heart monitor recording showing obvious prolongation of the QT interval and premature ventricular extrasystoles capable of triggering episodes of VT
The Supraventricular Tachyarrhythmias
This group includes numerous arrhythmias originating in the atria or the AV node (Table 6.1).
Table 6.1
Classification of the supraventricular tachyarrhythmias
Sinus tachycardia |
Atrial tachycardia |
Atrial flutter |
– typical |
– atypical |
Atrial fibrillation |
Atrioventricular nodal reentrant tachycardia (AVNRT) |
– slow-fast |
– fast-slow |
Atrioventricular reentrant tachycardia (AVRT) |
– caused by a manifest (WPW) accessory pathway. Orthodromic AVRT |
– caused by a manifest (WPW) accessory pathway. Antidromic AVRT |
– caused by a concealed accessory pathway |
– caused by concealed, slow-conduction accessory pathway (Coumel-type) |
– caused by nodoventricular or nodofascicular fibers (Mahaim-type) |
Wolff-Parkinson-White syndrome (WPW) |
Sinus Tachycardia
Sinus tachycardia is characterized by a heart rate exceeding 100 bpm and P-waves that are normal in both morphology and axis (Fig. 6.6).
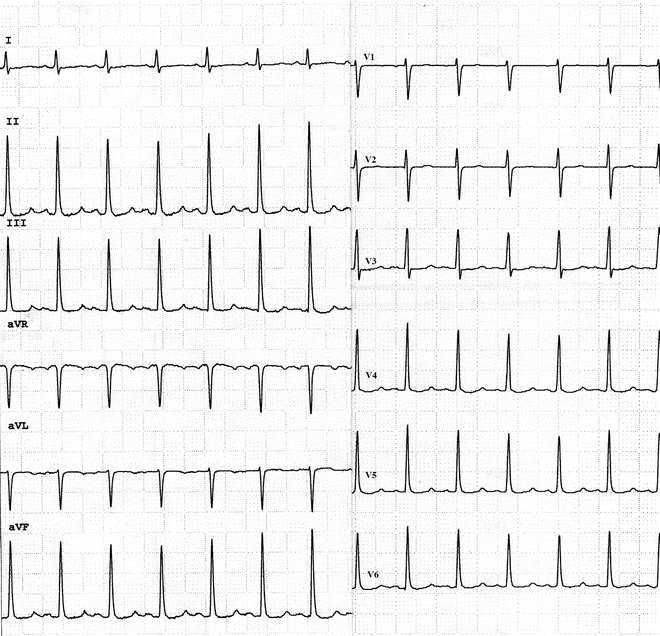

Fig. 6.6
Sinus tachycardia with a rate of approximately 130 bpm. The P wave is morphologically normal with an axis of 60°, and the QRS complex is narrow
Atrial Tachycardia
This type of tachycardia is characterized by morphologically identical P waves, heart rates ranging from 150 to 250 bpm, and clearly discernible isoelectric lines between the atrial deflections. In most cases, conduction of the atrial impulses to the ventricles is blocked. The AV ratio is usually 2:1 (although 1:1 conduction is by no means rare, which complicates the surface ECG diagnosis), and a Wenckebach pattern is sometimes seen. This arrhythmia is generally the result of increased automaticity, which is manifested by the so-called warm-up phenomenon consisting of progressive rate increases soon after the onset of tachycardia and gradual slowing before it ends (Fig. 6.7). Morphological analysis can often localize the origin of the arrhythmia to the right or left atrium (Figs. 6.8, 6.9, and 6.10).
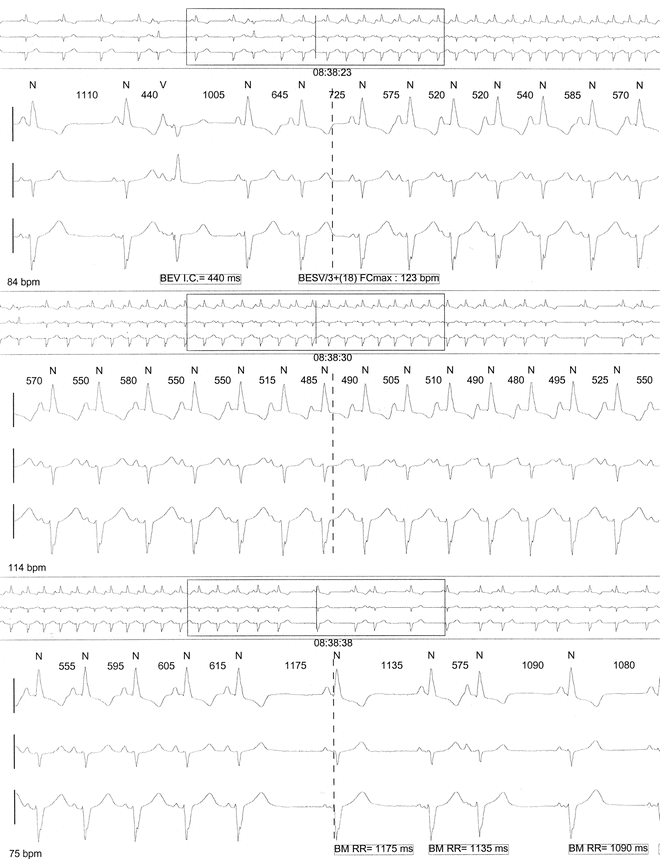
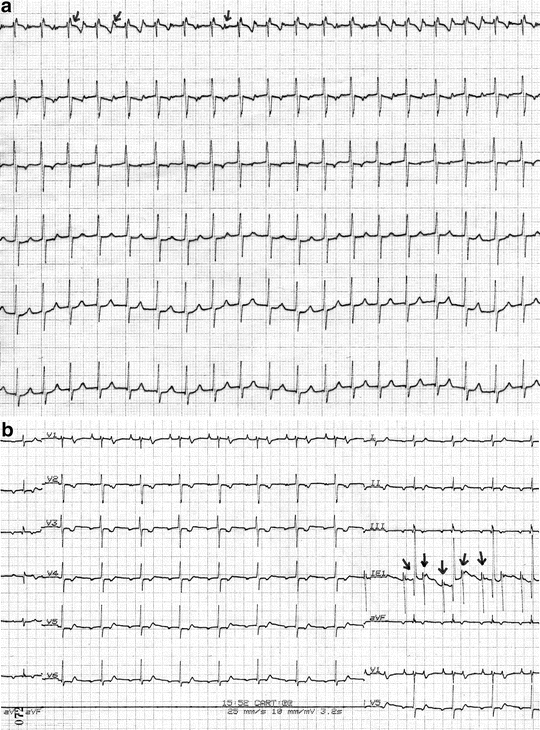
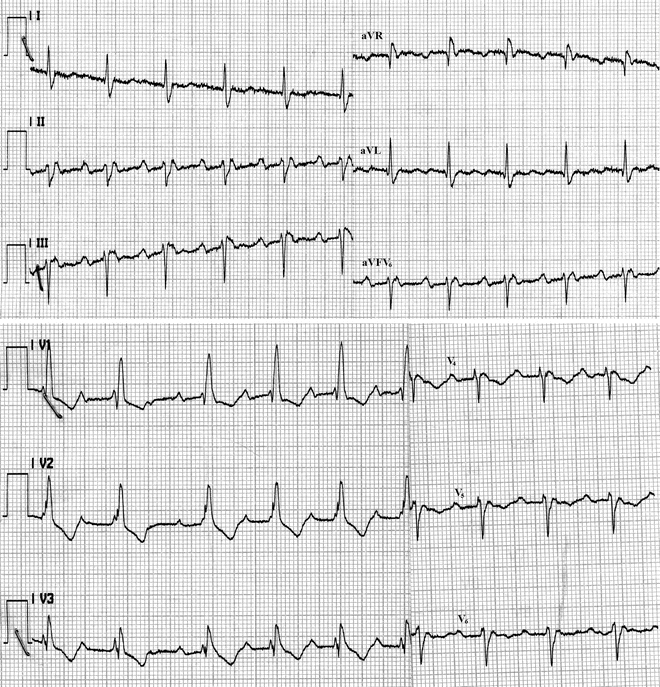
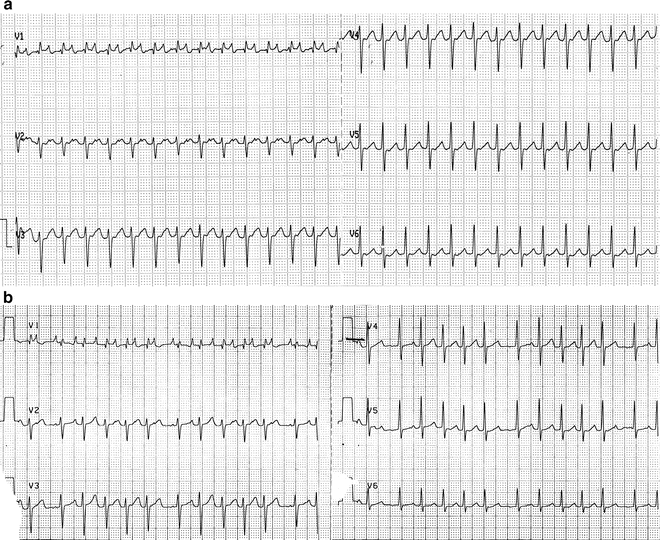

Fig. 6.7
Holter recording showing atrial tachycardia with progressive increases in the rate followed by progressive slowing prior to termination of the arrhythmia

Fig. 6.8
ECG of a patient with supraventricular tachycardia (SVT). (a) Precordial lead tracings (top to bottom: V1 to V6). The QRS complexes are narrow. In lead V1 (top tracing) a P wave can be seen midway between two consecutive QRS complexes (arrows), and there is an r′ deflection that can be attributed to a second P wave. Diagnosis: atrial tachycardia with 2:1 conduction. (b) Intravenous administration of verapamil has reduced the ventricular rate, clearly revealing tachycardia with an AV conduction ratio of 2:1, as confirmed by the arrows in the esophageal tracing (fourth from the top on the left). The lead V1 tracing on the left (sixth from the top) shows QRS complexes characterized by a persistent r′ deflection and a P-P cycle identical to that seen before the verapamil was administered (a). The diagnosis is therefore atrial tachycardia with 2:1 conduction associated with incomplete RBBB. The origin of the atrial tachycardia is probably the right atrium (P-wave negativity in the inferior leads and positivity in V1)

Fig. 6.9
Atrial tachycardia with 2:1 conduction that originates in the left atrium, as shown by P-wave positivity in all the precordial leads and the inferior limb leads and P-wave negativity in aVL and lead I

Fig. 6.10
(a) shows tracings from the precordial leads in a patient with narrow QRS complex tachycardia (rate 175 bpm), an obvious P wave after the QRS complex, and an atrioventricular conduction ratio of 1:1 (tachycardia with RP interval < PR′ interval). The diagnosis is by no means simple: is this a paroxysmal supraventricular tachycardia or atrial tachycardia? In (b) the response to vagal stimulation clarifies the situation, revealing a Wenckebach phenomenon without variations in the atrial cycle. The arrhythmia is therefore ectopic atrial tachycardia. A supraventricular reentry tachycardia would have been interrupted by the vagal maneuver. For details, see text on diagnosis of the supraventricular tachycardias
Multifocal Atrial Tachycardia
This supraventricular arrhythmia is characterized by an atrial frequency of >100 bpm and P waves with at least three different configurations (Fig. 6.11). The electrical basis is probably increased automaticity. It is commonly seen in patients with chronic respiratory disease.


Fig. 6.11
This ECG contains three morphologically distinct P waves with different P-P, PR, and RR intervals, typical signs of multifocal atrial tachycardia
Atrial Fibrillation
Atrial fibrillation (AF) is a very common arrhythmia characterized by chaotic electrical activity in the atria with rates ranging from 350 to 600 bpm. Conduction of the atrial impulses to the ventricles is regulated and slowed by the AV node, which functions as a sort of filter. The ventricular response to the high-rate atrial activity is much lower, generally within the range of 100 to 150 bpm.
ECG diagnosis of AF is usually fairly straightforward. P waves as such are absent: they are replaced by rapid, irregular oscillations of the isoelectric line known as f waves, and the rhythmicity of the ventricular complexes is lost completely (Fig. 6.12). An exception to this rule is AF associated with an atrioventricular block (AVB) (Fig. 6.13): in this case the ventricular complexes occur regularly. As shown in Figs. 6.14 and 6.15, Holter monitoring may reveal phases in which the AVB is even more severe than that seen in Fig. 6.13.
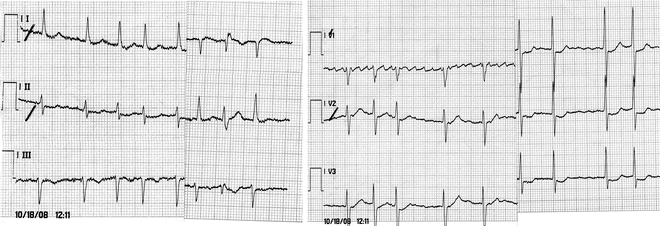


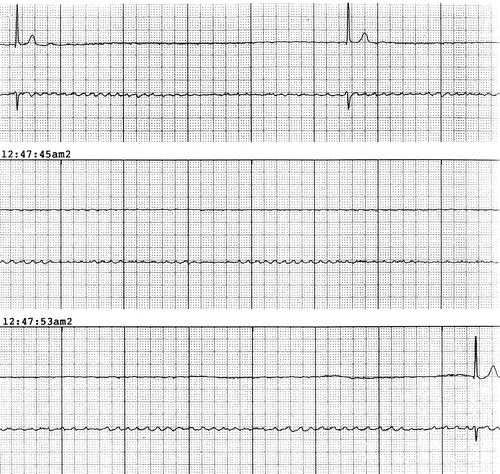

Fig. 6.12
ECG illustrating the peculiar characteristics of AF: absence of P waves, which have been replaced by fine oscillations of the isoelectric line known as f waves (rate 380/min), and completely irregular RR intervals

Fig. 6.13
AF associated with high-grade atrioventricular block (AVB) is slow and regular with a mean ventricular response rate of approximately 30 bpm

Fig. 6.14
AF characterized by a nocturnal asystolic pause lasting more than 5 seconds

Fig. 6.15
Holter tracing documenting a period of asystole lasting more than 17 seconds and associated with syncope
On ECGs recorded during AF (and all other supraventricular arrhythmias as well), there may be morphologically aberrant ventricular complexes, reflecting intermittent or permanent bundle-branch block. When the aberrant complex is isolated and occurs after a short R-R interval preceded by a long R-R interval, it is referred to as an Ashman complex (Fig. 6.16). To understand the Ashman phenomenon, it is important to recall that for myocardial and conduction-system cells, the duration of the refractory periods (i.e., the interval during which the cells have not been repolarized and therefore cannot be re-excited by an external stimulus) generally decreases and increases proportionally with the length of the cardiac cycle. The cells of the AV node are an exception: they behave in the opposite manner and can thus fulfill their role as a filter in the presence of high-frequency atrial activity. The long cycle before an Ashman complex prolongs the refractory period of the bundle-branch cells, and the next complex is widened. The morphology is usually indicative of a block involving the right bundle branch, which normally remains refractory longer than the left bundle branch. When the associated bundle-branch block is permanent, the diagnosis is generally simple (Figs. 6.17, 6.18, and 6.19).
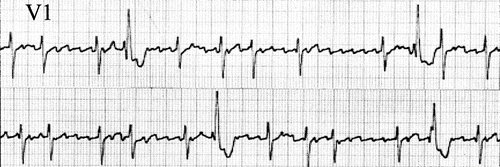
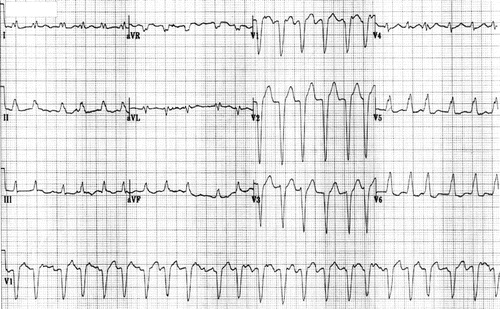
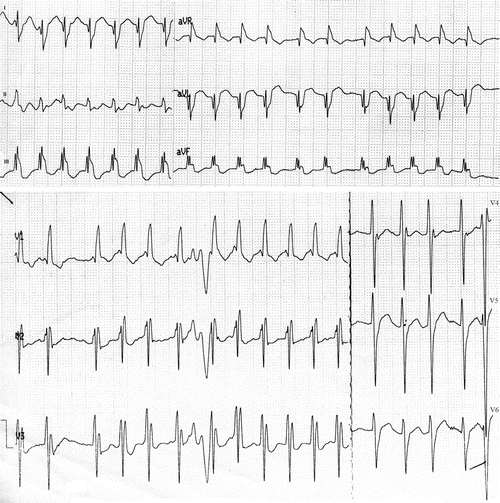
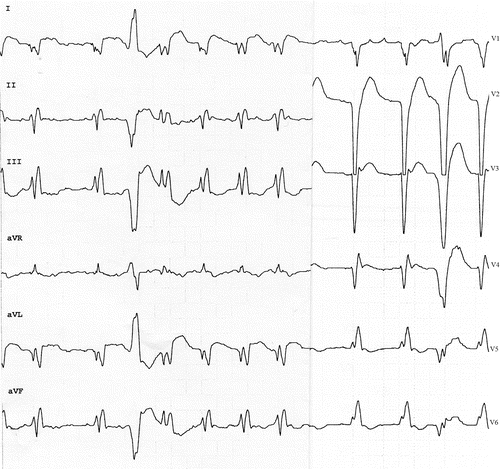

Fig. 6.16
The Ashman phenomenon. In this ECG tracing recorded in V1, the 4th and 10th QRS complexes of the upper strip and the 6th and 11th complexes of the lower strip have a complete RBBB morphology (rsR′). In this case, the origin of these complexes is supraventricular

Fig. 6.17
Tachyarrhythmic AF in the presence of a left bundle-branch block (LBBB). The rhythm is irregular, and there are no discernible sinus P waves, but f waves are present, especially in V1. Typical associated LBBB

Fig. 6.18
Tachyarrhythmic AF with RBBB and Left posterior fascicular block. The QRS morphology in V1 is of the rsR′ type, a large S wave in V5 and V6, right axis deviation (+120°), and f waves in V1

Fig. 6.19
Atrial fibrillation associated with complete LBBB and vertical electrical axis (+120°). Evidence of previous necrosis in the mid-anterior wall (QS in leads V1-3, I, and aVL), f waves in V1, numerous VEBs
In rare cases, the f waves cannot be clearly visualized on surface tracings: in these cases the differential diagnosis must include atrial standstill, which is characterized by the absence of electrical and mechanical activity in the atria. In some cases, the defect reflects the progression of atrial disease, in others the expression of a genetically determined rhythm disorder (Fig. 6.20).
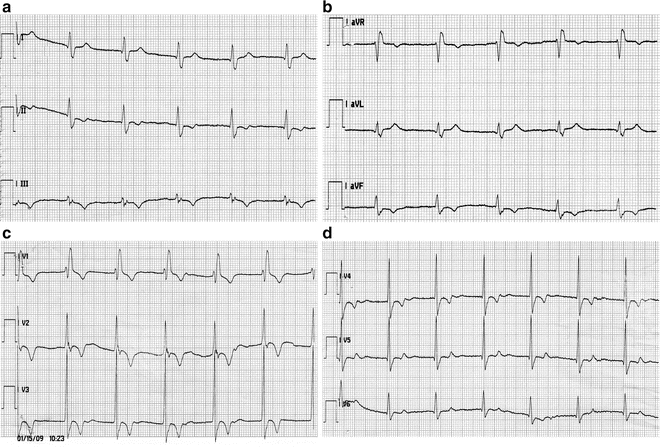

Fig. 6.20
This ECG is characterized by atrial standstill (the line between QRS complexes is essentially isoelectric, reflecting the absence of atrial electrical activity) and a regular junctional escape rhythm (rate 72 bpm) with RBBB conduction (a–d). The QRS complexes are unlikely to originate in the ventricles given their morphologies in leads V1 (rSR′), V6 (Rs), and I (RS)
Three types of AF are usually distinguished:
1.
paroxysmal AF in which the arrhythmia terminates spontaneously;
2.
persistent AF, which terminates only after pharmacologic or electrical cardioversion;
3.
permanent or stable AF (also referred to as chronic AF).
The association of AF with Wolff-Parkinson-White (WPW) syndrome deserves special mention. In this case, when the electrical impulse is conducted to the ventricles along an accessory pathway, the ventricular complexes are irregular and wide, with varying degrees of aberrancy (see Chap. 7). These features differentiate this form from AF associated with bundle-branch block, which is characterized by constant QRS morphology.
Atrial Flutter
Atrial flutter (AFL) is a type of macro-reentrant atrial tachycardia (Fig. 6.21). Its electrocardiographic features include the absence of P waves and the presence of regular flutter waves (F waves) at rates of 250–350 bpm. As in AF, the AV-node “filter” limits the ventricular response, which rarely exceeds 150–160 bpm. The most common feature of the ECG is a 2:1 block of the impulses arriving from the atria (Figs. 6.22 and 6.23). In this case the nonconducted F wave may be concealed within the QRS complex or occur immediately after it. Poorly visualized F waves can be rendered manifest by interventions that slow atrioventricular conduction (carotid sinus massage, administration of verapamil, digitalis, or adenosine) (Fig. 6.24). There is typically no discernible isoelectric line between the F waves. In general, AFL can be easily diagnosed on a 12-lead surface ECG thanks to the presence of F waves, which are most evident in the inferior leads and in V1.
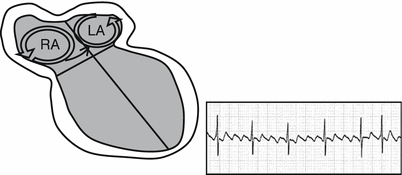
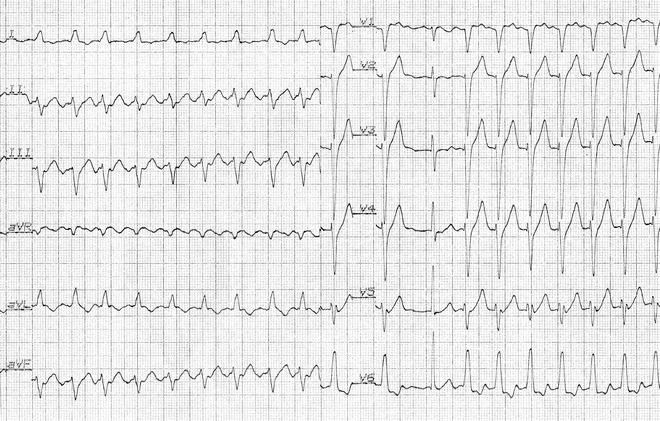
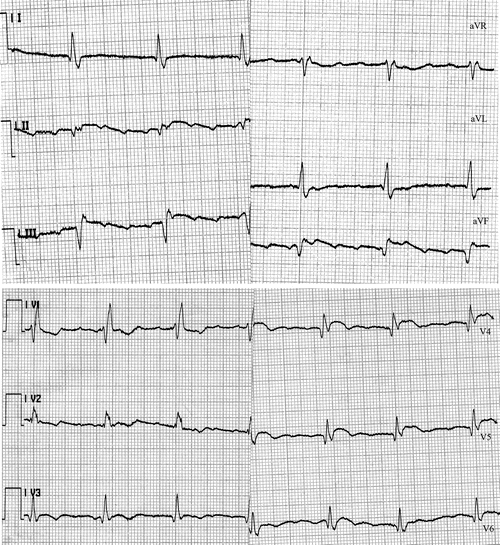
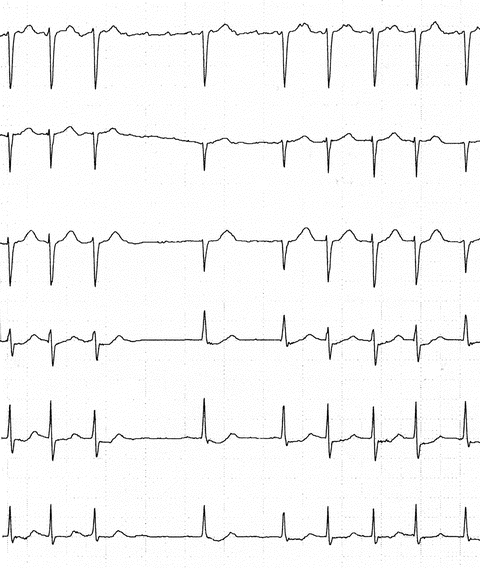

Fig. 6.21
Diagram of the re-entry circuit in typical atrial flutter: the activation wave is propagated in a caudocranial, counter-clockwise direction. RA right atrium, LA left atrium

Fig. 6.22
Common CTI-dependent atrial flutter with 2:1 atrioventricular conduction. Saw-tooth F waves are negative in the inferior leads and positive in leads I, aVL, and V1, thus confirming the caudocranial progression of the atrial activation wave. See text for details

Fig. 6.23
Another case of counter-clockwise, CTI-dependent atrial flutter with F waves that are negative in the inferior leads and positive in V1. Associated complete RBBB and left anterior fascicular block (LAFB)

Fig. 6.24
Narrow-QRS tachycardia shown to be atrial flutter on the basis of the response to a vagal maneuver: slowing of the ventricular rate revealed F waves in the precordial leads with a rate of 280 bpm
There are different types of AFL. Data based on intracardiac recordings, particular those obtained during catheter ablation procedures, have increased our understanding of electrophysiological mechanisms. Various AFL classifications have been proposed: one of the most recent is shown in Table 6.2.
Table 6.2
Electrophysiological classification of atrial fluttera
1. CTI-dependent right atrial flutter.
Stay updated, free articles. Join our Telegram channel
Full access? Get Clinical Tree
 Get Clinical Tree app for offline access

|