The Role of Magnetic Resonance Imaging and Computed Tomography in the Diagnosis and Assessment of Coronary Artery Disease
Thomas C. Gerber
Ronald S. Kuzo
Norman J. Patton
Magnetic resonance imaging (MRI) and cardiac computed tomography (CT) offer a wide range of exciting new possibilities for imaging of the heart, the coronary arteries, and of coronary atherosclerosis. At the current stages of their development, MRI and CT each have distinct strengths and weaknesses in the assessment of cardiovascular disease. Therefore, this chapter is structured according to the clinical objectives of cardiac imaging as germane to the practice of invasive and interventional cardiology. These sections are preceded by a brief description of technical and logistical issues associated with the use of either technique, and of the pertinent terminology.
The main challenges in imaging the heart and coronary arteries using MRI and CT are the perpetual cardiac motion and the small caliber and the complex three-dimensional (3D) arrangement of the coronary tree. The speed of cardiac motion can exceed the temporal resolution of image acquisition of current MRI or CT scanners, resulting in blurring artifacts that may interfere with the confident interpretation of cardiac studies. Therefore, high temporal resolution is very important in cross-sectional cardiac imaging. The spatial resolution of both MRI and CT, although steadily improving, is still less than that of cineangiography, and coronary segments with a diameter of less than 1.5 mm usually cannot be imaged in diagnostic quality even under optimal conditions. Unlike in the summation projections of cine-angiography familiar to the invasive cardiologist, it is usually impossible to capture the entire curved course of a coronary artery in one image or view. Reviewers of MRI or CT coronary angiograms must learn to integrate the information from many contiguous image slices into the assessment of a single coronary artery.
TECHNICAL AND LOGISTICAL ISSUES ASSOCIATED WITH CARDIOVASCULAR MR AND CT IMAGING
Magnetic Resonance Imaging
Principles of Magnetic Resonance Imaging and Image Formation
MR image generation depends on the alignment of a charged particle with a net magnetic moment (hydrogen
nucleus or proton) along an externally applied magnetic field. The alignment and spin of this proton can be changed (excited) if it is exposed to a radiofrequency pulse at a certain frequency, called the Larmor frequency, which is specific to the strength of the magnetic field. After the radiofrequency pulse, the protons relax back toward their original alignment in the magnetic field, and the signal produced by this relaxation can be detected by receiver coils. The timing of the excitation pulses and the changing gradients of the magnetic field define the imaging sequence and are responsible for the different signal intensities produced by different tissues within each imaging sequence. Each repetition of the excitation-relaxation sequence produces a line of data that contributes to the image reconstruction. The higher the resolution that is desired, the more repetitions are needed.
nucleus or proton) along an externally applied magnetic field. The alignment and spin of this proton can be changed (excited) if it is exposed to a radiofrequency pulse at a certain frequency, called the Larmor frequency, which is specific to the strength of the magnetic field. After the radiofrequency pulse, the protons relax back toward their original alignment in the magnetic field, and the signal produced by this relaxation can be detected by receiver coils. The timing of the excitation pulses and the changing gradients of the magnetic field define the imaging sequence and are responsible for the different signal intensities produced by different tissues within each imaging sequence. Each repetition of the excitation-relaxation sequence produces a line of data that contributes to the image reconstruction. The higher the resolution that is desired, the more repetitions are needed.
Scanner Types
Image quality depends not only on the size of the image matrix, but also on the magnitude of the signal produced. A strong external magnetic field will cause a larger proportion of hydrogen nuclei to align with the field, thereby producing greater signal during the imaging sequence. Most MR scanners currently used for cardiac imaging have a field strength of 1.5 Tesla. With low field strength (0.3 to 0.5 Tesla) in so-called “open” scanners, the signal-to-noise ratio is poor, and the imaging time is longer than in scanners that have higher field strengths. Therefore, scanners having low field strengths are unsuitable for cardiac imaging. MR scanners with a field strength of 3 Tesla are commercially available and have the potential to produce high-quality images with short imaging times. However, imaging at 3 Tesla also has disadvantages. Susceptibility artifacts are more prevalent than when imaging at lower field strengths. Also, routine cardiac sequences at 3 Tesla may deposit an amount of radiofrequency energy in the patient’s body that exceeds the specific absorption rate (SAR) limits imposed by the Food and Drug Administration (FDA).
Image Acquisition
To decrease cardiac motion artifacts, all cardiac MR studies are performed using electrocardiographic (ECG) gating. The R wave is used to the trigger the MR sequence, and an appropriate trigger delay is used to position the data acquisition window at the point in the cardiac cycle having least motion.
In MRI, attaining high spatial and high temporal resolution can be mutually exclusive. Data sufficient to reconstruct low-resolution images can be acquired over one or a few cardiac cycles. However, for MR coronary angiography, the data acquisition window should be less than 100 msec with normal heart rates and less than 60 msec in patients with tachycardia. With such short acquisition windows, data acquisition over many cardiac cycles is necessary to reconstruct a high-resolution image. For the submillimeter resolution required for coronary imaging, data acquisition can take several minutes. This approach assumes that the heart returns to the same shape and size at the same point in each cardiac cycle. Variations of the length of the cardiac cycle will result in image blurring.
Because of the long image acquisition time, respiratory motion also can be a cause of poor image quality in cardiac and coronary MRI. Various breath-hold and non-breathhold techniques have been used to address the problem of respiratory motion. Early approaches to MR coronary angiography relied on image acquisition during a sustained breath-hold. ECG-triggered k-space segmented gradient echo sequences allowed one single 2D slice to be acquired with each breath-hold. A series of contiguous, parallel slices are acquired, covering the coronary arterial tree in different imaging planes. This sequence can be performed on most commercially available 1.5T MRI scanners but requires experience and knowledge of cross-sectional cardiac anatomy on the part of the examiner. The breath-hold required for this technique (at least 25 to 45 seconds) is too long for many patients. Also, during suspended respiration, diaphragmatic drift of up to 1 cm can occur, causing blurring of the image. Numerous serial breath-holds usually are necessary to image the entire coronary tree. However, the diaphragm will not be always in the same position on successive breath-holds, and misregistration between the contiguous image slices will occur. Second-generation MR angiographic techniques using navigator echo to track the position of the diaphragm allow the acquisition of high-resolution images during free breathing.
Improvements in data acquisition speed now make it possible to acquire a 3D volume rather than a single slice during one breath-hold. These ECG-gated, segmented Turbo-FLASH (fast low-angle shot) or steady-state free procession (SSFP) sequences can be performed with or without gadolinium contrast enhancement. The 3D volume slabs are oriented, using scout images, along the axis of the vessel being imaged. These newer imaging sequences have a higher signal-to-noise ratio than gradient echoes and the 3D data acquisition approach minimizes misregistration artifacts.
Magnetic Resonance Imaging Safety
ECG-monitoring during MRI often is limited to rhythm assessment because the ST-segments can be distorted by the magnetic field. Also, in the presence of a strong magnetic field, pulsating blood flow through the aorta produces a small electrical charge (magnetohydrodynamic effect) that causes artifacts in the ECG. The augmentation of T-waves by this effect can affect triggering of the scanner sequences if the scanner software mistakes them for Rwaves. Observation of and communication with the patient can be limited by the bulk of the MRI equipment and the layout of an imaging suite that is dictated by MRI safety issues. This can be of concern in patients who are suspected of having an acute coronary syndrome or patients undergoing pharmacologic stress testing. (See the section on MRI Stress Imaging.)
Some types of cardiac MRI studies, such as viability and perfusion studies, require the intravenous administration of gadolinium chelates as a contrast agent. Gadolinium is a very safe contrast agent that has been used for a wide variety of MR examinations for many years. Unlike iodinated contrast agents, gadolinium has no significant nephrotoxicity at usual clinical doses. Side effects of and allergic reactions to gadolinium are rare.
Because the strong magnetic field of MRI scanners can interact with ferromagnetic materials, patients scheduled to undergo a cardiac MRI study should be carefully interviewed for the presence of metallic devices, implants, and foreign bodies. Reference resources should be consulted when it is unclear whether a specific device is safe in the MR environment (1). Pacemakers and implantable cardiac defibrillators generally are considered unsafe. However, it may be permissible and safe to scan patients with pacemakers under close monitoring if the clinical information needed cannot be otherwise obtained (2). Immediate follow-up is necessary, because devices or implants with electrical systems may malfunction after a clinical MRI examination. All prosthetic heart valves are considered safe at 1.5 Tesla. Coronary stents can safely be imaged by MRI using field strengths up to 1.5 Tesla beginning immediately after placement (3). Although most metallic surgical clips, wires, stents, and orthopedic implants are MR compatible, they cause local distortion in the magnetic field, and the resulting susceptibility artifact will obscure the representation of adjacent anatomic structures.
Computed Tomography
Scanner Types and Principles of Projection Data Acquisition and Image Reconstruction
Electron Beam Computed Tomography
Currently, two types of CT scanners are used for cardiac imaging (4). Electron beam computed tomography (EBCT), introduced in 1984, uses no mechanically rotating parts in the projection data acquisition process. The high temporal resolution of EBCT (50 to 100 msec) makes it uniquely suited for cardiac imaging. EBCT scanners currently acquire one image slice at a time, using a technique called prospective triggering. The duration of a scan of the heart is dependent on the patient’s heart rate and is typically 30 to 60 seconds. EBCT has not gained wide acceptance for imaging organs outside the cardiovascular system because of limited image quality, and is, therefore, not widely available other than in academic settings or dedicated, often commercial, imaging centers (approximately 200 scanners exist in the United States). All EBCT scanners are produced by the same manufacturer.
Multidetector Computed Tomography
Multidetector computed tomography (MDCT) technology, available since 1999, is evolving rapidly. Several makes of MDCT scanners, with differing technical specifications from various manufacturers, are widely used for body, musculoskeletal, and neuro imaging. MDCT scanners use mechanically rotating gantries to currently acquire up to 64 image slices per rotation with high spatial resolution and low image noise.
The temporal resolution of MDCT scanners is currently approximately 165 msec or more, which can be sufficient to obtain images of the beating heart without motion artifact. This temporal resolution is determined by the gantry rotation time and not by how many slices are acquired per rotation. Gantry rotation time and number of simultaneously acquired slices determine, together with several other scanning protocol parameters (slice thickness, slice overlap), the duration of a cardiac scan. Using the newest generation of MDCT scanners, the entire heart can be scanned in approximately 10 to 12 seconds.
Computed Tomographic Imaging Safety
Most cardiac CT studies, with the exception of coronary artery calcium (CAC) scanning, require the intravenous administration of iodinated contrast medium. The amount of contrast medium needed to perform, for example, a CT angiogram, depends on the duration of the cardiac scan and the rate of injection (typically 2 to 4 mL/sec); this is approximately 100 to 140 mL for most CT scanners currently in clinical use (4). The short duration of cardiac scans using the newest MDCT scanners will allow CT angiograms to be performed using 60 to 80 mL or less.
The effective radiation dose received by the patient is higher for cardiac MDCT studies than for cardiac EBCT studies, even if dose-reducing scan acquisition techniques are used (for a CT coronary angiogram, approximately 8.1 mSievert versus 1.1 mSievert, respectively) (5).
Image Data Presentation and Interpretation
MRI and CT coronary angiography differ from invasive cine-angiography in that assessment is possible not only of the coronary lumen but also of the coronary vessel wall. However, CT angiographic images represent steady-state contrast-enhancement, and the filling characteristics of the coronary lumen cannot be assessed. Although MRI can quantify dynamic processes such as blood flow, flow measurements in vessels of the size and shape of coronary arteries are currently not reliably or reproducibly possible.
Using MRI, the type of imaging sequence used typically determines the appearance of a cardiac imaging study. During a cardiac CT study, a 3D image data set of the heart is obtained that can be represented in various image displays. The transaxial source tomograms are the primary source of diagnostic information. All other image displays (such as multiplanar reformation, maximum intensity projection, or volume rendering) are usually secondary reconstructions and contain no more, but often less, image detail than the source tomograms. Currently, no universally accepted standardized views exist for the interpretation of
cardiac MRI or CT studies, and very little is known about the diagnostic value of the various image display techniques (4).
cardiac MRI or CT studies, and very little is known about the diagnostic value of the various image display techniques (4).
DETECTION OF CORONARY ARTERY STENOSES
MRI Stress Imaging
MRI for the detection of stress-induced wall motion abnormalities relies on pharmacologic rather than exercise-induced stress because of the logistic issues related to MRI safety of exercise equipment, discomfort of patients enclosed in the bore of the MRI scanner, and hyperventilation-related worsening of image quality due to patient motion and respiration.
High-dose dobutamine MRI may be an alternative to high-dose dobutamine echocardiography in selected patients. In a study comparing these two minimally invasive techniques in 208 patients who also underwent invasive coronary angiography, the overall accuracy for predicting flow-limiting coronary stenoses was higher for MRI (86%) than for echocardiography (73%) (6). The higher diagnostic accuracy of MRI was attributed to better endocardial definition. Overall, the same proportion of studies (11%) could not be performed or interpreted in the MRI and in the echocardiography group. Poor image quality was much less frequent in MRI (1%) than in echocardiography (9%), but severe obesity, claustrophobia, or metallic implants prevented imaging only in the MRI group.
In one study, similar to the well-established prognostic value of conventional imaging stress tests, the presence of inducible ischemia and poor left ventricular function detected by dobutamine stress MRI predicted future adverse cardiac events (ACEs), including cardiac death independent of the presence of conventional cardiovascular risk factors (7).
Perfusion Imaging
Both MRI and CT can provide qualitative assessments and quantitative measurements of myocardial perfusion. To date, myocardial perfusion measurements using CT are mostly performed in the research laboratory.
MRI of myocardial perfusion is slowly becoming part of the clinical practice in experienced centers. Absolute, quantitative measurements of myocardial perfusion by MRI is technically challenging. It requires pulse sequences with high temporal resolution and the fitting of the signal intensity curve measured from myocardial regions of interest after administration of a bolus of gadolinium to very complex mathematical models in order to account for the kinetics of gadolinium clearance from the various distribution compartments in the heart.
Therefore, semiquantitative approaches have found wider use. For example, MRI imaging of first-pass myocardial gadolinium perfusion at rest and during pharmacologically induced stress was able to demonstrate the presence of flow limiting single-vessel disease with at least 85% agreement, compared to thallium 201-scintigraphy in an early study (8). More complex, newer MRI techniques had a sensitivity of 91% and a specificity of 94% compared to positron emission tomography (PET) (9). New contrast agents, faster pulse sequences, image acquisition techniques that encompass larger portions of myocardium, and automated postprocessing techniques are expected to further facilitate the measurement of myocardial perfusion by MRI.
Coronary Artery Calcium Scanning
Epidemiology, Significance, and Quantification of Coronary Artery Calcium
CT imaging of the coronary arteries allows a quantification of the degree of coronary calcification. Common units for quantification are the Agatston score and the volume score. The prevalence and quantity of CAC is highly correlated with age. Women have a lower prevalence of coronary artery calcification than men until approximately 65 to 70 years of age. At any age, the quantity of CAC is less in women than in men (10).
The quantity of CAC is proportional to the coronary atherosclerotic plaque burden. For example, in a histopathologic analysis of excised coronary arteries, the square root sum of areas of calcification detected by CT imaging was highly correlated with, and represented approximately one-fifth of, the square root sum of the planimetry-derived total cross-sectional plaque area on an artery-by-artery basis and for all major coronary artery branches taken together (11). However, the location of coronary artery calcification does not predict the location of coronary artery stenoses.
Ongoing controversy centers on whether CAC scores measured by MDCT scanners are numerically equivalent to CAC scores measured by EBCT. Most studies of CAC quantification as a predictor of the presence of high-grade coronary artery stenoses or of the risk of future ACEs have been done using EBCT, and more studies are needed to confirm or refute that MDCT-derived CAC scores have the same implications as EBCT-derived CAC scores.
Coronary Calcium Scoring for the Detection of Coronary Artery Stenoses
Because of the biologic process of coronary remodeling, in which arteries can increase their cross-sectional area to accommodate growing atherosclerotic plaque, not all CAC found on CT imaging translates into the presence of high-grade coronary stenoses. A large amount of plaque, represented by a large quantity of CAC, can be present before clinically significant luminal narrowing occurs. However,
when coronary plaque occupies approximately 40% of the enlarged coronary artery cross-section, the vascular remodeling capacity becomes exhausted and angiographically discernible—and eventually hemodynamically significant—encroachment upon the coronary artery lumen occurs with increasing plaque burden. Therefore, and because of the epidemiology of coronary artery calcification described in the previous section, appropriate ageand gender-adjusted thresholds must be considered if the quantity of CAC is to be used to predict the presence of high-grade coronary stenoses as the cause of chest pain in symptomatic patients.
when coronary plaque occupies approximately 40% of the enlarged coronary artery cross-section, the vascular remodeling capacity becomes exhausted and angiographically discernible—and eventually hemodynamically significant—encroachment upon the coronary artery lumen occurs with increasing plaque burden. Therefore, and because of the epidemiology of coronary artery calcification described in the previous section, appropriate ageand gender-adjusted thresholds must be considered if the quantity of CAC is to be used to predict the presence of high-grade coronary stenoses as the cause of chest pain in symptomatic patients.
In one study of 1,225 men and 539 women, thresholds of the Agatston score measured using EBCT differentiated between symptomatic patients who had a high or low probability of significant coronary artery stenoses detected by invasive angiography, and EBCT was highly sensitive and moderately specific in predicting high-grade coronary artery stenoses. In particular, the absence of any CAC on EBCT scanning was associated with a very low probability of high-grade coronary artery stenoses (Fig. 4.1) (12). In another study of 1,851 symptomatic patients, the power of coronary calcium scores to predict the severity and extent of angiographically significant coronary artery disease (CAD) was incremental to and independent from the clinical predictors “age” and “gender” in symptomatic patients, and most useful in an intermediate risk population (13).
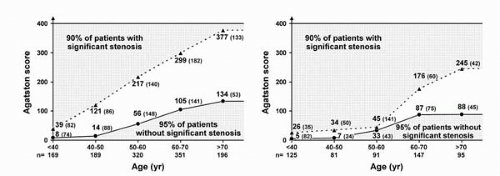 Figure 4.1. Age- and gender-stratified thresholds of the Agatston score signifying high or low likelihood of flow-limiting coronary artery stenoses in 1,764 symptomatic patients who underwent coronary artery calcium scoring before invasive coronary angiography. Left, data for 1,225 men. Right, data for 539 women. Ninety-five percent of patients with Agatston scores below the lower threshold values (connected by solid line) had no significant coronary artery stenoses. The numbers in parentheses next to the threshold values represent the number of patients who fell into this group (lower gray area). Ninety percent of patients with Agatston scores above the upper threshold values (connected by broken line) had significant coronary artery stenoses. The numbers in parentheses next to the threshold values represent the number of patients who fell into this group (upper gray area). At Agatston scores between the two threshold values (white area), the probability of significant coronary artery disease was indeterminate. Overall, 8% of men and 7% of women fell into this group. (Adapted with permission from Haberl R, Becker A, Leber A, et al. Correlation of coronary calcification and angiographically documented stenoses in patients with suspected coronary artery disease: results of 1,764 patients. J Am Coll Cardiol 2001;37:451-457.) |
Coronary Luminography
Achieving minimally or noninvasive coronary luminography has been the Holy Grail of cardiac imagers for many decades. Coronary artery motion is fast, complex, and varies interindividually. To avoid motion artifacts, MR and CT coronary angiographic images usually are acquired during mid diastole, or occasionally during mid to late systole, because coronary motion is slowest at these time points. At the current stage of development, CT coronary angiography is easier to perform and more stable than MR coronary angiography (4). MR coronary angiography has advantages over CT coronary angiography in that it does not require potentially harmful ionizing radiation or the administration of iodinated contrast media. The results of representative, recent studies of minimally invasive coronary angiography with MRI (14,15), EBCT (15,16), and MDCT (17, 18, 19) compared with invasive, selective coronary angiography are listed in Table 4.1.
Stay updated, free articles. Join our Telegram channel

Full access? Get Clinical Tree


