The Role of Echocardiography and Tissue Doppler Imaging in Optimal Cardiac Resynchronization Therapy
Veronica Lea J. Dimaano
Theodore P. Abraham
Cardiac resynchronization therapy (CRT) has been shown to reduce morbidity and mortality among patients with intraventricular conduction defect and depressed left ventricular (LV) function who, despite optimum medical therapy, remained to be in New York Heart Association (NYHA) functional class III-IV.1,2 CRT improves the mechanical performance of the left ventricle and reduces mitral regurgitation (MR), resulting in relief of symptoms, improvement in exercise tolerance, and improvement in the quality of life (QOL).3,4,5,6 While cardiomyopathy patients with or without underlying ischemic heart disease might benefit from CRT, up to 30% do not respond to this therapy.3 Beneficial effects of CRT stem from the interplay of several factors that relate to preprocedural assessment of candidates for therapy, intraprocedural determinants such as lead placement, and postprocedural factors such as device programming after implantation (Fig. 5.1). Echocardiography with or without Tissue Doppler Imaging (TDI) provides important information on the ventricular contraction sequence and the hemodynamic consequences of asynchrony that may aid in identifying suitable patients and improving the selection criteria, optimizing lead placement, and optimizing CRT device settings during follow-up. It is noninvasive, readily available, and can be used repeatedly, making it an ideal imaging tool for follow-up studies. A separate chapter has been devoted to the role of echocardiography in the detection of mechanical dyssynchrony as a factor for patient selection. This chapter will be limited to the discussion of the role of echocardiography in optimizing device programming after implantation.
MECHANISM OF CRT
Three levels of impaired electromechanical synchrony can be addressed by CRT: Prolonged atrioventicular (AV) delay that impairs LV filling and promotes pre-systolic MR, Interventricular conduction delay resulting from right ventricle (RV) pre-activation with RV pacing or from left bundle branch block (LBBB) which may impede LV filling and ejection, and Intraventricular dyssynchrony that promotes inefficient myocardial contraction, increased MR, and abnormal ventricular remodeling.7 Beneficial changes in each distinct level of dyssynchrony translate to clinical improvements following CRT.8 Hemodynamic improvement seen with CRT is related to its ability to increase LV filling time, decrease septal dyskinesia, and reduce MR in the failing heart.9
ECHOCARDIOGRAPHIC EVALUATION FOLLOWING CRT
Response to CRT has been frequently evaluated on the basis of restoration of LV synchrony, hemodynamic and clinical improvements resulting from a more efficient LV pump function, and degree of symptom alleviation. Echocardiographic modalities can reveal important hemodynamic data by Doppler techniques in combination with geometric information con-cerning ventricular volumes, ejection fraction, and contraction patterns.10 Echocardiographic evidence of LV remodeling following CRT includes reduction in the LV end- systolic and diastolic dimensions and volumes; and LV mass with improvement of ejection fraction (EF), LV dP/dt, and myocardial performance index (MPI).11,12,13 Parameters of tissue Doppler longitudinal velocities and tissue tracking (TT) can predict LV reverse remodeling, but the same does not hold true with measurement of longitudinal strain.14,15
Optimal AV Delay
The rationale for optimizing programmed AV delay in CRT is to maximize preload through optimal synchronization of atrial contribution to LV filling at the onset of LV systole. In the presence of a long AV delay, LV activation is delayed but the atrial activation is not. Consequently, both the early passive filling and the atrial “kick” may occur simultaneously resulting in a reduced transmitral blood flow and decreased preload.9, 16 Furthermore, incomplete closure of the mitral valve (MV) may occur because of failure of a properly timed
ventricular systole to follow atrial contraction. Ventriculoatrial gradient resulting from atrial relaxation and initiation of ventricular contraction may result in a “diastolic” MR, which further reduces preload and therefore stroke volume (SV).17,18 Short AV delay, on the other hand, modifies late diastolic filling dynamics. Interruption of the active atrial transport by the premature closure of the MV resulting from the onset of the ventricular contraction compromises SV.19 As such, defining the optimal AV delay for each individual patient is deemed important to create an impact on the hemodynamic improvement and clinical benefits from CRT. Echocardiography can provide information on the timing of LV filling and atrial transport critical to maximizing preload and SV.
ventricular systole to follow atrial contraction. Ventriculoatrial gradient resulting from atrial relaxation and initiation of ventricular contraction may result in a “diastolic” MR, which further reduces preload and therefore stroke volume (SV).17,18 Short AV delay, on the other hand, modifies late diastolic filling dynamics. Interruption of the active atrial transport by the premature closure of the MV resulting from the onset of the ventricular contraction compromises SV.19 As such, defining the optimal AV delay for each individual patient is deemed important to create an impact on the hemodynamic improvement and clinical benefits from CRT. Echocardiography can provide information on the timing of LV filling and atrial transport critical to maximizing preload and SV.
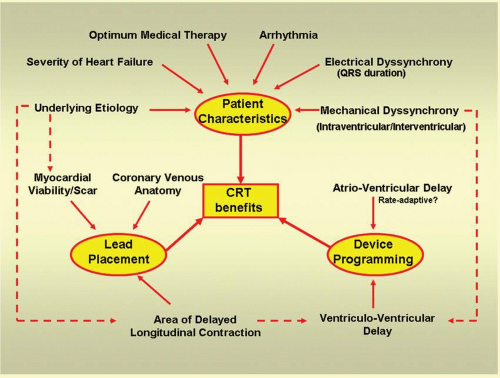 FIG. 5.1. Factors affecting the outcome in CRT. Patient’s response to CRT is determined by the interaction of one’s individual clinical characteristics with intraprocedural outcome and the device programming. The determinants of these three factors are in turn multifactorial, and interplay (broken red line) among these determinants will impact the net benefit from pacing therapy. |
Echocardiographic Interrogation of Optimal AV Delay
Optimization of AV delay following device implantation has been more commonly achieved by performing Doppler echocardiography and analyzing flow velocity profiles at the level of mitral, aortic, and left ventricular outflow tract (LVOT), as well as the MR flow profile.20,21,22 Optimal AV delay can be calculated from the LV filling times during long and short AV delays or determined by dynamic AV delay programming with measures of acute hemodynamic benefit as surrogates.
Assessment of Transmitral Flow Pattern
Pulsed-wave (PW) Doppler analysis of the mitral inflow pattern provides insight into the role of left atrial (LA) contribution to LV filling. Proper timing of ventricular contraction relative to atrial contraction and relaxation is characterized by an increase in the LV filling time and complete separation of the mitral E and A waves without causing truncation on the latter.
Doppler interrogation of the mitral inflow is best performed on the apical four-chamber view, where flow is usually parallel to the ultrasound beam. PW sample volume, 1-2 mm in size, is placed either on the tip of the ventricular side of the open mitral leaflets or at the level of mitral annulus, depending on which parameter is being assessed. Parameters of diastolic function that relate to the transmitral gradient are best obtained at the tips of the valve leaflets while
those reflecting changes in flow should be measured from recordings of the inflow velocity at the mitral annulus, where the cross-sectional area (CSA) is more stable.23 Spectral display of mitral A wave is also more defined when sample volume is placed in the mitral annulus.24
those reflecting changes in flow should be measured from recordings of the inflow velocity at the mitral annulus, where the cross-sectional area (CSA) is more stable.23 Spectral display of mitral A wave is also more defined when sample volume is placed in the mitral annulus.24
Technical Considerations
Pitfalls in recording mitral E and A wave velocities are related to misalignment of the ultrasound beam, misplacement of sample volume, and suboptimal machine settings.
Poorly defined signals arising from improper alignment of the beam with the direction of the blood flow may also render measurements unreliable. Hence, optimizing ultrasound beam alignment and proper adjustment of the machine settings should be done. Overestimation of mitral velocity time integral (VTI) may result from incorrect placement of sample volume too far into the left ventricle. Respiration as well as changes in the position of intracardiac structures during contraction and relaxation may relatively vary the location of the sample volume during the entire cardiac cycle. Attention to consistency of sample volume location is important in serial or comparative studies. Technically this error can be minimized by performing the assessment on a breath-hold and by placing the sample volume in midway between the level of the mitral annulus and the mitral leaflets.24 Alternately, in patients for whom breath-holding is a problem, turning the respirometer signals may aid in identifying VTI spectral display recorded at expiration.
Error may also arise from improper tracking of the Doppler trace. Failure to trace the modal velocity or the brightest line may result in inconsistent measurements. When tracing the velocity to derive a VTI, it is best to trace the outer edge of the most dense (or brightest) portion of the spectral tracing and ignore the dispersion that occurs near peak velocity.23
Iterative Method Using Diastolic Filling Time (DFT) or Mitral Inflow VTI (E-A VTI) The iterative method using transmitral PW Doppler optimizes AV delay by allowing maximal separation of the early passive filling “E” wave and the active atrial transport “A” wave without being extremely short as to produce early closure of the mitral valve. It is performed by programming a long AV delay that is shorter than the intrinsic PR interval, but long enough to preserve biventricular capture. Alternately some authors programmed long AV delay 30 ms short of the intrinsic PR interval. The AV delay is gradually shortened at decrements of 20 ms until truncation of the A wave is observed (Fig. 5.2A and Fig. 5.2B). Gradual prolongation of AV delay at increments of 10 ms is performed until truncation is eliminated (Fig. 5.2C).20, 22, 25 DFT, the interval from the onset of E wave to A wave terminus, is measured for each programmed AV delay. Alternately, one can measure EA VTI, a surrogate of diastolic filling volume for a given length of AV delay.26 Measurement of E wave or A wave VTI alone is not encouraged because at long AV delay, fusion of E and A waves (Fig. 5.2A) resulting from near simultaneous occurrence of early filling and the atrial kick may interfere with the accuracy and consistency in the measurements. Optimal AV delay is set at the setting corresponding to the E and A wave separation with the greatest VTI. Iterative method using DFT and/or EA VTI is performed at both atrial-sensed (AS) and atrialpaced (AP) biventricular pacing.
Ritter Method Ritter’s formula aims to maximize LV diastolic filling time without interruption of the “atrial kick.” This method was originally developed for patients with high-grade AV block requiring a dual-chamber pacemaker. In a small study by Melzer et al. Ritter’s formula was found to have good correlation with radionuclide ventriculography when used in optimizing AV interval among patients with reduced LV function.27 According to Ritter, pacing in DDD with a long AV delay results in the abbreviation of the DFT as a result of premature MV closure before the onset of ventricular contraction. Conversely, when AV delay is shortened inappropriately, end-diastolic filling flow is abruptly interrupted by the ventricular contraction when LA pressure is still high.28 The Ritter method requires PW Doppler imaging of the mitral inflow during a long and an inappropriately short AV delay. At each AV delay setting, the time interval from the termination of mitral A wave to the onset of the paced QRS is measured and designated as QA long and QA short, respectively (Fig. 5.3A and Fig. 5.3B). Optimal AV delay is derived using the following formula: Optimal AV delay = SAV short + ([SAV long + QA long] − [SAV short + QA short]) where SAV long and SAV short are long and short sensed AV delay, respectively.26
Ishikawa Method (Ishikawa and Inoue) A modification of Ritter’s formula was devised by Ishikawa et al. who theorized that the AV delay at which the end of the mitral A wave coincides with complete MV closure may be optimal. This method is carried out by simultaneous recording of phonocardiogram and the PW Doppler of transmitral flow at a slightly long AV delay. The time interval from the termination of A wave to the complete MV closure (mitral component of S1) is measured. Alternately this interval can also be derived from the termination of mitral A wave to the end of diastolic MR. Using this method, optimal AV delay is predicted by decreasing the long AV delay by the measured time interval. The optimal AV delay predicted by this formula correlated positively with optimall AV delay determined by an increase in invasively measured cardiac output (CO) and a decrease in pulmonary capillary wedge pressure (PCWP).29,30
Meluzin Method Further modification of the Ritter and Ishikawa methods was proposed by Meluzin et al. Instead of using the onset of paced QRS (Ritter method), the mitral component of S1 on phonocardiogram or the duration of low velocity diastolic MR (Ishikawa method), Meluzin used the
onset of the high velocity systolic MR as a more precise index of the onset of ventricular contraction. Thus, in an atrialtriggered biventricular pacing, transmitral pulsed Doppler echocardiography is performed at a programmed long AV interval that is 5-10 ms less than the maximum AV delay at which full ventricular capture is still preserved. The time interval (t1) between the end of A wave and the systolic component of the MR jet is measured. This t1 represents the interval by which the tested long AV delay must be shortened to achieve the time connecting the end of the late ventricular filling with the beginning of the atrial contraction (Fig. 5.4). Hence, optimal AV delay is predicted as tested long AVD-t1. This technique correctly predicted settings with maximal cardiac output (measured by catheterization) in 15 of 18 (78%) patients. This approach however relies on the presence of MR which is a significant limitation.31
onset of the high velocity systolic MR as a more precise index of the onset of ventricular contraction. Thus, in an atrialtriggered biventricular pacing, transmitral pulsed Doppler echocardiography is performed at a programmed long AV interval that is 5-10 ms less than the maximum AV delay at which full ventricular capture is still preserved. The time interval (t1) between the end of A wave and the systolic component of the MR jet is measured. This t1 represents the interval by which the tested long AV delay must be shortened to achieve the time connecting the end of the late ventricular filling with the beginning of the atrial contraction (Fig. 5.4). Hence, optimal AV delay is predicted as tested long AVD-t1. This technique correctly predicted settings with maximal cardiac output (measured by catheterization) in 15 of 18 (78%) patients. This approach however relies on the presence of MR which is a significant limitation.31
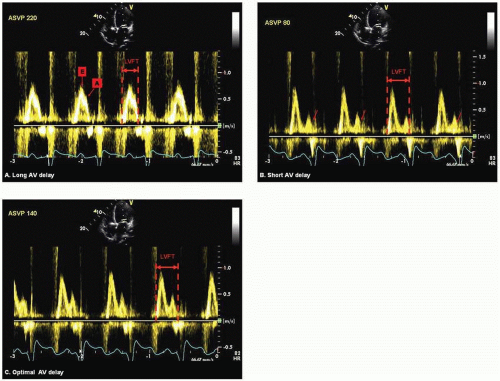 FIG. 5.2. A: During a long-sensed or paced AV delay, LV filling time (LVFT) is shortened as a result of delayed mitral valve opening, causing near simultaneous occurrence of early diastolic filling and the atrial kick, and manifesting as fused mitral E and A waves on Doppler spectral display. B: With short AV delay, early ventricular contraction results in the abrupt closure of the mitral valve, causing truncation of the mitral A wave (small red arrows). While prolongation of LVFT is achieved with short AV delay, preload compromise occurs as a result of an abbreviated atrial kick manifested by a truncated A wave. C: At optimal AV delay LVFT prologation is achieved without causing A wave truncation. |
Ismer Method Ismer et al. proposed that, in patients with DDD pacemakers, the variation in the duration of the LV electromechanical latency period is a reflection of ventricular function, and therefore should be considered in optimizing diastolic AV delay and in upgrading from RV to biventricular DDD pacing. LV electromechanical latency period is defined as the duration between premature ventricular stimulation and the prematurely ending LA contribution to LV filling.32
Ismer’s method requires simultaneous recording of the mitral inflow PW Doppler signals, filtered LA electrogram through a bipolar esophageal electrode, and the real-time sensed-event markers in defining the duration of the individual components of an AV delay. Pacemaker-related inter atrial conduction time (IACT) is defined as the time interval between the right atrial (RA) sensed-event marker(MA) or RA pacing stimulus (SA) to the onset of the LA deflection in the esophageal electrogram (MA-LAor SA-LA for VDD and DDD settings respectively) (Fig. 5.5A). LA electromechanical action, measured during unphysiologically programmed long AV-delay, is the time interval from the onset of the LA deflection to the end of the LA contribution in the transmitral flow (end of mitral A wave) (LA-EAC long). (Fig. 5.5B)
Ventricular electromechanical latency period, measured during unphysiologically programmed short AV-delay, is the interval between the ventricular pacing stimulus and the truncation of the atrial contribution (SV-EAC short). Thus, optimal AV delay is predicted by the following formula for VDD setting: (MA−LA + LA-EAC long) – SV-EAC short, and for DDD setting: (SA−LA + LA EAC long) – SV-EAC short.32,33 Ismer’s method parallels the optimization principle proposed by Ritter with emphasis on the various components of the AV delay, more specifically IACT.
Ventricular electromechanical latency period, measured during unphysiologically programmed short AV-delay, is the interval between the ventricular pacing stimulus and the truncation of the atrial contribution (SV-EAC short). Thus, optimal AV delay is predicted by the following formula for VDD setting: (MA−LA + LA-EAC long) – SV-EAC short, and for DDD setting: (SA−LA + LA EAC long) – SV-EAC short.32,33 Ismer’s method parallels the optimization principle proposed by Ritter with emphasis on the various components of the AV delay, more specifically IACT.
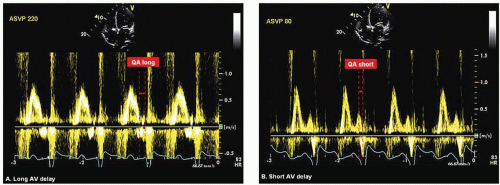 FIG. 5.3. Ritter method: A: At long AV delay, the time interval between the termination of the mitral A wave (or fused E and A waves in this figure) and the onset Q wave on surface EKG represents QA long. B: At short AV delay, the time interval between the onset of the Q wave and the termination of the mitral A wave represents QA short. Optimal AV delay = SAV short + ([SAV long + QA long] − [SAV short + QA short]) where SAV long and SAV short are long and short sensed AV delay respectively |
Doppler-derived Rate of Pressure Rise (RPR) as an Index of LV dP/dt LV dP/dt, an index of left ventricular systolic function, is typically derived from LV pressure curve obtained during cardiac catheterization. Continuous wave (CW) Doppler signal of MR jet can accurately measure instantaneous pressure gradient between LA and LV by applying the simplified Bernoulli principle: δP = 4v2 where δP is the change in pressure and v is velocity).34
Doppler-derived RPR is evaluated using a standard apical four-chamber view. Optimized CW Doppler of MR jet is captured ensuring alignment of the regurgitant jet with the beam. The Doppler envelope is maximized from 0 to —4 ms by adjusting the baseline, reducing the velocity scale, and increasing the sweep speed to at least 100 mm/s. From the MR jet signal, two velocity time points are used as a reference and the time taken for these velocities to change is measured, i.e., the time (dt) taken for the MR jet velocity to change from 1 m/s to 3 m/s (Fig. 5.6). Using the modified Bernoulli equation, the velocity of 1 m/s and 3 m/s correspond to a derived pressure of 4 mm Hg and 36 mm Hg respectively yielding a 32 mm Hg pressure difference (dP). Temporal relationship between these points is determined as dt. Therefore LV dP/dt = 32/dt. Determination of the optimal AV delay using Doppler-derived dP/dt utilizes the dynamic sequential pattern of AV delay programming in iterative method.35
Technical Considerations
Suboptimal Doppler signals resulting from poor alignment of the Doppler beam with the regurgitant jet direction may underestimate the LV dP/dt. Valve click artifacts may obscure the early MR jet Doppler profile and may render measurements inaccurate.
Myocardial Performance Index Tei Index or MPI is a simple noninvasive Doppler-derived assessment of the overall cardiac function. It is defined as the summation of isovolumic contraction and relaxation times corrected to the ejection time.36 Tei index correlates well with invasive measurements of systolic and diastolic peak dP/dt.37 It is commonly used as an index of the systolic and diastolic function of the heart. It has been used to evaluate response to CRT38 and as a hemodynamic surrogate to identify optimal AV delay in biventricular pacemakers.39,40
Assessment of MPI is performed using mitral inflow and LVOT PW Doppler signals. From the apical four- and five-chamber views, PW sample volume is positioned at the tips of the mitral valve and just below the aortic valve respectively. Velocity curves are recorded at sweep speed of 100 mm/s. The time interval between the cessation of the mitral A wave and the onset of the succeeding mitral E wave (a) corresponds to
the summation of isovolumic contraction time, LV ejection time, and isovolumic relaxation time (Fig. 5.7A). The LV ejection time (b) is measured from the interval between the onset and cessation of LVOT velocity curve (Fig. 5.7B). The sum of isovolumic times was obtained by subtracting the ejection time from the A-E interval. The index is the sum of isovolumic times divided by ejection time. Thus, MPI = (a-b)/b.36,40 The optimal AV delay is that AV interval that yields the lowest MPI. Setting of various AV interval during interrogation proceeds in a dynamic sequential pattern of iterative method.40
the summation of isovolumic contraction time, LV ejection time, and isovolumic relaxation time (Fig. 5.7A). The LV ejection time (b) is measured from the interval between the onset and cessation of LVOT velocity curve (Fig. 5.7B). The sum of isovolumic times was obtained by subtracting the ejection time from the A-E interval. The index is the sum of isovolumic times divided by ejection time. Thus, MPI = (a-b)/b.36,40 The optimal AV delay is that AV interval that yields the lowest MPI. Setting of various AV interval during interrogation proceeds in a dynamic sequential pattern of iterative method.40
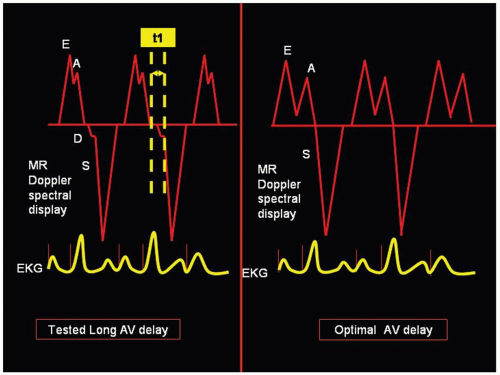 FIG. 5.4. Meluzin Method: Precise determination of the end of atrial and onset of ventricular contractions is of utmost importance in the identification of optimal AV delay. The high velocity systolic (S) component of mitral regurgitation (MR) used to identify the onset of ventricular contraction in this technique should be easily differentiated from the diastolic component of the MR jet. With long AV delay diastolic MR (D) occurs as a result of the reversal of left atrio-ventricular pressure gradient during atrial relaxation before the onset of ventricular contraction and is therefore characterized by low velocity signals. Using this method, the programmed long AV delay should be shortened by t1 which is the time interval between the termination of the A wave and the onset of systolic MR (S) to time the onset of ventricular contraction immediately after the end of atrial contraction. Thus, optimal AV delay = tested long AV delay – t1 |
Stay updated, free articles. Join our Telegram channel

Full access? Get Clinical Tree


