(1)
Division of Public Health Sciences, Wake Forest School of Medicine, Winston-Salem, NC, USA
Synopsis
The goal of this chapter is to facilitate understanding of the repolarization model which is the backbone of this monograph. The main repolarization landmark is the peak of the T wave (Tp) on the ST-T wave spatial magnitude curve (‘global’ ST-T wave). At the time of Tp the largest number of left ventricular myocytes is at some point of phase 3 of their action potential. In normal repolarization sequence the time point of Tp to represent left ventricular epicardial repolarization time (RTepi). The other important landmarks of the repolarization model are Txd, the inflection point at T wave downstroke and Te, the end of the T wave, and the corresponding repolarization times (RT) RTxd and RTe. RTe is the ‘global’ repolarization time and RTxd is taken by the repolarization model as the best ECG estimate of endocardial repolarization time (RTendo). All RT subintervals vary with heart rate and they need to be represented as rate-adjusted intervals labeled RTea, RTpa, (RTepi)a and (RTendo)a where ‘a’ refers to the rate-adjusted interval. The common link between QTpa, RTepi and RTendo in the repolarization model is Ѳ(Tp|Tref), the spatial angle between Tp and Tref vectors.
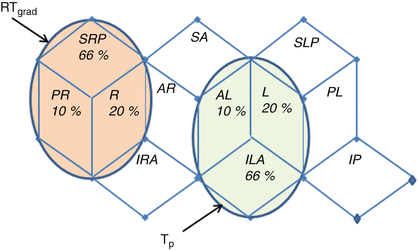
A rhombic lattice dividing space into 12 equal-sized directions is used to quantify three-dimensional (3-D) spatial distributions of repolarization vectors. A display format is introduced for practical display of 3-D data as a 2-D display obtained by opening up the 3-D rhombic lattice in posterior midline and projecting all 12 rhombic faces to the frontal plane. In this display the majority of Tp vectors (66 %) in normal women are in direction Inferior-Left-Anterior (ILA), with 22 % in direction Left (L) and 10 % in Anterior-Left (AL) as the faces of the rhombus are labeled in order of the spatial directional dominance with respect to principal axes. Because the spatial direction of repolarization is diametrically opposite to the direction of the Tp vector, the normal direction of repolarization sequence is in 66 % of the women in Superior-Right-Posterior (SRP), 22 % in Right (R) and 10 % in Posterior-Left (PL) direction. This indicates a relatively tight directional clustering of normal repolarization.
Abbreviations and Symbols
AL
Anterior-left
ILA
Inferior-left-anterior
L
Left
PR
Posterior-right
QTe
QTend interval
RT
Repolarization time
RTe
‘Global’ repolarization time (equal to QTe)
RTea
Rate-adjusted RTe
RTendo
Endocardial repolarization time
(RTendo)a
Rate-adjusted RTendo
RTepi
Epicardial repolarization time
(RTepi)a
Rate-adjusted RTepi
RTp
RTpeak interval
SRP
Superior-right-posterior
Tp
Peak of the global T wave
3.1 Temporal Landmarks of Repolarization
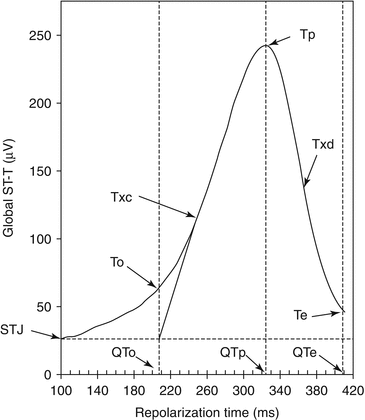
The main ECG variables from the repolarization model are defined in Table 3.1. The landmarks of repolarization are labeled on the graph of the ST-T wave magnitude curve (the global T wave) in Fig. 3.1. The main repolarization landmark is the peak of the T wave (Tp). At the time of Tp the largest number of left ventricular myocytes is at some point of phase 3 of their action potential. RTp in Fig. 3.1 denotes repolarization time (RT) of the left ventricular myocyte layers which in normal repolarization reach the end of their repolarization at time of Tp. The other important global T wave landmarks are To, the onset of the T wave, and Txd, the inflection point at T wave downstroke and Te, the end of the T wave. In addition to RTp, the other two important repolarization times in the model are RTxd and RTe. RTe corresponds to the QTe interval and RTxd is the QTxd interval. RTxd is taken by the repolarization model as the best ECG estimate of endocardial repolarization time (RTendo).

Table 3.1
Definitions of main ECG variables of the repolarization model
Acronym | Description | Excel algorithm |
|---|---|---|
QTpa | Rate adjusted QTp Interval (ms) | Log-linear formulas: |
 | ||
 | ||
Alternative linear formulas: | ||
 | ||
 | ||
TpTxd | LV crossmural repolarization time gradient (ms) | TpTxd = interval from Tp toTxd, where Txd is the inflection point at global T wave downstroke |
RTepi | Epicardial repolarization time (ms) |  |
RTxd = RTendo | LV repolarization time at time point Txd (ms) |  |
aѲ(Tp|Tref) | Tp vector deviation angle from normal reference direction (°) |  |
Ѳ(R|STT) | Spatial angle between the mean QRS and STT vectors |  |
Ѳ(Rp|Tp) | Spatial angle between the peak QRS and T vectors |  |
Ѳ(Tinit|Tterm) | Spatial angle between the mean initial and terminal T vectors |  |
Ѳ(Tterm|Tref) | Spatial angle between the mean terminal T vector and Tref vector |  |

Fig. 3.1
A schematic illustrating main variables of the repolarization model defined explicitly in Table 3.1. In normal repolarization sequence, RTp represents RTepi. The TpTe interval is a measure of global temporal RT gradient or global RT dispersion, and the TpTxd interval is the regional left ventricular free wall cross-mural RT gradient (XMRTgrad). A line extrapolated backward to the intersection of the horizontal line from the end of QRS identified time point of To. Te is T wave end; To T wave onset; Txc inflexion point (maximum slope) at T wave upstroke; and Txd is the Inflexion point (minimum slope) at T wave downstroke. STT vector magnitude curve is shown at 40 sample points along RT from QRS end to Te. Arrows at RTp, RTxd, and RTend indicate RT at point of Tp, Txd, and Te, respectively
3.2 Two-Dimensional Reference Frame for Quantization of Three-Dimensional Distributions of ECG Variables
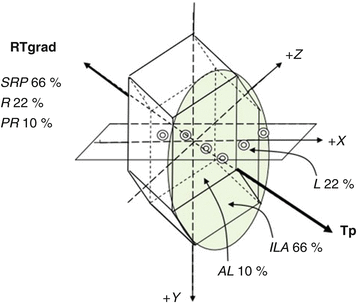
Electrophysiologists generally consider the time point of Tp to represent left ventricular epicardial repolarization (RTepi). However, as shown next this assertion is valid only if Tp vector direction is normal, i.e., if the spatial direction of repolarization sequence is normal. Thus, it is necessary to consider spatial direction of repolarization at time point of Tp in order to properly estimate RTepi and RTendo. A rhombic lattice dividing space into 12 equal-sized directions is used to quantify spatial distributions of repolarization vectors (Fig. 3.2). A practical display of 3-D distributions is shown for RTp in normal women in Fig. 3.3. This display is obtained by opening up the 3-D rhombic lattice in posterior midline and projecting all 12 rhombic faces to the frontal plane such as shown in Sect. 3.4.


Fig. 3.2
Anterior view of a rhombic duododecahedron lattice with 12 symmetrical spatial reference directions used for quantifying directional distributions of ECG vectors. The letters in the acronyms denote the directions in order of the closeness to left (L), right (R), inferior (I), superior (S), anterior (A) and posterior (P) directions of the X, Y and Z axis. In normal repolarization 96 % of the Tpeak (Tp) vectors are within the oval shaded light orange in reference directions left, inferior-left-anterior and anterior-left (L, ILA and AL, respectively)

Fig. 3.3


Distribution of Tpeak (Tp) vector and repolarization time gradient (RTgrad) vectors in 12 spatial directions in normal adult women in simplified representation of the 3-D display in Fig. 3.2. The 3-D rhombus was opened at posterior midline and the rhombic faces were projected on the frontal plane. The letters in the labels refer to the six principal directions: L Left, R Right, I Inferior, S Superior, A Anterior, P Posterior. The letters in acronyms for rhombic faces are in order of dominance of principal axis: ILA Inferior-Left-Anterior, etc. Spatial distribution of the RTgrad vectors is diametrically opposite to Tp vector distribution because current flow during repolarization is opposite to that during depolarization
Stay updated, free articles. Join our Telegram channel

Full access? Get Clinical Tree


