(1)
Ospedale Civile di Vigevano, Vigevano, Italy
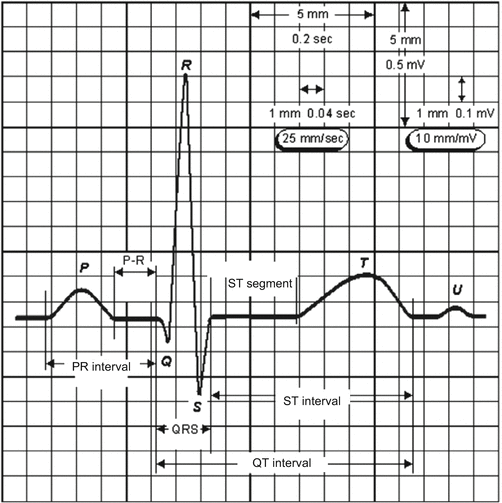
The electrocardiograph is a galvanometer calibrated to produce a deflection with an amplitude of 1 cm for every millivolt (mV) of voltage. The electrocardiogram (ECG) is recorded on graph paper divided into small 1-mm squares. At the standard paper speed of 25 mm/s, each small square corresponds to 40 ms (Fig. 3.1). Before the ECG is recorded, the machine must be calibrated to ensure that it is functioning correctly, and the square (or rectangular) calibration mark must be recorded on the tracing.


Fig. 3.1
Single components of an ECG and their temporal relations
The ECG is composed of a series of deflections, the P wave, the QRS complex, and the T wave, separated by isoelectric segments known as the PR interval and the ST segment.
The P Wave
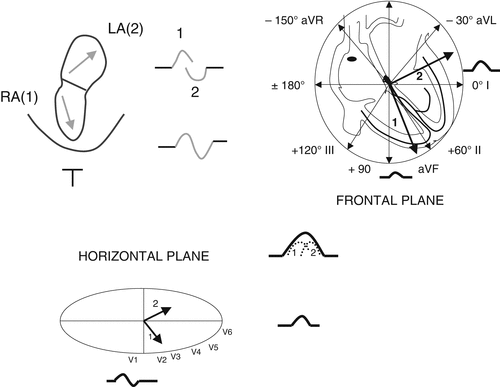
The P wave is the graphic representation of atrial electrical activation. It normally has a duration of 50–120 ms and a maximum amplitude of 2.5 millimeters (generally recorded in lead II). Atrial depolarization normally proceeds downward from the SA node and from right to left. The mean electrical axis in the frontal plane thus ranges from +10° to +90°. The P wave is positive in the inferior leads, negative in lead aVR, and positive in all the precordial leads except V1, where it is biphasic (positive, then negative). Deviations from these norms are suggestive of an ectopic atrial rhythm. The P wave includes two components: the first corresponds to the activation of the right atrium, the second to that of the left atrium. The phase of atrial repolarization—the Ta wave or complex—is normally not visible on surface ECGs: it occurs during ventricular depolarization and is therefore obscured by the QRS complex (Fig. 3.2).


Fig. 3.2
The P wave is composed of two main vectors, which reflect depolarization of the right (1) and left (2) atria. The two vectors are shown in the frontal plane (as viewed by the limb leads) and in the horizontal plane (as seen by the precordial leads). RA right atrium, LA left atrium
The PR Interval
The PR interval represents the time needed for atrioventricular conduction. It is measured from the beginning of atrial activation to the beginning of ventricular activation, and its normal duration is from 120 to 200 ms.
The QRS Complex
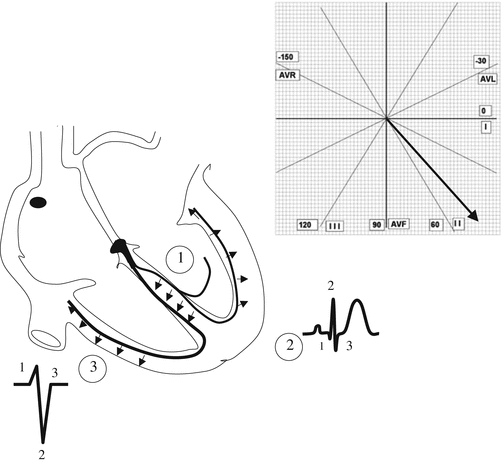
The QRS complex represents ventricular depolarization, which begins in the interventricular septum, proceeding from the endocardium to the epicardium and from left to right. It then extends to the free anterior walls and finally the posterobasal regions of the two ventricles (Fig. 3.3). The main direction of the depolarization wavefront is from top to bottom and from right to left in the frontal plane and from back to front and from right to left in the horizontal plane. In the frontal plane, the electrical axis of the QRS complex generally ranges from −10° to +80°.


Fig. 3.3
Ventricular depolarization. Phase 1 involves depolarization of the interventricular septum; phase 2 that of the free wall of the ventricles; and phase 3 that of the posterobasal wall
The normal QRS complex has a duration of 60–100 ms. The Q wave is the first negative deflection after the P wave, the R wave is the first positive deflection, and S wave is the first negative deflection after the R wave. A second positive deflection sometimes follows the S wave and is indicated by the letter R’. Upper- and lower-case letters are used to designate high- and low-voltage waves, respectively. The amplitude of the QRS complex varies: aside from cardiac diseases, it is affected by the size of the chest and the volume of air interposed between the heart and the exploring electrodes. The maximum amplitudes of the R wave are <23 mm in the frontal plane (usually seen in lead II) and <25 mm in leads V5 and V6. The maximum amplitude of the S wave in V2 is <25 mm. A normal Q wave is characterized by an amplitude that is less than 25 % of that of the R wave that follows it and measures <3 mm in the left precordial leads and ≤2 mm in the limb leads. Its duration should be less than 40 ms.
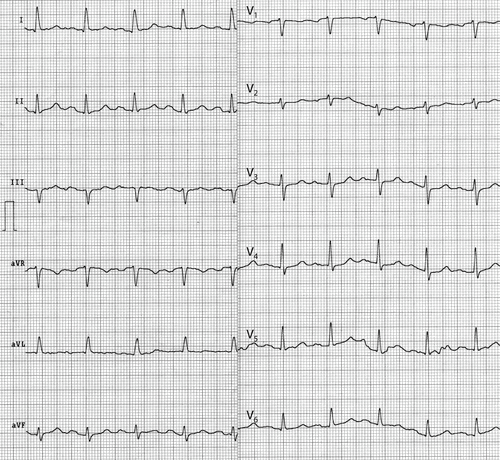
In the precordial leads, the R-wave amplitude increases progressively from lead V1 to lead V5, while that of the S wave decreases, a phenomenon referred to as R-wave progression. The amplitudes of the two waves generally become similar in lead V3 or V4 (i.e., the R/S ratio becomes ~1). The point where this occurs is referred to as the transition zone (Fig. 3.4), and in some healthy individuals, it appears earlier, i.e., in lead V2 or V3. This normal variant is referred to as clockwise rotation around an ideal longitudinal axis, which passes through the heart from the plane of the atrioventricular valves to the apex (Fig. 3.5). In leads V5 and V6, the interval between the beginning of the QRS complex and the peak of the R wave normally does not exceed 40 ms (in the absence of a Q wave) or 50 ms (if a recordable Q wave is present). This interval, which is known as the R-wave peak time, reflects epicardial depolarization of the ventricles.


