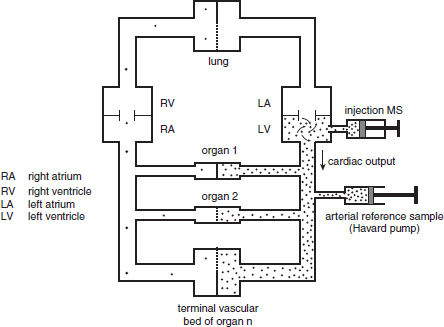
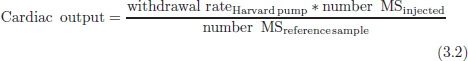
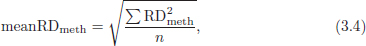
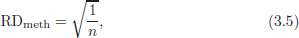
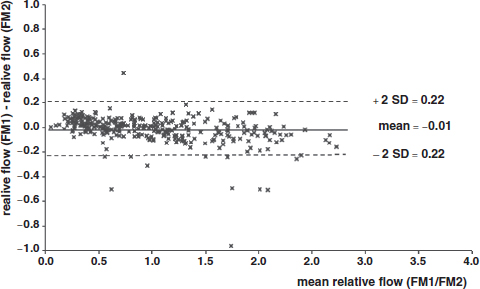
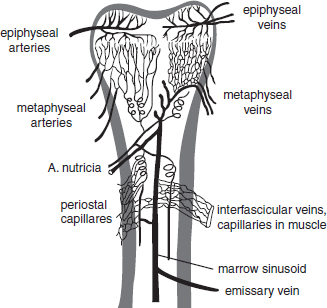
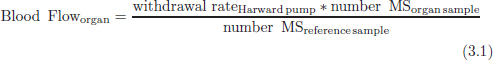
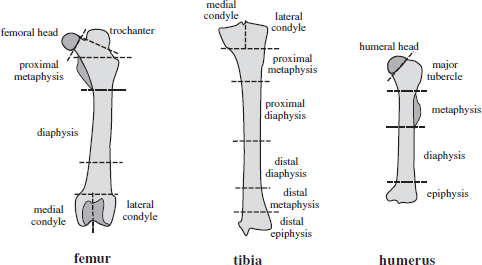
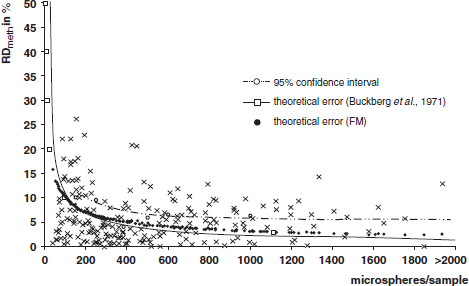
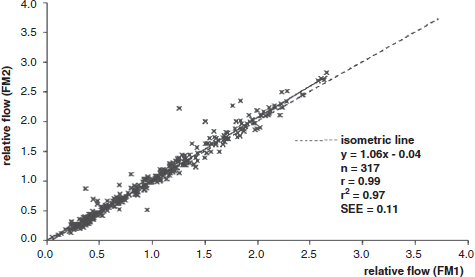
CHAPTER 3 Bone tissue possesses the particular capacity to adapt to prevalent mechanical stress during the entire life span.108 This requires continuous bone remodeling, which in turn depends on an adequate supply of nutrients and oxygen via the vascular system. It would hence be expected, that pathological conditions that entail anabolic or catabolic processes of the skeleton (e.g., fracture healing, osteoporosis, chronic regional pain syndrome, osteonecrosis, and arthrosis) would result in alterations of bone blood flow. In 1691, the Englishman Clopton Havers described how blood vessels enter long bones and, once inside, subdivide into the bone marrow. He theorized at that time that the contraction of small glands inside the bone marrow releases a nutritional fluid, which then is distributed inside the bone by means of small canals.47 These canals soon became known as Haversian canals. However, despite the fact that the importance of blood supply for bone growth and bone healing was already established by the 19th century, it would take another 100 years for knowledge about the vascular architecture of bone to be significantly augmented. The introduction of new methods such as the Spalteholz technique,91 microangiography57, 100 by means of injection with Indian ink,18 or the injection of plastics109 allowed for a detailed investigation of the arterial and venous blood supply as well as of the capillary system of bone. The arterial supply of long bones is comprised of several vascular systems. In the diaphyseal region, one or two nutritional arteries enter the bone via the nutritional foramina. They subdivide and supply predominantly the diaphyseal bone and the bone marrow.19 Inside the marrow, the nutritional arteries form a sinusoid capillary network.98 In the metaphyseal and epiphyseal regions of a long bone, multiple arteries of varying caliber enter from the periarticular vascular network also by means of canals.2, 79, 99 During growth, the physis forms a barrier between these two capillary systems, whereas after the completion of growth, multiple anastomoses are formed. This leads to epiphyseal and meta-physeal arteries providing up to 40% of a long bone’s perfusion. They supply the subchondral plate, the subarticular trabeculae and the cancellous bone of the metaphysis.98, 99 Periosteal vessels also contribute to bone vascular supply by mainly perfusing the cortical bone and by forming anastomoses with vessels from the marrow space.28, 99 Within the bone tissue, blood vessels run within the Haversian canals and within the Volkmann canals with both of these systems being interconnected.37 Within the marrow space, the capillary network consists of sinusoid vessels (analog to the liver sinusoids) that drain into collecting veins. From these, the venous blood is carried via so-called emissary veins that penetrate the bone cortex in immediate proximity to a nutritional artery.28, 99 The venous blood from the epiphysis and metaphysis is regionally collected and drained via epi- and metaphyseal veins. The periosteal venous complex is connected to the collecting vein as well as to intramuscular and interfascicular veins. Fig. 3.1 schematically displays the blood supply of a long bone. Knowledge of bone hemodynamics is essential for the understanding of physiological and pathological processes.65 This is underscored by the fact that under physiological conditions, total skeletal perfusion reaches 10% of cardiac output (CO) in rabbits.1, 88 It is the goal of this chapter to provide an overview of the current knowledge of bone perfusion with specific consideration of the microsphere method. Whereas the vascular architecture of bone in general is well understood, there are only few experimental studies that examine intraosseushemodynamics. One reason for this situation lies in the considerable technical difficulty in performing perfusion measurements within such a complex vascular architecture and within the dense bone tissue. The microsphere method (MS-method) probably represents the most suitable tool for the measurement of regional bone blood flow (RBBF). Rudolph and Heymann introduced the use of radioactive microspheres (RM) for the measurement of regional organ blood flow in 1967.80 This method is based upon the principle that microspheres (MS) that were injected into the left ventricle are homogeneously distributed within the blood stream because of the turbulent flow within the ventricle. MS are distributed with the blood into the periphery and become lodged in the precapillary bed of all organs due to the larger diameter of microspheres than of the capillary vessels. Because of the homogenous distribution of the microspheres in the arterial blood, the number of MS within a certain tissue volume is proportional to the organ perfusion. About one year later, this method was improved upon by the addition of the technique of arterial reference sampling.30, 54, 64, 69 During and after the injection of the MS, arterial blood is sampled by means of a precision pump with a known withdrawal rate. As a result, a virtual reference organ with a known perfusion is generated. At the end of the experiment the number of MS in the reference blood samples and in the tissue samples were determined indirectly by counting the radioactivity or measuring the fluorescence intensity. The blood flow of the organ of interest can be calculated as follows: The underlying principle is schematically explained in Fig. 3.2. Once this method had been introduced, regional blood flow was tested by means of RM for applicability and validated for various organs by a large number of experiments.11, 22, 29, 64, 106 The radioactivity of the spheres entails several disadvantages. Beyond the health hazards for the laboratory personnel and considerable time consumption (continuous monitoring for radioactivity in the laboratory, proper disposal of contaminated experimental tissues), the use of RM also is rather costly (approved laboratories, correct disposal of contaminated objects, special equipment for radioactivity monitoring). Fig. 3.2. Schematic drawing of the microsphere method. Microspheres are injected into the left ventricle. Because of the turbulent flow, they will be homogenously distributed within the arterial blood. From the left ventricle, MS are traveling with the blood stream into the periphery and are trapped due to their bigger diameter in the capillary system. Only 1–4% of MS are shunting through the capillary bed, but become trapped in the capillary bed of the lung. During and after the injection of the spheres, arterial blood is sampled by means of a Harvard pump with a known withdrawal rate. Blood flow in an organ can then be calculated from the respective number of spheres contained in the organ and in the arterial reference sample. Another disadvantage is the limited usability of RM in long-term experiments based on a short half-life of the employed isotopes and on the finding that isotopes may dissociate from the microspheres during the experiments and hence lead to erroneous results.101 These disadvantages implied a clear need for non-radioactive indicators to be used with such MS. Hale et al. introduced colored MS that led to valid measurements in comparison to RM.43 Because of the toxicity of the solvent required to extract the dye from the MS and because of the high time consumption for the necessary processing, this technique in the end could not replace the RM method. In 1993, Glenny et al. introduced fluorescent microspheres (FM) and validated these in comparison to RM.38 The key advantage of FM lies in the fact that they exhibit a characteristic excitation and emission (light) spectrum, which in turn enables the exact determination of the intensity of each particular fluorescent dye by use of a fluorescence spectrophotometer. Initially, time consumption with this method was still comparatively high and methodical errors during sample processing proved to be another problem. In 1999, the Institute for Surgical Research at the LMU Munich was successful in developing a dedicated filtration system (sample processing unit: SPU), which allowed for a complete recovery of MS from blood and tissue samples.74 Completely automated sample processing further increased precision and reliability of the FM method while at the same time drastically reducing the required time.93 The superiority of the FM method versus colored MS or RM has since been established in numerous experiments on heart, lungs, kidneys, muscle, spleen, and brain38, 72, 73, 83, 84, 94, 101 and eventually also in bone.6–10 The predominant advantages of using the MS method by means of FM as opposed to other techniques are: •The measurement of RBBF can be performed minimally invasively and without direct manipulation of the bone itself. •Heterogeneity of blood flow within a long bone can be studied. •The absolute blood flow within an organ can be calculated by using arterial reference sampling, which in turn permits for the comparison of the blood flow between different regions of the same long bone and between right and left sides in paired bones. •Methodological errors can easily be controlled for by simultaneously injecting two different microsphere species. •The blood flow values of other organs can be determined simultaneously. Knowledge of blood flow in other organs like lung or kidneys is essential to exclude methodological errors due to inadequate mixing or shunting of the spheres. The application of this method for measuring bone blood flow requires that its inherent limitations are well understood and that potential sources of error are excluded. In order to achieve highly precise and valid measurements, the following recommendations regarding experimental setup and error limitation should be followed: •Aprerequisite for the valid application of the MS method is a homogenous distribution of the MS within the blood.104 Injection of the MS into the left ventricle guarantees such a homogenous distribution because of the predominantly turbulent flow within the left ventricle.16, 20, 22, 59 In our experiments, we ascertained a correct position of the injection catheter before each individual injection by means of obtaining the typical left ventricular pressure curve. A symmetrical distribution of MS between both kidneys can be used as an additional parameter because of the typically symmetrical perfusion of both kidneys.16 In none of the experiments performed did we observe a difference between the blood flow values of the left and the right kidneys. •Stochastic errors may occur because of too low a number of MS in tissue samples or in the arterial reference samples.21, 22 The number of MS in a tissue sample is dependent upon the specific hemodynamic conditions, the regional organ blood flow, the size of the tissue samples, and the number of MS injected. Depending on sample size, in a rabbit at least 1 million MS per kg body weight (BW) should be used.6 We developed a standardized dissection scheme for humerus, femur, and tibia in rabbits (Fig. 3.3) and we were able to demonstrate that most bone samples contained in excess of 400 MS. Only both femoral condyles, both distal tibialdiaphyses and both distal tibialmetaphyses contained fewer MS, but still a minimum of 150 MS each, which according to other authors’ results still yields reliable measurements.71 •Since the method is based on the principle that all injected MS are being lodged in the capillary bed of an organ, none or only a minimal proportion of these MS should reach the venous circulation by means of arteriovenous anastomoses. Should, in fact, a significant number of MS bypass the targeted capillary bed, an underestimation of the real bone perfusion would be the result. This potential source of error can be quantified independent of the MS diameter and by the determination of the so-called shunt rate. In bone, the shunt rate with MS with a diameter of 15 µm is typically between 1 and 4%.39, 41, 42, 45, 46, 66 Even though the shunt rate of MS with a diameter of 15 µm is low, recirculation from other organs such as the gastrointestinal tract or the soft tissue in general could lead to an overestimation of the real organ perfusion. Since MS with a diameter of 15 µm are typically completely caught in the lung’s capillary bed, this source of error appears to be negligible.11, 54, 104 An increase in lung perfusion with repeated measurements could therefore be an indirect indicator for a high shunt rate. We observed an increase in lung perfusion neither in short-term nor in long-term experiments despite an up to sixfold injection with 1 × 10⁶ MS/kg BW, which also argues against the existence of a relevant shunting of MS.10 •The blood flow measurement of an organ depends significantly upon the hemodynamic situation at the moment of MS injection. Arterial pressure and CO therefore need to be known for a correct interpretation of the measured blood flow values and CO should be determined during the experiment.11 The number of MS in the source suspension may vary after repeated aliquotingdespite adequate shaking, vortexing, and ultrasonication.6 As a consequence, the specific number of MS injected should be measured from a separate reference aliquot for each injection. •A potentially relevant influence of the injected MS upon the hemodynamic situation in the experimental animal has been investigated in numerous studies and was uniformly found to be nonexistent.22, 24, 29, 54, 58, 59 We observed no compromise of the macrohemodynamical parameters in any of our experiments despite injections of up to 21 × 106 MS/kg BW.10 •There also appears to be no appreciable compromise of the local bone microcirculation as a result of the partial embolization of the precapillary vascular bed. On the one hand, the total number of blocked capillaries remains very small. On the other hand, it has been shown in one study employing intravitalmicroscopy, that the embolization of arterioles and capillaries by MS leads to an immediate opening of collateral vessels, which renders a relevant effect of such embolizations onto the local microcirculation improbable.44 We also observed a perfect consistency of results when employing simultaneous injection of MS for RBBF-measurements in short-term as well as in long-term experiments, virtually excluding a relevant effect of these embolizations upon the local hemodynamics. •In order to reduce a systematic error induced by a loss of indicator dye during sample processing in our experiments, we utilized an automated robotic system with an SPU for the isolation of FM from tissue and blood samples.74, 93 In contrast to other organs, the usage of FM in bone requires a decalcification process to be used prior to further tissue processing. We have shown that such a decalcification process does not adversely affect the fluorescence characteristics of the FM.6 •Faulty arterial reference blood sampling also might be the source of a methodical error. Typically, such blood draws are performed via a catheter in the abdominal aorta, the carotid artery, or the auricular artery. The location of these catheters does not introduce a methodical error.10, 22, 92 The reference blood draw must begin simultaneous to the MS injection and must be continued until oneminute after the end of the MS injection.11 When drawing more than three samples, we recommend a sampling speed of 1.76 ml/min, since above 3.54 ml/min, an influence on the macrohemodynamics is possible as a result of hypovolemia. By means of validation studies, we have been able to establish the MS method using FM in combination with arterial reference blood draws as being a precise and reliable technique for measuring RBBF. The evaluation of methodological errors was performed under stable hemodynamicconditions5 as well as under induced hypovolemia.5 The mean methodological error (meanRDmeth) was calculated according to the method described by Zwissler et al.112 from the absolute blood flow values (ml/min/100g) obtained by simultaneously injecting MS: where n is number of tissue samples where n is number of MS in tissue samples where RDcount is measurement error. For the use of FM, the methodological error was found to be 7.5 ± 1.5%. The methodological error (RDmeth) consists of the theoretical error (RDtheo) and the measurement error (RDcount), which originates from the quantification of fluorescence or radioactivity, respectively. The theoretical error was comparable for all types of MS. The real measurement error (composed of the methodical and the theoretical errors) was lowest with the use of FM (3.6 ± 3.2%) as compared to RM (5.7 ± 4.7%). Since the absolute number of MS in different body regions varies dependent on tissue volume and blood flow, the methodical error (RDmeth) pertaining to each tissue sample was calculated against the number of MS in the tissue sample. The upper limit of the 95% confidence interval (CI) of the coefficient of variation was 9.6% for bone samples containing between 151 and 250 MS for both, FM and RM. When tissue samples contained more than 384 MS per sample, the upper limit of the 95% CI was at 6.2% for FM (Fig. 3.4) and at 8.6% for RM. Fig. 3.4. Methodological error of the FM method is dependent of the number of MS within the tissue sample (n = 240). The x-axis shows the number of MS per sample whereas the y-axis shows the mean methodical error in percent. In addition, the theoretical error (according to Buckberg et al., 1971) as well as the real theoretical error and the lower limit of the 95% confidence interval are displayed. In order to compare the intra methodological as well as the inter methodological reliability of the FMS method, we compared the blood flow values that were obtained by simultaneously injecting differently labeled MS according to the method of Bland and Altmann.17 The comparison of simultaneously measured blood flow values yielded highly concordant results, under constant hemodynamic conditions as well as under hypotension.7, 8 In rabbits, valid measurements can be performed even after the injection of a total of 15 × 106 MS. We were also able to demonstrate that valid bone blood flow values can be obtained with the MS method in long-term experiments.9 Figures 3.5 and 3.6 display the relative blood flow values after the simultaneous injection of two different FM species, calculated by means of a regression analysis and according to the method of Bland and Altmann.17 Under constant hemodynamic conditions in rabbits, the mean blood flow is approximately 14 ml/min/100g in the humerus, approximately 11 ml/min/100g in the femur, and approximately 7 ml/min/100g in the tibia.7, 88 One possible reason for this difference could be a different arteriovenous pressure gradient or a different peripheral vascular resistance. Previous works already have suggested that regional blood flow varies between different regions within a long bone.25, 55, 87 We therefore studied the RBBF distribution of the long bones and found that RBBF within the humerus was highest in the greater tubercle (about 24 ml/min/100g) followed by the metaphysis (about 20 ml/min/100g). The lowest RBBF values were observed in the diaphysis and in the distal epiphysis (about 9 ml/min/100g). Within the femur, the highest RBBF values were measured in the femoral neck (about 20 ml/min/100g) whereas the femoral condyles were significantly less perfused (about 6 ml/min/100g). In the femoral head, the greater trochanter, and the metaphysis, RBBF varied between 8 ml/min/100g and 14 ml/min/100g. Within the tibia, the highest RBBF values were observed in the proximal metaphysis (about 13 ml/min/100g) and medial and lateral tibialcondyle (about 11 ml/min/100g), whereas the lowest values were found in the distal epiphysis and the epiphysis (about 3 ml/min/100g). The RBBF distribution (heterogeneity) within a long bone remained identical under constant and under altered hemodynamic conditions. It is well known that RBBF shows variability between individuals. We were able to demonstrate that there are no side differences by comparing blood flow values of right- and left-sided bone samples from identical regions of humerus, femur, and tibia under constant and various hemodynamic conditions. This observation is in keeping with the results of many other investigators.1, 23, 34, 39, 55, 66, 77, 89, 92 Because of interindividual variance, we recommend comparing the corresponding left- and right-sided regions in experimental settings, since this practice permits sensitive detection of even small alterations in RBBF. By using such intraindividual comparisons, the number of experimental animals can also be reduced significantly. Figure 3.7 shows the heterogeneity of RBBF in long bones. Fig. 3.5. Regression analysis of relative flow values of each bone sample obtained by simultaneous injection of microspheres. The solid line represents the slope of linear relationship; the dotted line is the isometric line (y = 1x + 0). Fig. 3.6. Comparison of relative flow values of each bone sample obtained by simultaneous injection of microspheres according to Bland and Altman. The data show uniform distribution of scatter above and below zero and a mean difference of 0.00 ± 0.11 (mean ± SD); the solid line represents mean difference and the dotted line ±2 standard deviation.
THE MICROSPHERE METHOD FOR
INVESTIGATING BONE BLOOD FLOW
3.1 The Microsphere Method


3.2 Bone Blood Flow Studies
3.2.1 Heterogeneity of bone blood flow
Stay updated, free articles. Join our Telegram channel

Full access? Get Clinical Tree


