(1)
Ospedale Civile di Vigevano, Vigevano, Italy
General Considerations
Reductions in blood flow (and consequently the oxygen supply) to the myocardium can cause transient or permanent damage (ischemia and necrosis, respectively). Atherosclerosis of the coronary arteries is the most common cause. In most cases, the ischemia initially involves the subendocardial layers of the myocardium, which are characterized by a higher metabolic rate and oxygen consumption than the subepicardial layers since they more exposed to extravascular compressive forces (systolic tension, ventricular filling pressure). Only later does the damage extends to the full thickness of the myocardium (Fig. 11.1).
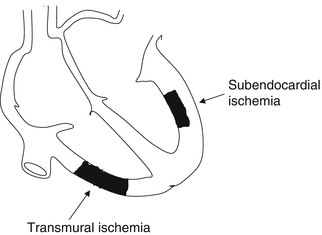

Fig. 11.1
Schematic comparison of transmural ischemia from that confined to the subendocardial layers. See text for details
The main electrocardiographic (ECG) changes associated with myocardial ischemia involve the ST segment, the T wave, and the QRS complex. The nature and time-courses of these changes vary depending on the extension and temporal characteristics (acute vs. chronic, transient vs. persistent) of the ischemia and on the concomitant presence of other factors that can complicate diagnosis (bundle-branch blocks, pacemaker rhythms, WPW-type ventricular preexcitation).
Acute ischemia modifies the morphology and duration of the transmembrane action potential of the myocardial cells. Those of the subendocardial layers display decreases in the resting potential, the amplitude and velocity of phase 0, and the duration of the action potential (Fig. 11.2a). The result is an electrical gradient between ischemic and normal cells during the whole cardiac cycle. The ischemia may be caused by incomplete occlusion of a coronary vessel, in which case it will be confined to the inner layers of the myocardium (subendocardial ischemia), or by complete (transient or permanent) occlusion, in which case it will involve the full thickness of the myocardium (transmural ischemia).


Fig. 11.2
(a) During acute ischemia, the action potential of the ischemic cells (bold black line) exhibits a decrease in the resting voltage, a slope increase in phase 4, and a decrease in overall duration, as compared with the action potential of healthy cells (dotted line). For additional details, see Chap. 1. (b) During chronic ischemia, the action potential of the ischemic cells (bold black line) displays an increase in duration with respect to that of healthy cells (dotted line)
The main ECG correlate of acute ischemia is displacement of the ST-segment from its normal position on the isoelectric line, which reflects the tendency of normal cardiomyocytes to repolarize in a uniform manner. In the presence of subendocardial ischemia, the leads “facing” the affected area record a depressed ST segment (Fig. 11.3). In contrast, transmural ischemia will be associated with ST-segment elevation in these leads and reciprocal ST-segment depression in the leads whose positive poles are oppositely directed (Fig. 11.4). Transmural ischemia can also produce significant changes in the T waves with the same electrical and clinical implications. The initial phase of ischemia is associated with an increase in voltage (T-wave peaking, referred to as hyperacute T-wave changes). It may be followed by ST-segment elevation and T-wave pseudonormalization (positivity of T waves that are negative under baseline conditions). Unlike the ECG changes that occur during subendocardial ischemia, those associated with transmural ischemia are closely correlated with the affected region of the myocardium.
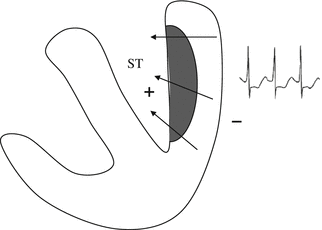
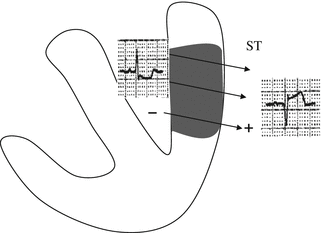

Fig. 11.3
In subendocardial ischemia, the electrical vector is moving away from the healthy area of the myocardium (electronegative) and toward the ischemic zone (electrically positive). The leads facing the latter zone will thus record a depression of the ST segment

Fig. 11.4
During transmural ischemia, the electrical vector is directed from the electronegative endocardium to the electropositive epicardium. The overlying lead records an approaching vector—therefore an elevation of the ST segment—while the lead exploring the opposite wall records a vector moving away from it, which will be reflected by reciprocal depression of the ST segment
Two different mechanisms have been proposed to explain ischemic elevation of the ST segment. The first assumes that the elevation is produced during electrical diastole, the ECG correlate of which is the TQ interval. In this case, the elevation is believed to reflect partial or complete depolarization of the ischemic cells, whose electrical charge is negative relative to their nonischemic counterparts, during phase 4 of the action potential. The result would be a flow of current (the so-called current of injury) represented by a vector directed away from the ischemic zone toward the nonischemic areas, which are positively charged during diastole. On ECG, these events would translate into TQ-segment depression (Fig. 11.5a) in the leads facing the ischemic zone. However, the electrocardiographs commonly used in clinical settings, which operate on AC power, automatically realign the TQ segment with the isoelectric line, thereby producing an apparent level change in the ST-segment, which is equal in magnitude and opposite in direction to the level change involving the TQ segment.
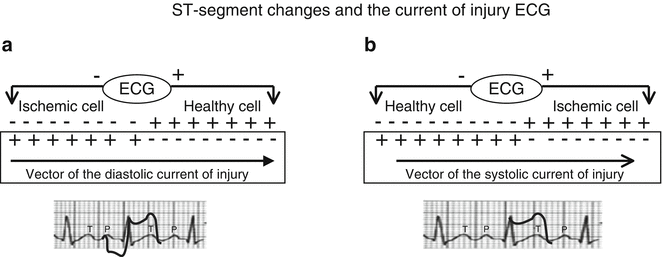

Fig. 11.5
ST-segment changes in the diastolic (a) and systolic (b) current of injury hypotheses. See text for details
The second hypothesis assumes that the current of injury develops during electrical systole (Fig. 11.5b), which corresponds to the ST segment itself. It is based on the electrophysiological alterations in ischemic cells mentioned above (i.e., reduction of the resting potential, reduction of the amplitude and velocity of phase 0, and reduction of the overall duration of the action potential). These conditions result in an electrical current that flows from the nonischemic zone (where the cells are normally depolarized and therefore electronegative) toward the ischemic zone, which is prematurely repolarized or incompletely depolarized. The leads over the ischemic zone therefore record an elevation of the ST segment, which, as noted earlier, is often associated with reciprocal ST-segment depression in the opposite leads.
The phenomenon of ST-segment depression is caused mainly by delayed repolarization phase in the ischemic subendocardial zone. The ST-segment vector is therefore directed as usual from the epicardial to the endocardial layers, that is, from the nonischemic to the ischemic zone (Fig. 11.3). ST-segment depression is often associated with prolongation of the QT interval. The shape and appearance of the depressed ST segment is important: horizontal and down-sloping ST depressions of at least 1 mm are considered significant, whereas the significance threshold for up-sloping depressions is 1.5 mm (Fig. 11.6).
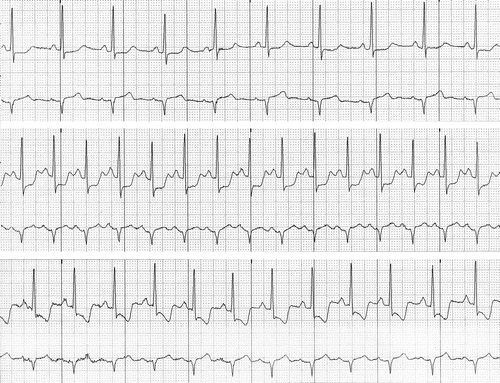

Fig. 11.6
Holter recording from a patient experiencing episodes of subendocardial ischemia. Top strip (baseline conditions): Mild (<1 mm) ST-segment depression. Middle strip: The depression (horizontal) becomes more marked (4 mm). Bottom strip: As the ischemia becomes more severe, the morphology of the ST segment changes again: the down-sloping depression is a peculiar, specific characteristic of myocardial ischemia
Chronically ischemic cells repolarize later than healthy cardiomyocytes because their action potentials are prolonged (Fig. 11.2b). The subepicardial zone recovers more slowly than the subendocardial myocardium: therefore, repolarization is represented by a T-wave vector moving from the epicardium to the endocardium. For this reason, the ECG alteration typical of this phase involves an inversion of T-wave polarity (from positive to negative) in the leads exploring the ischemic region (Fig. 11.7). Under these conditions, T-wave negativity in a given lead is generally associated with transmural ischemia in the area being explored by that lead.
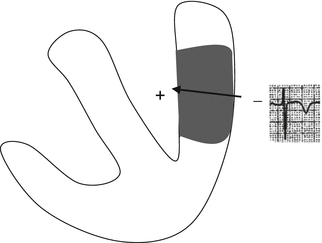

Fig. 11.7
Schematic of the T-wave vector in the chronic phase of transmural ischemia: the subepicardial area is electronegative since it repolarizes later than the subendocardial area. The vector moves away from the exploring electrode and a negative T wave is recorded
The QRS-complex changes classically associated with myocardial necrosis appear in the post-acute phase of infarction and consist of “new” Q waves (not seen on previous recordings) with a duration of ≥40 ms and an amplitude at least one fourth that of the R wave in the same lead. It is important to recall that, in certain leads (the precordials in particular), Q waves can be physiological, reflecting septal depolarization. Pathologic Q waves will be found in two or more anatomically contiguous leads. This is especially true of lead III, where the appearance of Q waves is considered abnormal only if they are also present in leads II and aVF.
Q waves are a reflection of the necrotic tissue’s electrical inertness, that is, its inability to generate the electrical activity that would normally counterbalance similar forces originating in the opposite wall. The absence of electrical activity in a specific area results in the appearance of a QRS vector moving away from the necrotic zone and therefore inscribed as a negative deflection (Fig. 11.8). Abnormal Q waves were once considered a distinguishing feature of transmural myocardial infarctions. It has now become clear, however, that they may also develop in patients with nontransmural necrosis. Even more important, Q waves may well be absent in cases of transmural necrosis. As a result, myocardial infarctions are now electrocardiographically classified as Q-wave or non-Q-wave MIs. In the latter cases, the ECG alterations are confined to the ST segment and T wave. Phases of transient ischemia may also be associated with QRS alterations, mainly consisting of increased in amplitude and conduction disturbances. (Examples will be provided below in the section on angioplasty.)
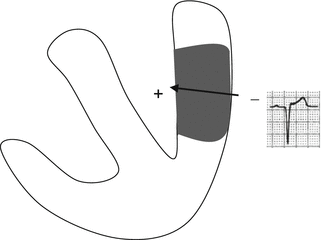

Fig. 11.8
QRS vector in the presence of necrosis: the vector is moving away from the electrode, so a negative deflection (Q wave) is recorded
It is important to stress that the ST-segment and T-wave changes that develop during ischemic heart disease (T-wave inversion in particular) may also appear in nonischemic forms of heart disease (left ventricular overload, myocarditis, pericarditis, hypertrophic cardiomyopathy), during certain types of drug therapy or electrolyte imbalances, and even in young persons (females in particular) with no significant heart disease. The saying that an ECG must first be described and then interpreted is never so true as in ischemic heart disease, and it becomes a valid basis for diagnosis only when analyzed within the specific clinical context of the case at hand. Failure to recall this rule can lead to misdiagnosis, sometimes with grave consequences.
Clinical and Electrocardiographic Pictures
The main clinical manifestations of coronary heart disease are stable angina pectoris and the acute coronary syndromes, which include unstable angina and myocardial infarctions (Q-wave and non-Q-wave forms). The different clinical pictures reflect specific characteristics of the endoluminal surfaces of atherosclerotic plaques in coronary arteries. In stable disease, the fibrous surface of a plaque tends to be smooth. The presence of ulceration triggers a chain of events, the most important of which is coronary thrombosis, which may be occlusive or nonocclusive. Stable angina is generally indicative of the presence of a soft plaque. Ulcerated plaques with thrombosis may be associated with myocardial infarction or unstable angina.
Stable Angina Pectoris
In patients with stable angina, the ischemic episodes are usually associated with subendocardial ischemia, which is expressed on the ECG by ST-segment depression that varies in magnitude and extension with the extension of the coronary artery disease (Fig. 11.9). During the ischemia-free intervals the ECG returns to its baseline pattern, which is often normal. Ischemia develops when oxygen consumption increases as a result of physical exertion, a hypertensive crisis, anemia, emotional stress, etc. In rare cases, ECGs recorded during angina secondary to subocclusive coronary lesions will display ST-segment elevation or transient positivity of T waves that were formerly negative.
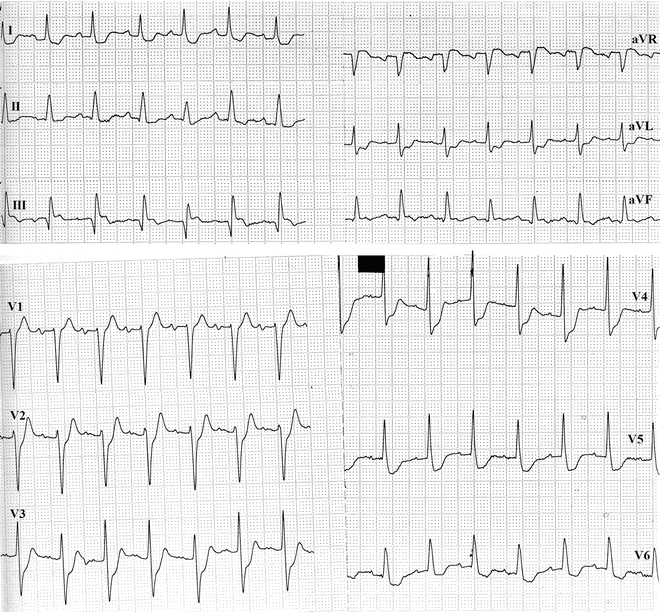

Fig. 11.9
Subendocardial ischemia associated with exertional angina in a patient will multivessel disease involving the left main coronary artery and the right coronary artery. A lesion of the latter was responsible for the prior inferior myocardial infarction reflected by the small Q waves in the inferior leads. The remarkable extension of the coronary artery disease is reflected by the magnitude of the ST-segment depression and the number of leads in which it appears (leads V2 through V6, I, and aVL). Limb leads are shown at the top, precordial leads at the bottom
Unstable Angina
In this case, the ischemia is recurrent and no longer confined to periods of increased oxygen consumption, occurring also at rest. The ECG changes range from ST-segment depression (reflecting subendocardial ischemia) (Fig. 11.8) to ST-segment elevation (Fig. 11.10) or pseudonormalization of T waves (Fig. 11.11). In recent years, greater emphasis has been placed on the role of lead aVR in assessments of the extension of coronary artery disease. ST-segment elevation in this lead has in fact been strongly linked to high rates of mortality, ischemic events, and critical lesions of left main coronary artery or severe triple-vessel disease. The elevation in lead aVR is associated with reciprocal ST-segment depression in other leads and is considered an important ECG index of coronary artery disease extension (Fig. 11.12).
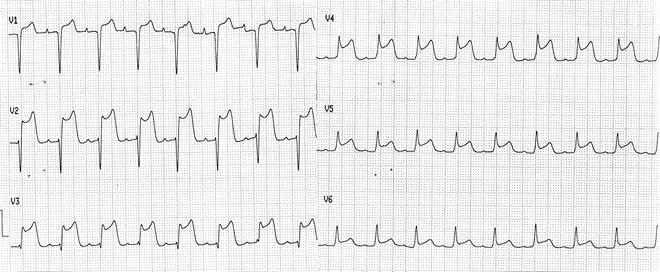
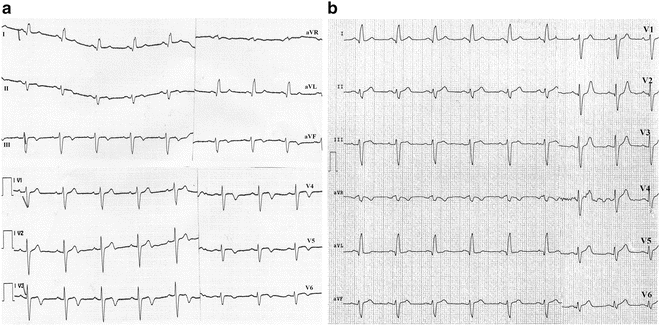
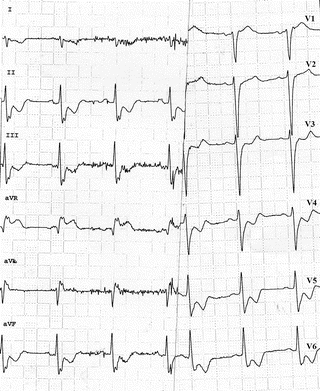

Fig. 11.10
Precordial lead tracings from a patient with unstable angina and transient ST-segment elevation caused by critical lesion of the proximal LAD

Fig. 11.11
Transmural ischemia during an episode of unstable angina secondary to critical stenosis of the left anterior descending artery. The ischemic area extends beyond the apex and involves part of the inferior wall. The baseline ECG (a) shows negative T waves in the anterior and inferior leads. During ischemia (b) the T waves in these leads become positive

Fig. 11.12
Subendocardial ischemia in the anterior and inferior leads a patient with critical lesions of the left main coronary artery and the right coronary artery. ST-segment elevation exceeding 2 mm is seen in lead aVR
After several hours to several days of repeated or protracted episodes of ischemia, it is not uncommon to see T-wave inversion in leads facing the affected zone, with prolongation of the QT interval (Fig. 11.13). These so-called postischemic giant negative T waves are caused by the prolonged action potential of the ischemic cells: they are unrelated to the acute ischemia and are not an indication of clinical worsening.
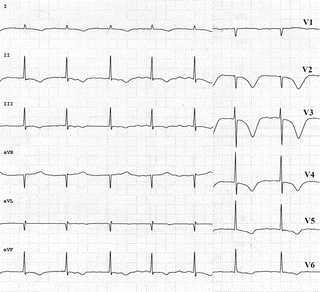

Fig. 11.13
Postischemic giant negative T waves in the anterior leads
Myocardial Infarctions
The myocardial fibers are capable of tolerating reduced or absent coronary artery blood flow for 20 or 30 minutes (ischemia). Thereafter, irreversible damage occurs in the form of cellular necrosis. Acute myocardial infarctions are customarily divided into two categories based on the nature of the coronary artery thrombosis. In the presence of occlusive thrombosis, the acute-phase ECG will show ST-segment elevation. Infarctions of this type are referred to as STEMIs (ST Elevation Myocardial Infarctions) to distinguish from those caused by nonocclusive thrombosis, which is manifested by transient or persistent ST-segment depression and/or T-wave changes (non-STEMIs or NSTEMIs). Pathological Q-waves may be seen in the post-acute phases of both types of infarction, but are particularly common in STEMI. Distinguishing STEMI from NSTEMI is of the utmost importance because the former is an indication for immediate reperfusion therapy (fibrinolysis or coronary angioplasty), whereas the latter can be managed with aggressive drug therapy and interventional solutions deferred.
Non-ST-Elevation Myocardial Infarction
The ECG changes seen in the initial phases of an NSTEMI involve the ST segment and T waves and resemble those described above for unstable angina. In rare cases, NSTEMIs may be associated with transient ST-segment elevation, which reflects temporary aggravation of the nonocclusive thrombosis by superimposed spasm of the affected coronary artery and is not followed by the development of Q waves.
ST-Elevation Myocardial Infarction
The main ECG alterations observed in patients with STEMIs include ST-segment elevation in the leads facing the ischemic area, followed by T-wave inversion and the appearance of new Q waves. In the initial phases of the MI, tall, peaked T waves may be recorded as a reflection of transmural ischemia. In the chronic phases, the ST-segment elevation tends to disappear. Much later, the negative T waves may also become positive again, leaving the Q wave as the only ECG sign of the infarction (Fig. 11.14).


Fig. 11.14
ECG changes in the various phases of myocardial infarction. (a) Stage 1: ST-segment elevation; (b) Stage 2. Appearance of Q waves; (c) Stage 3. ST segment isoelectricity restored and T-wave inversion; (d) Stage 4 (rare). Normalization of T-wave polarity, leaving the Q-wave as the only remaining sign of MI
As noted above, the ST-segment and QRS changes are sensitive, specific predictors of the areas affected by the ischemia and necrosis and of the coronary artery that is occluded (Table 11.1). The locations of the coronary arteries are shown in Fig. 11.15, and the diagram in Fig. 11.16 summarizes the distribution of coronary artery blood flow to the various segments of the left ventricle (as defined by the American Heart Association). Figure 11.17 shows the correlation between coronary anatomy, perfusion of the myocardial segments, and ECG localization of ST-segment and QRS alterations.
Table 11.1
Correlation between ECG patterns, infarcted myocardial segments, and culprit coronary vessel. (Modified from Bayes de Luna et al., 2006)
Name | ECG pattern | Infarcted segments
Stay updated, free articles. Join our Telegram channel
Full access? Get Clinical Tree
 Get Clinical Tree app for offline access

|
|---|