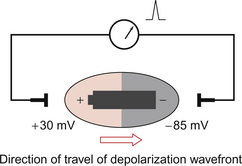
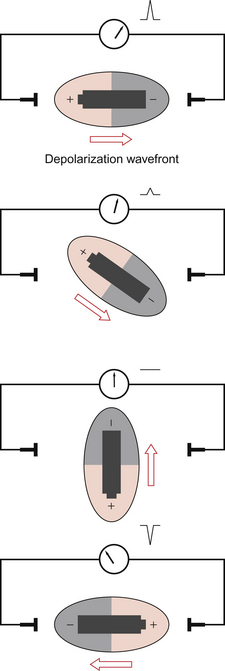
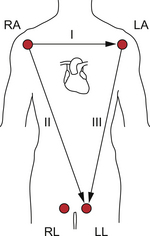
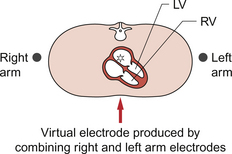
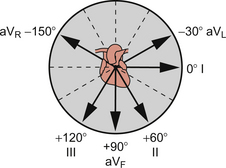
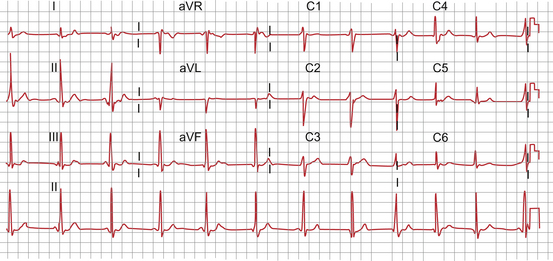
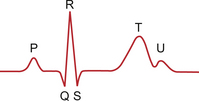
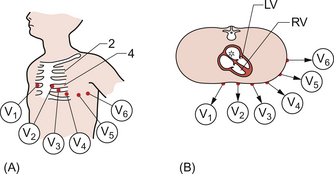
7 It is as important to recognize what the electrocardiogram (ECG) is not, as much as what it is. The origin of the cardiac action potential and the structure of the specialized conducting system of the heart are described in Chapter 3. The ECG is not a recording of the electrical activity of individual cells; it does not look like the action potential but reflects the activity of large numbers of cells taken en masse. It is possible to measure this activity because the heart lies in a container, the human body, which is full of a salt solution capable of carrying electrical current. Thus electrodes placed on the skin at a distance from the heart can be affected by the electrical changes within the myocardium. At rest the electrical activity of the heart dominates that of other excitable tissues such as nerve or skeletal muscle because of its relatively large mass and the coordination of its activity. A recording of the electrical activity of the heart is called an electrocardiogram. The overall net direction of the spread of excitation through the muscle mass of the left ventricle is called the cardiac axis. It is helpful to understand the characteristics of the ECG in terms of the underlying physical process. At rest the cardiac myocytes have a resting membrane potential around −85 mV (see Chapter 2). A group of cells undergoes depolarization; the membrane potential rises to around +30 mV before repolarization. Figure 7.1 shows a schematic ‘block’ of myocardial tissue that has groups of cells in all phases of polarization. The wavefront of depolarization is moving from left to right in the diagram from an area of tissue that has just been depolarized towards tissue which is about to be depolarized. If we consider electrodes applied to the left and right of our block of tissue we see that there is an electrical potential difference between the electrodes. It is this potential difference between the tissue in front of the wave of depolarization and the tissue behind it that we measure as an ECG. The flow of current is from behind the wavefront of depolarization to in front of it and this is by convention taken as ‘positive’ and produces an upward deflection of the recorder pen. The heart is a complex shape with depolarization spreading simultaneously in many different directions. At any one moment in time there will however be a dominant (net) direction of the spread of depolarization. By considering the heart as a battery lying in the direction of the spread of depolarization the sequential changes in deflection of the ECG pen can be more easily understood. This is equivalent to holding the battery at various orientations (Fig. 7.2). It is important to realize that it is not the heart that is changing orientation, only the direction of the wavefront of depolarization within the heart. The shape of the ECG waveform reflects the changing distribution of polarized and depolarized tissue within the heart with time. The amplitude of the ECG deflection reflects the mass of tissue involved. Thus the atrial element of the ECG (P wave) is always smaller than the ventricular element (QRS complex), even though the change in membrane potential is the same in each case. Hypertrophied ventricles, for example, resulting from hypertension, will tend to give larger deflections than the average. The amplitude of the ECG deflection is also affected by other physical factors such as size, chest inflation and fat tissue. • The ECG represents the spread of depolarization and repolarization through the myocardium. • The pattern of the ECG is dependent on the net activity of the myocardium at any given instant. • The pattern of the ECG is dependent on the relative orientation of the heart and the electrodes. • Many pathological factors within the myocardium such as hypertrophy and ischaemic damage affect the pattern of the ECG. • Many extracardiac factors such as posture and chest deformity may affect the ECG. What information can be derived from an ECG recording? • Heart rate: an ECG recording can trigger electronic ratemeters. • Rhythm: normal and abnormal rhythms can be recorded. • Conduction times through components of the heart can be evaluated from the duration of the components of an ECG trace. • The direction of the mean cardiac axis of the heart in both vertical and horizontal planes can be determined. • The extent and location of ischaemic damage. • The effects of altered electrolyte concentration. • The effects of drugs which affect the conducting system (antiarrhythmic drugs, digitalis glycosides, calcium channel blockers) can be monitored. Recording a 12 lead ECG requires the connection of two groups of electrodes to the subject: The limb lead electrodes are the simplest set of electrodes and were used by Einthoven in his experiments. The basic electrode positions are on the right arm, left arm and left leg. By using the electrodes in pairs we generate sets of measurements with a specific axis or vector described as a ‘lead’. Lead I utilizes the right and left arms and the axis of measurement is from right to left directly through the chest (Fig. 7.3). Lead I is taken as 0° and angles are measured clockwise from lead I. Lead II utilizes the right arm and left leg giving an axis theoretically at +60° to lead I. Lead III utilizes the left arm and left leg giving an axis which lies at +120°. These axes are summarized in Figure 7.3. A further electrode is placed on the right leg. This is not used directly for recording but serves as a neutral reference for the other leads. The augmented limb leads are produced by combining pairs of electrodes to produce ‘virtual’ electrodes which do not have direct physical existence. Thus, for example, by electronically combining the right arm and left arm electrodes we get a virtual electrode which appears to lie within the centre of the upper chest (Fig. 7.4). This virtual electrode can then be linked with the electrode on the left leg to give a new lead (aVF) with a new (vertical) axis. The complete set of augmented limb leads is produced by combining groups of three limb electrodes as shown in Table 7.1. Table 7.1 A complete set of augmented limb leads produced by combining groups of three limb electrodes The geometry of the augmented leads is shown in Figure 7.5. The result is a new series of axes which complement the three basic limb leads. It is now possible to identify leads which come in pairs at right angles (orthogonal) to each other: lead I and aVF, lead II and aVL, lead III and aVR. This is of practical value in simplifying the analysis of the ECG (see later in this chapter). The limb leads provide information about the depolarization wavefront in a coronal (vertical) plane. The chest leads give us information about the wavefront in a skewed transverse plane which approximates to the base–apex axis of the heart. The surface electrodes are applied as shown in Figure 7.6 A and as described below. Fig. 7.6 Chest leads. (A) Position on chest. (B) Orientation in transverse plane. Adapted from Hampton 2003. V1: 4th intercostal space right sternal edge V2: 4th intercostal space left sternal edge V3: directly halfway between V2 and V4 V4: 5th left intercostal space mid-clavicular line V5: anterior axillary line directly lateral to V4 The limb leads are ‘combined’ electronically to create a virtual electrode over the spine. Thus leads V1 to V6 record the movement of the depolarization wavefront from the virtual electrode out in the direction of each of the chest electrodes as shown in Figure 7.6B. We now have a total of 12 leads (I, II, III, aVR, aVL, aVF and V1–6) derived from 10 electrodes. This is the standard ECG printout, an example of which is shown in Figure 7.7. Though more leads and different arrangements of presentation are possible this is the commonest form in which the ECG is presented. Note, the ‘V’ leads as described here may sometimes be shown as ‘C’ leads on a printout (see Figure 7.7). A schematic ECG waveform recorded in lead II is shown in Figure 7.8. The standard nomenclature, P, QRS, T and U waves is arcane. Originally waveforms were labelled A, B, C and D. As the equipment developed the waveforms changed shape and needed new labels. It was decided to use the second half of the alphabet starting at O for the starting point of the recording. The next features were labelled P, Q, R, S and T respectively. The flat line which precedes the P wave is equivalent to ‘O’ but this labelling is not used. There is a variable gap between the end of the P wave and the start of the QRS complex, the P–R interval. This interval represents the time taken for the atrial depolarization to reach the ventricular myocardium (see Chapter 2). It is a period of apparent inactivity but it in fact mainly represents the time needed for depolarization of the atrioventricular node (AV node) and the bundle of His. Since only a small amount of cardiac tissue is involved and this is surrounded by other, inactive, ventricular myocardium it does not produce a measurable deflection. However this region is extremely important as many clinically significant pathologies, such as heart block, have their origins in this region of the heart and cause characteristic changes in this part of the ECG. The QRS complex reflects the stages of mass ventricular depolarization. The initial deflection is produced by the posterior–anterior depolarization of the interventricular septum. In the normal heart the next stage is the depolarization of the bulk of the left ventricular apex and free wall. The final portion of the QRS complex is produced by the depolarization of the right ventricular free wall. The width of the QRS complex reflects the rate at which the wave of depolarization travels through the ventricles. This is largely determined by the Purkinje fibres of the specialized conducting system (see Chapter 2) which act as rapid distributors of the wave of depolarization through the myocardium. A further ‘quiet’ phase occurs: the ST segment. This phase represents the period when all of the ventricular muscle has been depolarized and myocardial contraction occurs. Myocardial contraction is not complete until the end of the T wave which represents the phase of ventricular repolarization.
THE ELECTROCARDIOGRAM (ECG)
Introduction
Producing a 12-lead ECG
Augmented limb leads (aVR, aVL, aVF)
Augmented limb lead
+ve electrode
−ve electrode
aVR
Right arm
Left arm + Left leg
aVL
Left arm
Right arm + Left leg
aVF
Left leg
Right arm + Left arm
Chest leads
12 lead ECG
The components of the ECG trace
THE ELECTROCARDIOGRAM (ECG)