5
The ECG in Patients with Chest Pain
The ECG in the presence of chest pain
The ECG in patients with myocardial ischaemia
ECG changes in ST segment elevation myocardial infarction (STEMI)
ECG changes in non-ST segment elevation myocardial infarction (NSTEMI)
Ischaemia without myocardial infarction
The ECG in other causes of chest pain
Aortic stenosis and aortic dissection
ECG pitfalls in the diagnosis of chest pain
Acute chest pain suggesting myocardial infarction
Other investigations for patients with acute chest pain
The investigation of chronic chest pain
HISTORY AND EXAMINATION
There are many causes of chest pain. All the non-cardiac conditions can mimic a myocardial infarction, and so the ECG can be extremely useful when making a diagnosis. However, the ECG is less important than the history and (to a lesser extent) the physical examination, because the ECG can be normal in the first few hours of a myocardial infarction.
Some causes of chest pain are listed in Box 5.1.
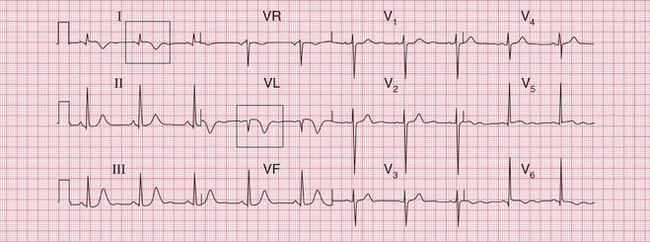
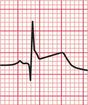
The ECG in Figure 5.1 was recorded in an A & E department from a 44-year-old man with rather vague chest pain. He was thought to have a viral illness and his ECG was considered to be within normal limits. He was allowed home, and died later that day. The post-mortem examination showed a myocardial infarction which was probably a few hours old, and corresponded with his A & E attendance.
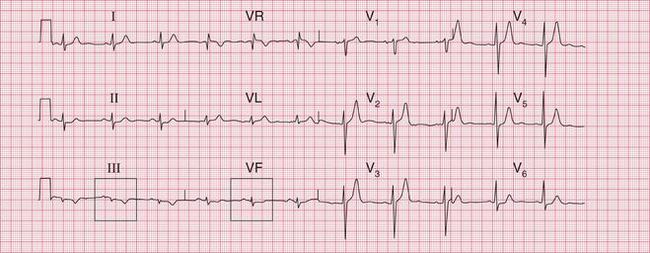


Fig. 5.1 Nonspecific ST segment/T wave changes
Note
• ST segments probably normal, though possibly depressed in leads III and VF
• T wave inverted in lead III (possibly a normal variant) and flattened in VF
ACUTE CHEST PAIN
The features of acute chest pain associated with different causes are summarized in Box 5.2.
• Left ventricular failure suggests myocardial infarction.
• A raised jugular venous pressure suggests myocardial infarction or pulmonary embolus.
• A pleural friction rub suggests pulmonary embolism or infection.
• A pericardial friction rub suggests pericarditis (Pviral, Psecondary to myocardial infarction) or aortic dissection.
• Aortic regurgitation suggests aortic dissection.
• Unequal pulses or blood pressure in the arms suggests aortic dissection.
CHRONIC CHEST PAIN
The main differential diagnosis of chronic chest pain is between angina and the chest pain that is common in middle-aged men, but for which no clear diagnosis is usually made. This pain is sometimes called ‘atypical chest pain’, but this is a dangerous diagnostic label because it implies that there is a diagnosis (by implication, cardiac ischaemia) but that the symptoms are ‘atypical’. Some of these pains are musculoskeletal, Tietze’s syndrome of pain from the costochondral junctions being the most obvious, but in most cases the best diagnostic label is ‘chest pain of unknown cause’. This indicates a possible need for later re-evaluation.
The important features in the history that point to a diagnosis of angina are that the pain:
• usually occurs after a constant amount of exercise
• is worse in cold or windy weather
• is induced by emotional stress
• is induced by sexual intercourse
• is relieved by rest, and rapidly relieved by a short-acting nitrate.
The physical signs to look for are:
• evidence of risk factors (high blood pressure, cholesterol deposits, signs of smoking)
• any signs of cardiac disease (aortic stenosis, an enlarged heart, signs of heart failure)
• anaemia (which will exacerbate myocardial ischaemia)
• signs of peripheral vascular disease (which would suggest that coronary disease is also present).
THE ECG IN THE PRESENCE OF CHEST PAIN
Remember that the ECG can be normal in the early stages of a myocardial infarction. Having said that:
• An abnormal ECG is usually necessary to make a diagnosis of myocardial infarction before treatment is started.
• An ECG will demonstrate ischaemia in patients with angina provided that the patient has pain at the time the ECG is recorded.
• With pulmonary embolism there may be classical ECG changes, but these are often not present.
• With pericarditis, ECG changes, if present at all, are very nonspecific.
THE ECG IN PATIENTS WITH MYOCARDIAL ISCHAEMIA
Myocardial infarction is, properly, a term describing myocardial cell death due to ischaemia. The histological changes – and ECG changes – can take several hours to appear, and the entire process leading to a healed infarction can take 5 or 6 weeks. Myocardial injury causes release into the blood of biomarkers such as troponin T or I and the MB fraction of creatine kinase, CK-MB. Therefore the release of these biomarkers can reflect the necrosis of myocardial cells, but it also occurs in situations other than coronary artery occlusion ( Box 5.3). Thus, although a rise in the blood levels of biomarkers supports the diagnosis of myocardial infarction it is not sufficient, and the most commonly used parts of the ‘universal definition’ of myocardial infarction, require both clinical evidence of myocardial ischaemia and a rise and/or fall of blood troponin levels. Box 5.4 shows the types of infarction listed in the universal definition, drawn up by the ESC/ACCF/AHA/WHF Task Force (Jaffe, A.S., Simoons, M.L., Chaitman, B.R. and White, H.D., on behalf of the Joint ESC/ACCF/AHA/WHF Task Force for the Universal Definition of Myocardial Infarction. European Heart Journal (2012) 33, 2551–2567). Box 5.5 lists the diagnostic criteria for each type of infarction.
• chest pain with ischaemic ST segment depression but no troponin rise (what used to be called ‘unstable angina’)
• chest pain with a troponin rise and T wave inversion or ST segment depression (non-ST segment elevation myocardial infarction, NSTEMI)
• chest pain with a troponin rise and ST segment elevation (ST segment elevation myocardial infarction, STEMI)
ECG CHANGES IN ST SEGMENT ELEVATION MYOCARDIAL INFARCTION (STEMI)
The sequence of features characteristic of STEMI is:
INFERIOR INFARCTION
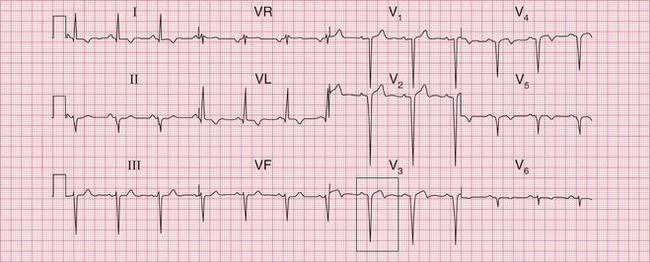
Figures 5.2, 5.3 and 5.4 show traces taken from a patient with a typical history of myocardial infarction: on admission to hospital, 3 h later, and 2 days later. The main changes are in the inferior leads: II, III and VF. Here the ST segments are initially raised, but then Q waves appear and the T waves become inverted. Figure 5.2 includes coronary angiograms showing the effects of an occluded right coronary artery in an inferior STEMI.
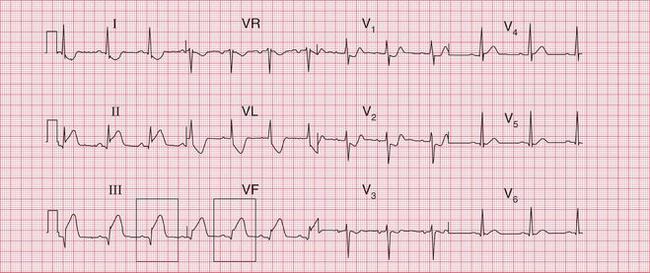
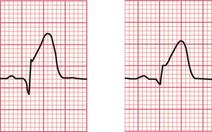
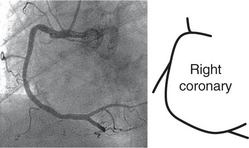
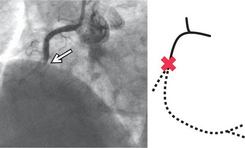
Fig. 5.2 Acute inferior infarction
Note
• Small Q waves in leads II–III, VF
• Raised ST segments in leads II–III, VF
• Depressed ST segments in leads I, VL, V2–V3
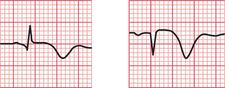
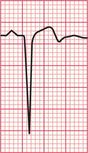
Raised ST segments in leads III and VF
Angiogram showing normal right coronary artery Angiogram showing occluded right coronary artery in inferior STEMI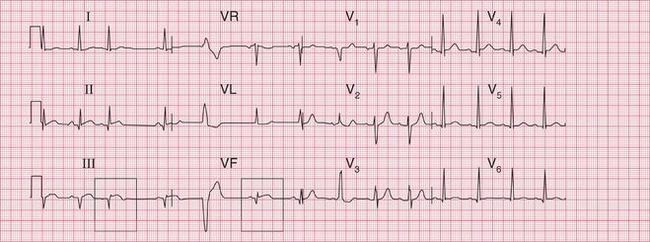
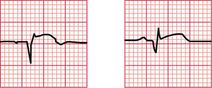
Fig. 5.3 Evolving inferior infarction
Note
• Same patient as in Figures 5.2 and 5.4
• Sinus rhythm with ventricular extrasystoles
• Deeper Q waves in leads II–III, VF
• ST segments returning to normal, but still elevated in inferior leads
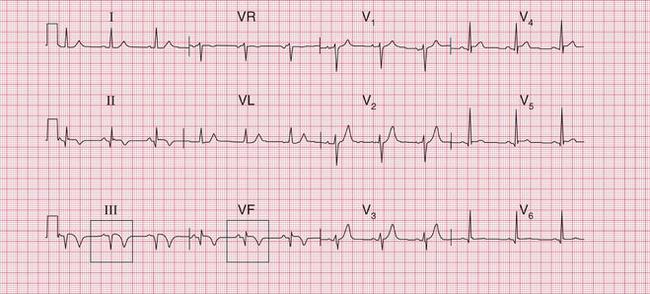
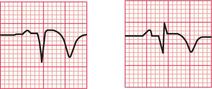
Fig. 5.4 Evolving inferior infarction
Note
• Same patient as in Figures 5.2 and 5.3
• ST segments nearly back to normal
• T wave inversion in leads II–III, VF
• Lateral ischaemia has cleared (as shown by ST segments in lateral leads)
Q waves, normal ST segments, and inverted T waves in leads III and VF
ANTERIOR AND LATERAL INFARCTION
The changes of anterior infarction are seen in leads V2-V5. Lead V1 which lies over the right ventricle, is seldom affected (see Fig. 5.5, which includes corresponding coronary angiograms).
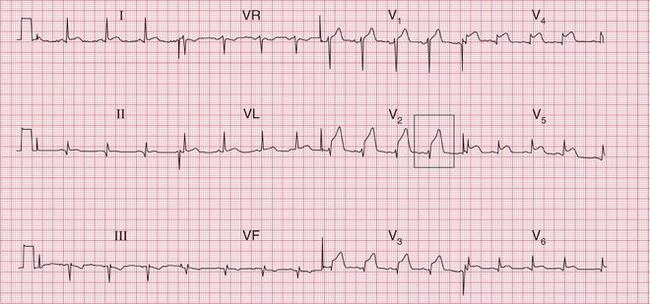
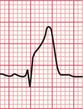
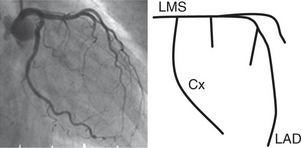
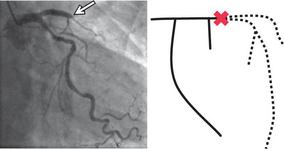
Fig. 5.5 Anterior infarction
Note
Angiogram showing normal left coronary artery:
LMS – left main stem coronary artery
Cx – circumflex branch
LAD – left anterior descending branch Angiogram showing occluded left anterior descending branch in anterior STEMI
When the lateral wall of the left ventricle is damaged by occlusion of the left circumflex coronary artery, leads I, VL and V6 will show infarction changes. Figure 5.6 shows the record of a patient with an acute lateral STEMI, with the corresponding coronary angiograms. Figure 5.7 shows a record taken 3 days after a lateral infarction, with Q waves and inverted T waves in leads I, VL and V6.
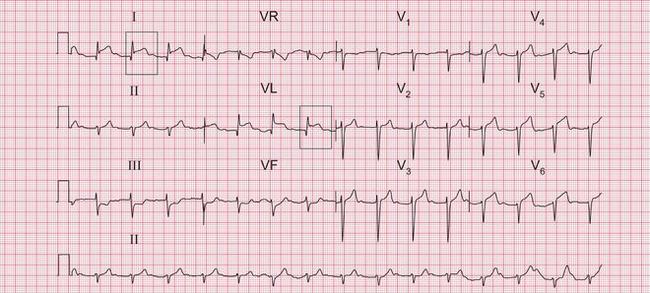
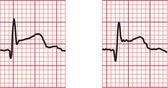
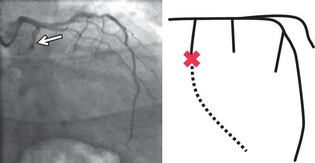
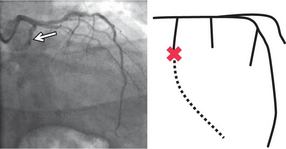
Fig. 5.6 Acute lateral infarction
Note
Raised ST segments in leads I and VL
Angiogram showing normal left coronary artery:
LMS – left main stem coronary artery
CX – circumflex branch
LAD – left anterior descending branch Angiogram showing occluded left circumflex branch in lateral STEMI
The ECG in Figure 5.8 shows an acute STEMI affecting both the anerior and lateral parts of the left ventricle.
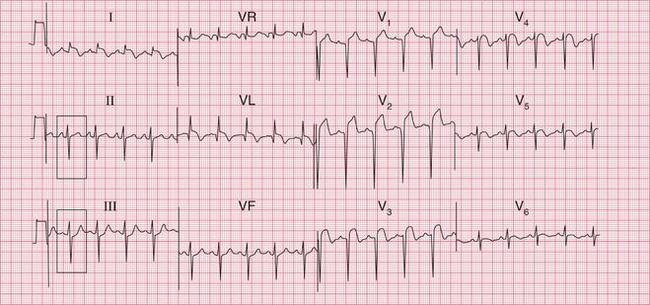
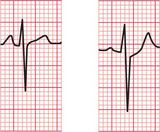
Fig. 5.8 Acute anterolateral infarction with left axis deviation
Note
The ECG in Figure 5.9 was recorded several weeks after an anterolateral myocardial infarction. Although the changes in leads I and VL appear ‘old’, having an isoelectric ST segment, there is still ST segment elevation in leads V3-V5. If the patient had just been admitted to hospital with chest pain these changes would be taken to indicate an acute infarction, but this patient had had pain more than a month previously. Persistent ST segment elevation is quite common after an anterior infarction: it sometimes indicates the development of a left ventricular aneurysm, but it is not reliable evidence of this.
An old anterior infarction often causes only what is called ‘poor R wave progression’. Figure 5.10 shows the record from a patient who had had an anterior infarction some years previously. A normal ECG would show a progressive increase in the size of the R wave from lead V1 to V5 or V6. In this case the R wave remains very small in leads V3 and V4, but becomes normal-sized in V5. This loss of ‘progression’ indicates the old infarction.
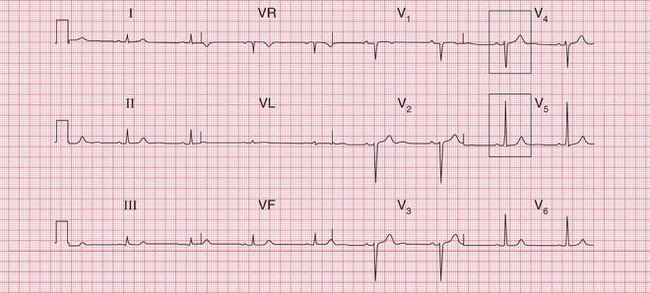
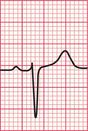
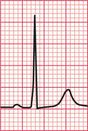
Fig. 5.10 Old anterior infarction
Note
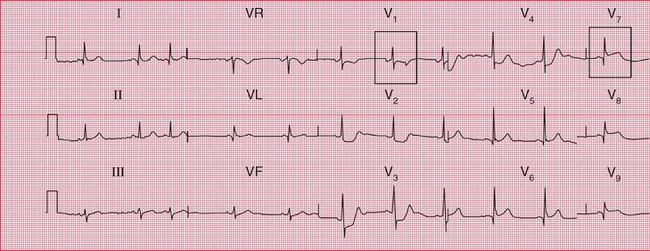
POSTERIOR INFARCTION
It is possible to ‘look at’ the back of the heart by placing the V lead on the back of the left side of the chest, but this is not done routinely because it is inconvenient and the complexes recorded are often small.
Figure 5.11 shows the first record from a patient with acute chest pain. There is a dominant R wave in lead V1 and ischaemic ST segment depression (see p. 231) in leads V2-V4. The chest electrodes were then moved to the V7-V9 positions: all in the same horizontal plane as V5, with V7 on the posterior axillary line, V9 at the edge of the spine, and V8 halfway between, on the midscapular line. The ECG record then showed raised ST segments, with Q waves typical of an acute infarction.
RIGHT VENTRICULAR INFARCTION
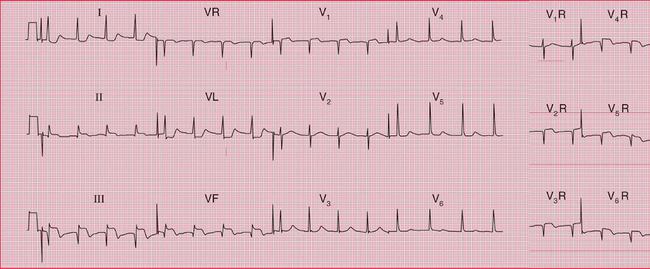
Inferior infarction is sometimes associated with infarction of the right ventricle. Clinically, this is suspected in a patient with an inferior infarction when the lungs are clear but the jugular venous pressure is elevated. The ECG will show raised ST segments in leads recorded from the right side of the heart. The positions of the leads correspond to those on the left side as follows: V1R is in the normal V2 position; V2R is in the normal Vi position; V3R etc. are on the right side, in positions corresponding to V3 etc. on the left side. Figure 5.12 is from a patient with an acute right ventricular infarct.
MULTIPLE INFARCTIONS
Infarction of more than one part of the left ventricle causes changes in several different ECG territories. This usually implies disease in more than one of the main coronary arteries. The ECG in Figure 5.13 shows an acute inferior myocardial infarction and marked anterior ST segment depression. Later, coronary angiography showed that this patient had a significant stenosis of the left main coronary artery.
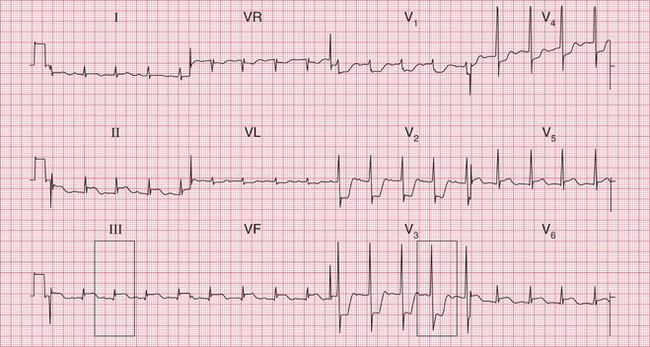
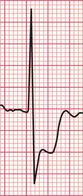
Fig. 5.13 Acute inferior infarction and anterior ischaemia
Note
Fig. 5.14 is the record from a patient with an acute inferior myocardial infarction. Poor R wave progression in leads V2-V4 indicates an old anterior infarction as well.
Figure 5.15 is an ECG showing an acute inferior STEMI and anterior T wave inversion due to an NSTEMI of uncertain age.
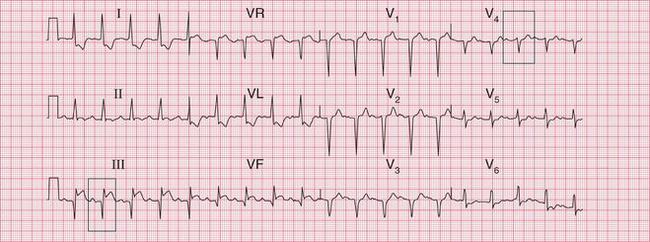
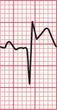
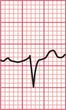
Fig. 5.14 Acute inferior and old anterior infarctions
Note
< div class='tao-gold-member'>
Stay updated, free articles. Join our Telegram channel

Full access? Get Clinical Tree


