The Comprehensive Transthoracic Echocardiographic Examination
Pei-Hsiu Huang
Getting Started
A quality echocardiogram study starts with the setup (Fig. 2-1).
Patient Positioning
The low-powered ultrasound beam cannot image the entire heart clearly in its natural position behind the sternum.
Helpful Tips:
Use the left lateral decubitus position to shift the heart laterally.
Place a wedge or pillow to support the patient on their left side.
Raise the left arm above the head to spread the intercostal spaces.
Patient comfort is key!
Sonographer Positioning
Get comfortable to prevent frequent breaks or a hastily performed examination. The examination can be performed from either side of the patient.
Helpful Tips:
The examination table height should allow the sonographer’s elbow to rest comfortably with a slight arm bend.
Position the patient so the examination can be performed without leaning.
Handling the Transducer
Helpful Tips:
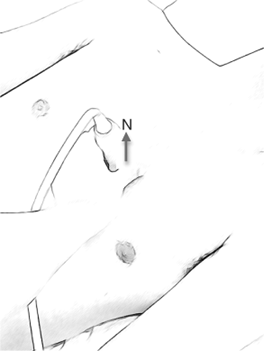
The transducer should rest between thumb and index and middle fingers (much like throwing a dart).
Move the fingers to the tip of the transducer.
Stabilize the transducer against the patient’s chest using the little finger.
Note the position of the transducer notch (N) to orientate the cardiac views.
Machine Setup
Move the machine beyond the head of the bed allowing space to sit at the level of the patient’s chest. Make sure to record the following information for each examination:
| Full name | |
| Patient identification | Date of birth |
| Identification number | |
| Vitals | Height/weight (used for indexing measurements) |
| Blood pressure (evaluating hemodynamic significance) |
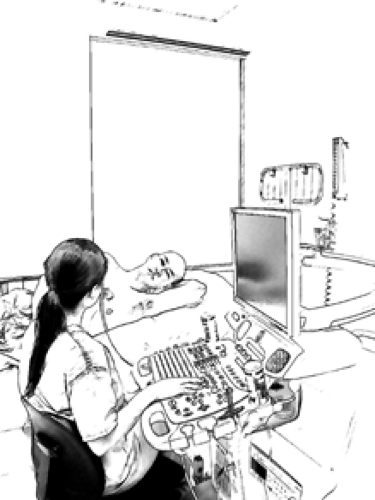 Figure 2-1. Echocardiogram setup. |
Additional Imaging Considerations
| Acoustic Windows The optimal acoustic window allows acquisition of bright and clear images. Poor image quality will affect the accuracy of 2D measurements and Doppler quality. |
|
| Respiration Heart position changes with respiration. |
|
| Transducer Pressure Firm pressure is necessary for good transducer contact. However, applying too much pressure, especially on pain sensitive bony surfaces, will cause the patient pain! |
|
| Ultrasound Gel A medium used to conduct sound waves between the patient and the ultrasound transducer |
|
Adjusting the Image
2D Gain
The intracardiac blood pool should be as dark as possible without losing definition of the cardiac structures (Fig. 2-2).
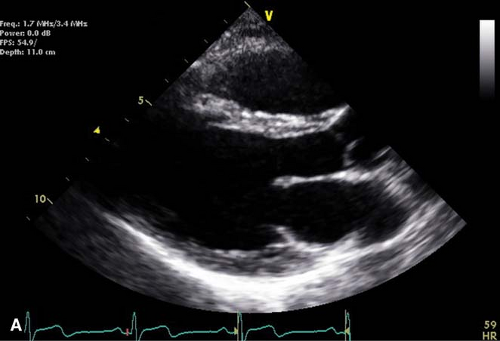 Figure 2-2A. Optimum gain. |
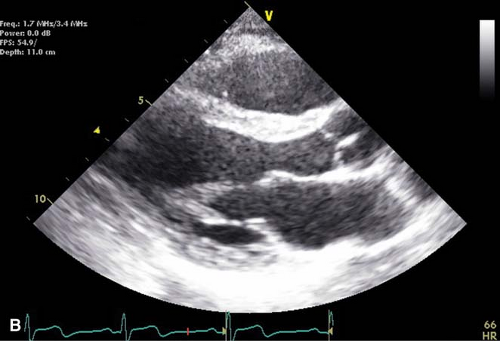 Figure 2-2B. Over-gained. |
Image Depth
The depth should be set to extend approximately 1 to 2 cm beyond the cardiac boundary most distant from the transducer to ensure that none of the structures are cut off (Fig. 2-3).
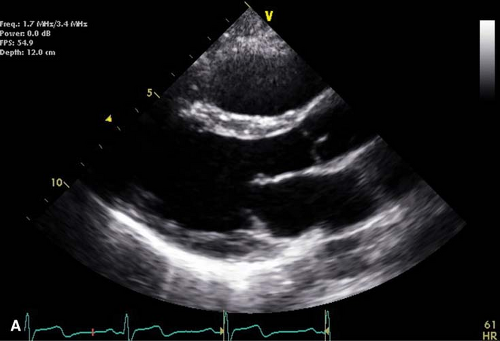 Figure 2-3A. Optimum depth. |
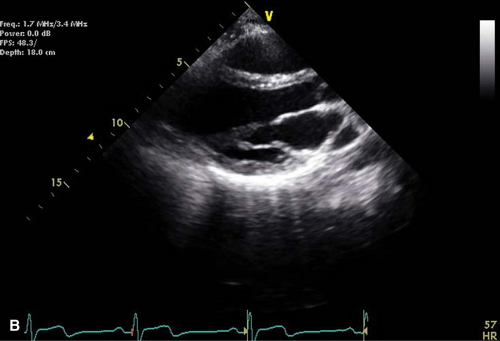 Figure 2-3B. Too deep. |
Note: Some laboratories use standard default depths to facilitate comparison of serial examinations. In this case, acquire images at the default depth as well as at the appropriate depth.
Color Doppler
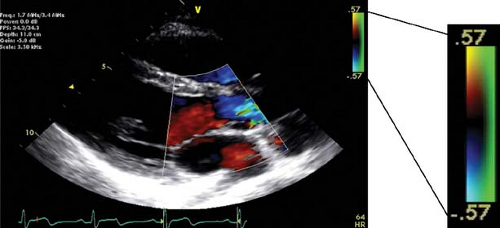 Figure 2-4. Color Doppler sampling region with Nyquist limit (inset). |
Adjust the color Doppler sampling region to include only the structures of interest in order to avoid decreases in temporal resolution and color quality. Keep the default Nyquist limit at 50–60 cm/s (Fig. 2-4).
Color Gain
This can be calibrated by moving the color box into the extracardiac space and increasing Doppler gain until there is visible noise. Slowly decrease gain until the noise first disappears.
Frequency
Start imaging with the transducer set at 1.7/3.4 MHz (transmitted/received; second harmonic imaging) (Fig. 2-5). Select a higher (for near-field imaging) or lower (for deeper penetration) frequency to optimize the image quality.
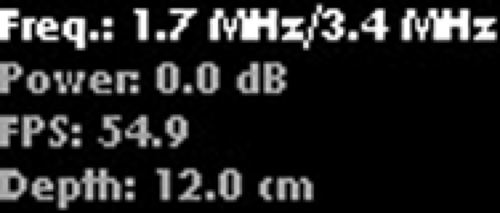 Figure 2-5. Transducer setting. |
Focus
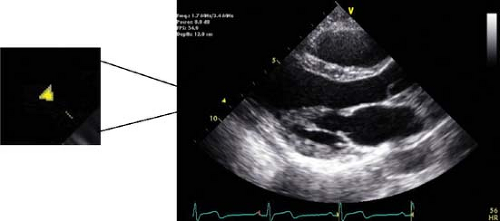 Figure 2-6. The focus of the ultrasound beam is shown by the arrow (inset). |
Try adjusting the ultrasound focus if an unclear image or artifact is encountered (Fig. 2-6).
Pulsed-wave Doppler Sample Volume Sizes
An inappropriate sample size may contaminate the Doppler acquisition and nullify spectral Doppler’s greatest advantage of range specificity.
Spectral Gain
The background should be dark and the signal bright to ensure it is not under-gained. Over-gained images may result in over-estimation of blood flow velocities. Measurements should be taken of the modal velocities (bright envelope) and not the spectral broadening (“feathery spray”) especially seen in over-gained or poor quality Doppler (Fig. 2-7).
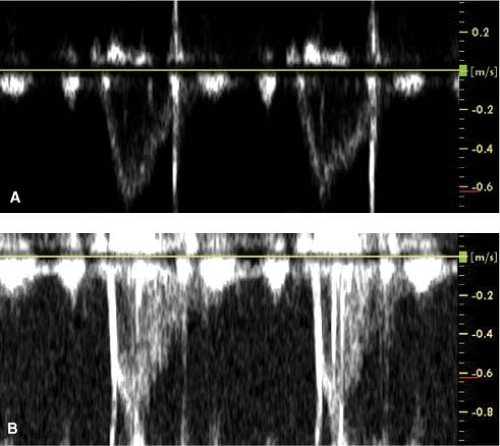 Figure 2-7. (A) Pulsed-wave Doppler with appropriate gain and (B) over-gained. |
Sweep Speed
Generally set at 50 mm/s for M-mode and spectral Doppler with normal heart rates. Set the sweep speed at 100 mm/s to get measurements at a high temporal resolution (Fig. 2-8).
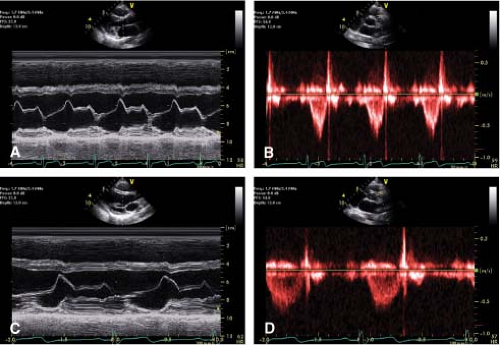 Figure 2-8. PLAX view with M-mode through the mitral valve leaflets and PSAX view with spectral Doppler of the RVOT with sweep speed at 50 mm/s (A, B) and 100 mm/s (C, D). |
The Views
Parasternal Long Axis (PLAX)
See Figure 2-9.
 |
Obtaining the Image:
At the third or fourth intercostal space, point the notch toward the patient’s right shoulder.
Keep the transducer close to but not on the sternum.
Move the transducer superiorly (High PLAX) to measure aortic root dimensions.
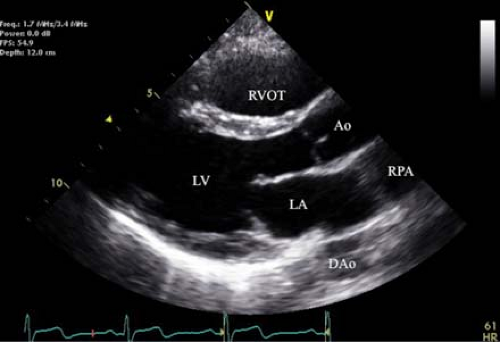 Figure 2-9. Parasternal long-axis (PLAX) view. N, transducer notch. |
2D Examination
Structures
Chambers: LA, LV, LVOT, RVOT, Ao, DAo, RPA
Valves: MV, AoV
Key Features
Coaptation of the anterior and posterior MV leaflets.
Coaptation of the AoV leaflets. The right coronary cusp is closest to the RVOT with either the non or left cusp opposite it.
LV cavity is maximized (imaging between papillary muscles).
Doppler Examination
Color Doppler
MV and AoV: Color box should include the IVS, AoV, and MV
Especially useful in this view for identifying eccentric regurgitant jets, ventricular septal defects and assessing aortic regurgitation (AR) severity
M-mode Examination
Chambers
Mid-ventricle to include the antero-septum and inferolateral walls
Valves
MV and AoV structure and leaflet motion
Stay updated, free articles. Join our Telegram channel

Full access? Get Clinical Tree


