Variable
Criteria used
Elevated mean right atrial pressure/central venous pressure
Inferior vena cava dimension >2.1 cm and inferior vena cava inspiratory collapse < 50 %
Prominent diastolic flow in the superior vena cava, hepatic veins or jugular veins
Bulging of the atrial septum towards the left atrium
Systolic PA pressure
4 × (peak tricuspid valve regurgitation jet velocity)2 + estimated right atrial pressure
Diastolic PA pressure
4 × (end diastolic pulmonic valve jet velocity)2 + estimated right atrial pressure
4 × (tricuspid valve regurgitation jet velocity at the time of pulmonary valve opening)2 + right atrial pressure
Mean PA pressure
4 × (peak pulmonic valve regurgitation jet velocity)2 + estimated right atrial pressure
Mean tricuspid valve regurgitant pressure gradient + estimated right atrial pressure
0.61 × PA systolic pressure + 2 mmHg
Pulmonary vascular resistance

Measures of right ventricular function
Myocardial perfusion index (Tei index):
ICT+IRVsystolic ejection time
Tricuspid annular plane systolic excursion (TAPSE): longitudinal distance traveled of lateral tricuspid annulus in apical 4-chamber view towards apex during systole
Right ventricular fractional area change (RV-FAC):
end-diastolic area – end-systolic area × 100
end-diastolic area
Systolic Pulmonary Artery Pressure
Systolic pulmonary artery pressure (sPAP) is equal to RV systolic pressure in the absence of pulmonary valve stenosis or another cause of RV outflow tract or PA obstruction. RV systolic pressure, and therefore sPAP, can be estimated by addition of right atrial (RA) pressure (RAP) to the pressure gradient between the right chambers. The maximal systolic pressure gradient between the RV and RA can be estimated using the simplified modified Bernoulli equation:
 where v is peak tricuspid regurgitant flow velocity (Fig. 11.1). Although widely accepted as a screening test, this method is only moderately accurate. While initial reports of TTE estimates of sPAP as compared with RHC suggested a correlation coefficient >0.9, larger subsequent research studies and reviews of clinical TTEs have reported a less robust association, with r ~ 0.7. Mean difference between TTE and RHC ranges from 3 to 40 mmHg, and sPAP may be underestimated by at least 20 mmHg in >30 % of patients; overestimation also occurs [19–22]. Causes of sPAP underestimation by TTE include inaccurate estimation of RAP (see below) and incomplete tricuspid regurgitation envelopes or incorrect determination of peak velocity. The probe incident angle must be meticulously aligned with the tricuspid regurgitant jet to avoid underestimation. Respiratory variation adds additional (true) variability in sPAP. It is thus recommended that this velocity be measured in multiple views and the maximal velocity jet should be used for the calculation, especially when high sensitivity for PHT is the goal, such as when TTE is being used as a screening test. Fewer than 80 % of patients have a dependable TR envelope, however, and even patients with severe PHT may have little or no TR. Poor regurgitant signals can be enhanced with the use of contrast, either proprietary products or an agitated mix of air-blood-saline. In general, it is preferable to provide an accurate range of possible sPAP values based on expected variance rather than a single integer estimate that encourages unrealistic expectation of precision. An additional shortcoming of TTE for sPAP estimation is specific to patients with severe tricuspid regurgitation; since RAP increases during systole as the result of high volume TR, this technique may underestimate sPAP.
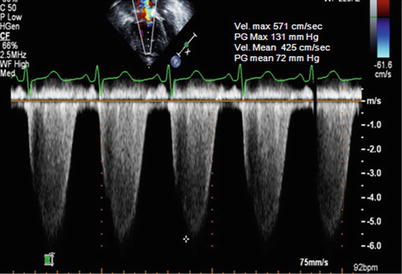


Fig. 11.1
Estimation of the systolic pulmonary arterial pressure (sPAP) using the simplified modified Bernoulli equation (ΔP = 4v 2 ). Shown is the spectral continuous-wave Doppler signal of the tricuspid regurgitation corresponding to the right ventricular–right atrial pressure gradient. sPAP can be estimated using the sum of the estimated right atrial pressure and the peak RV-RA pressure gradient. In this example, SPAP is estimated at 131 (= 4 × 5.712) + central venous pressure, or 146 mmHg, if RAP is estimated at 15 mmHg, indicating severe pulmonary hypertension. The mean pulmonary arterial pressure can be calculated in a similar fashion using the mean systolic gradient based on TR velocity: 72 mmHg + assumed RAP of 15 mmHg = 87 mmHg
Despite technical limitations and only moderate correlation with invasive measurements, this approach to sPAP estimation is clinically useful and remains by far the most commonly applied TTE variable to evaluate right heart hemodynamics. There is certainly a role for using this measure in screening for suspected PHT and or in patients at high risk for PHT, as long as there is a fundamental understanding of the limitations inherent to the technique [23]. It must be highlighted that TTE sPAP estimates cannot diagnose PHT and this approach should never be used as a rationale to treat patients with selective pulmonary vasodilator medications or to monitor the efficacy of that therapy.
Various cut-offs have been proposed to screen for PHT. European guidelines for the diagnosis and treatment of PHT propose that PHT is “likely” if tricuspid regurgitation jet velocity is >3.4 m/s (or estimated sPAP is >50 mmHg) and “possible” when the velocity is between 2.9 and 3.4 m/s (or estimated sPAP is 37–50 mmHg), with or without additional echocardiographic signs suggestive of PHT, or when the velocity is ≤2.8 m/s (or sPAP is ≤36 mmHg) with additional variables suggestive of PHT [9]. This last point cannot be overemphasized adequately. TTE evaluation of PHT should neither start nor finish with sPAP estimation. Other guideline documents are less specific, suggesting that in the absence of other potential etiologies of PHT (e.g., left heart disease or advanced lung disease), an estimated RV systolic pressure >40 mmHg generally warrants further evaluation in the patient with unexplained dyspnea [10, 11].
Systolic PAP (in the absence of RV outflow obstruction) equals the pressure difference (gradient) between RA and RV during systole as estimated above plus the RAP. In the absence of obstruction, central venous pressure (CVP), RAP and RV end diastolic pressure (EDP) are essentially the same, and can be estimated, albeit with modest accuracy, by measuring size, flow patterns and the respiratory variation of the inferior vena cava (IVC) [20]. With normal RAP, systolic flow predominates. As right heart filling pressure increases, this pattern is blunted and the relation between systolic and diastolic flows may equalize or even reverse. Negative intra-thoracic pressure, induced by a sniff or during normal respiration, causes flow from the abdominal IVC into the intrathoracic venous system causing “collapse” of the intrahepatic IVC. This collapse is blunted with elevated venous pressure, though it should be noted that without measurement of the shift in intrathoracic pressure the extent of expected collapse is difficult to predict. It has been proposed that IVC diameter <2.1 cm and collapse greater than 50 % on inspiration suggests normal RAP (0–5 mmHg). The presence of either greater diameter or lesser collapse (but not both) suggest mildly elevated RAP (~5–10 mmHg); diameter >2.1 cm with <50 % collapse suggests RAP > 10 mmHg [24]. The precision of the cut-offs belies the modest clinical accuracy of these estimates [25]. This constitutes an important source of error when estimating PA pressure, and it is reasonable to instead use the estimate of right atrial pressure based on jugular venous findings on physical examination. The IVC can be enlarged for other reasons, such as with positive pressure ventilation and in highly trained athletes. Additional TTE markers of elevated RAP include: presence of prominent diastolic flow in the superior vena cava, hepatic veins or jugular veins); bulging of the intraatrial septum towards the left atrium; dilation of the coronary sinus; pericardial effusion; and tricuspid E/e’ ratio >6 of the tricuspid inflow Doppler/ tricuspid annular tissue Doppler evaluation. Regardless of the method used for the evaluation of the RA pressure, jugular venous pressure estimates of experienced clinicians generally better estimate RA pressure than any TTE variable or combination of variables.
Mean Pulmonary Artery Pressure
Mean pulmonary arterial pressure (mPAP) can also be estimated with TTE. One advantage to estimating mPAP rather than sPAP is that PHT is defined based on mPAP. Possibly the simplest method of calculating the mean pulmonary arterial pressure (mPAP) is:
![$$ mPAP=0.61\times PA\; systolic\; pressure+2\; mmHg\kern0.24em \left[26\right]. $$](/wp-content/uploads/2016/10/A316577_1_En_11_Chapter_Equb.gif) For obvious reasons, this has little advantage to estimating sPAP and has the same limitations. While sPAP and mPAP are strongly correlated (r2 ~ 0.95) this relationship varies with high stroke volume, and may be problematic in patients with high pulmonary stroke volume those with severe anemia or intracardiac left-to-right shunt. Considering the limitations mentioned above of evaluation of the sPAP using the tricuspid regurgitation velocity jet, alternative methods have been developed in an aim to provide a more accurate assessment of the mPAP.
For obvious reasons, this has little advantage to estimating sPAP and has the same limitations. While sPAP and mPAP are strongly correlated (r2 ~ 0.95) this relationship varies with high stroke volume, and may be problematic in patients with high pulmonary stroke volume those with severe anemia or intracardiac left-to-right shunt. Considering the limitations mentioned above of evaluation of the sPAP using the tricuspid regurgitation velocity jet, alternative methods have been developed in an aim to provide a more accurate assessment of the mPAP.
![$$ mPAP=0.61\times PA\; systolic\; pressure+2\; mmHg\kern0.24em \left[26\right]. $$](/wp-content/uploads/2016/10/A316577_1_En_11_Chapter_Equb.gif)
Method 1: Use of the Pulmonary Valve Regurgitation Jet
The pulmonary regurgitation Doppler velocity pattern is characterized by a rapid rise immediately after the closure of the pulmonary valve and a gradual deceleration until the end of diastole. The pulmonary regurgitation velocity corresponds to the diastolic pressure gradient between the PA and RV through diastole (i.e., both the velocity and gradient decline). The peak pulmonary regurgitation velocity at the start of diastole reflects the pressure gradient between the PA and RV the start of diastole. Application of the modified simplified Bernoulli equation to peak pulmonary regurgitation velocity (Fig. 11.2) with the addition of estimated RAP provides a reasonable estimate of mPAP [27]. Pulmonary regurgitation envelopes are often incomplete or absent, however, precluding this approach in many patients. Further, since the mPAP is lower than the sPAP, an inaccurate RAP estimate has a proportionally greater impact on mPAP estimates. Thus, while this method can be useful qualitatively to confirm sPAP estimates or when the TR envelope is of poor quality, it is not generally as robust or as commonly used.
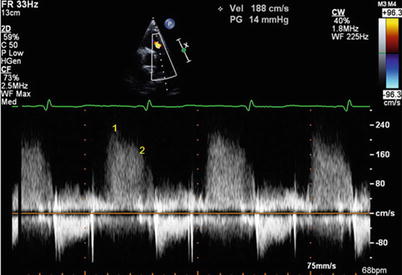

Fig. 11.2
Doppler echocardiographic estimation of mean pulmonary artery pressure (mPAP) and diastolic PA pressure by continuous-wave Doppler signal of pulmonary regurgitation. Point 1 marks the maximal pulmonary regurgitation velocity at the beginning of diastole. Mean PA pressure correlates with 4 * (early PR velocity)2 + estimated RAP, in this example 21 mmHg + RAP. Point 2 marks the diastolic PR velocity at the onset of atrial contraction. PA diastolic pressure is estimated by 4 *(end PR velocity ~ 1.6 m/s)2 + estimated RAP. In this example, PA diastolic pressure is ~10 mmHg + RAP. Note that the point selected in this case is actually not truly at end diastole but rather before the A wave. Depending on how RAP is estimated and the magnitude of the A wave pressure augmentation (which can be large in a patient with good atrial function and a stiff RV), there can be marked variation in the correct RAP estimate for this calculation. Also notable is the presence of respiratory variation
Method 2: RV-RA Mean Systolic Gradient
The mean RV-RA systolic gradient can be derived from the Doppler profile of the tricuspid regurgitation (Fig. 11.1). The sum of this estimate and estimated RAP correlates with RHC mPAP [28]. This method depends on the presence a pristine complete tricuspid regurgitation Doppler envelope; in that situation, it has the advantage of ‘averaging the error’ of measurement over systole compared with a quadratic function a single velocity.
Method 3: Calculation from the Systolic and the Diastolic Pressures
The third method consists of estimating the PA systolic and diastolic pressures (see below) and calculating mPAP value using a standard equation:
 Where dPAP denotes diastolic PA pressure.

Diastolic Pulmonary Artery Pressure
Two noninvasive echocardiographic methods can be utilized to evaluate the diastolic pulmonary artery pressure (dPAP): the first consists of evaluation of the end-diastolic PA-RV gradient and the second consists of assessment of the RV pressure at the time of pulmonary valve opening. Of course, these events are essentially simultaneous and both correspond to end diastole.
Method 1: Use of End-Diastolic PA-RV Gradient
The end diastolic PA-RV pressure gradient can be estimated by applying the modified simplified Bernoulli equation to the end-diastolic pulmonary regurgitation velocity (Fig. 11.2). Adding the RAP to this calculation estimates dPAP; in research settings this correlates well with invasive dPAP measurements in select patients [29, 30]. As with tricuspid regurgitation, inadequate pulmonary regurgitant Doppler signals can be enhanced with the use of contrast or air-blood-saline mixture. The limitations described for mPAP Method 1 estimation apply here as well.
Method 2: RV Pressure Assessment at the Time of the Pulmonary Valve Opening
RV end diastolic pressure equals PA pressure at the moment of pulmonary valve opening. Given that the gradient between the RV and RA can be estimated by the velocity of the tricuspid valve regurgitant jet, applying the simplified Bernoulli at the time of pulmonary valve opening and adding the RAP to this value allows an estimation of dPAP [31]. The tricuspid valve regurgitant velocity Doppler sign needs to be aligned with the time from the QRS complex to the onset of pulmonary flow on the regurgitation velocity envelope (Fig. 11.3). While this method requires more effort and practice to allow reproducible demarcation of timing, it does correlated reasonably well with invasively measured dPAP in the research setting [31, 32].
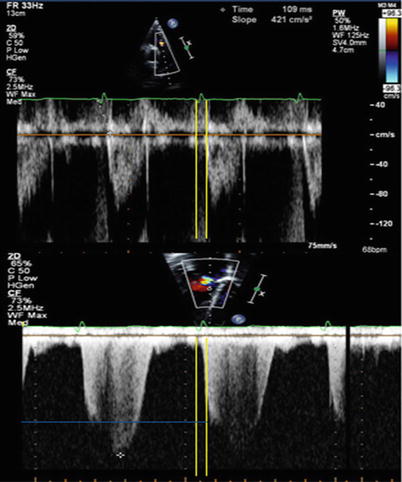

Fig. 11.3
Diastolic PA pressure may be estimated by the Doppler velocity of tricuspid regurgitation at the time of pulmonary valve opening. Transpulmonary flow (top) and tricuspid regurgitant flow (bottom). It is apparent that very small errors in measurement of timing (whether by measurement or changes in heart rate) may result in important error. Yellow lines: time between Q wave and pulmonary valve opening. Blue line: TR velocity at the time of pulmonary valve opening
Pulmonary Vascular Resistance
As will be further elaborated in the section discussing the invasive hemodynamic study, pulmonary vascular resistance (PVR) is a critical variable in understanding PHT physiology and appropriate management. PVR cannot be directly measured by TTE or RHC, and rather is estimated as a function of transpulmonary gradient and pulmonary blood flow.
Several methods have been proposed to estimate PVR with TTE. The first such technique consists of determining the ratio between the tricuspid regurgitation velocity and the velocity time integral of flow across the pulmonary annulus/RV outflow tract [33]. This ratio corresponds, with important exceptions, to the ratio of transpulmonary gradient to the cardiac output at the pulmonary bed used to estimate PVR by RHC. An equation was proposed to estimate PVR (in Wood units):
 In the initial report, TTFV to RVOT VTI ratio < 0.2 predicted PVR <2 WU with 70 % sensitivity and 94 % specificity [33]. In a study of patients with cirrhosis, a ratio > 0.12 had 100 % sensitivity and negative predictive value for the detection of PVR > 1.5 WU; all patients with ratios < 0.12 could safely proceed to liver transplantation without the need for invasive hemodynamic assessment to exclude portopulmonary hypertension [34]. This method has several notable limitations. First, it does not account for the quadratic relationship between TTFV and pressure, and therefore markedly underestimates high PVR. Second, TTFV estimates of PA pressure do not reflect transpulmonary gradient (mPAP-PAWP). The accuracy of this method and others like it is unclear in patients with very high PAWP. Finally, the ratio does not have an intuitive interpretation and the equation to estimate true PVR (multiplying by 10 and then adding a small constant) is also not intuitive.

A modification of this approach was developed empirically and involved a ratio of estimated PA pressure to velocity time integral of flow across the pulmonary valve [35]:
 Of note, there a constant of +3 is added if there is notching of the RVOT Doppler envelope (see below). This equation is slightly more accurate than the original approach and is easier to apply in clinical practice [36].

There are several other techniques listed below. While all are reasonable, they require additional calculation and are less useful in a busy clinical practice.
A third method consists of measuring the ratio between sPAP and velocity time integral at the RVOT corrected for heart rate [37]. Compared with the tricuspid regurgitation velocity and the velocity time integral index, this ratio takes into account RAP and heart rate. When evaluated in a population with PHT and high PVR versus invasive measurement of PVR, it was found that a cutoff value of 0.076 had 86 % sensitivity and 82 % specificity in determining indexed PVR > 15 resistance units.
A fourth technique consists of measuring the pre-ejection period (the time between the onset of tricuspid regurgitation and the onset of pulmonary systolic flow), the time interval between the onset of ejection and the time of peak flow velocity, or AcT), and total systolic time (the sum of the pre-ejection period and pulmonary ejection time) [38].
A final method is to estimate each component of PVR (mPAP, PAWP, pulmonary flow) using a set of different validated equations and then calculate PVR. This is appealing, and might be expected to provide more accurate estimates. Given the inaccuracy of TTE PAWP and pulmonary flow estimates, however, the resulting data are disappointing. Because of the labor involved and lack of incremental benefit, this method is of limited clinical relevance.
Ancillary Findings: Status of Right and Left Heart Chambers
Severe PHT causes RV and RA dilatation, RV dysfunction, abnormal ventricular septal motion, coronary sinus dilation and pericardial effusion [39]. Many of these findings are apparent only with severe disease, and may not reflect good variables for PHT screening; abnormal septal motion is an exception. Furthermore, right heart findings are not perfectly correlated to the severity of pulmonary vascular disease and are a function of multiple factors such as disease etiology, speed of disease progression, presence of tricuspid regurgitation, co-existing right coronary disease, other associated cardiac and vascular morbidities, and, presumably, genetic predisposition. Many of these findings may improve after initiation of pulmonary vasodilator therapy, and routine echocardiographic follow up is also indicated to monitor the effects of such treatment [9–11]. These data taken in conjunction with change in patient symptom burden and 6 min walk distance constitute the core variables used to assess adequacy of medical therapy for pulmonary arterial hypertension.
Right Atrial Dimensions
RA dimensions, including diameter and area, measured in the four chamber apical view should be measured. RA area >20 cm2 is considered abnormal and area >27 cm2 portends poor prognosis among patients with pulmonary arterial hypertension [40].
Right Ventricular Indexes
It is well recognized that the RV is more challenging to assess with TTE than the LV because of its heavier trabeculations, and complicated geometry with the presence of an infundibulum. The initial physiologic response of the RV to pressure overload often includes dilatation. The apical four chamber view provides the most comprehensive view of the ventricle, though no single view is adequate (Fig. 11.4). A dilated RV often assumes a more globular shape, compared to the usual triangular appearance in the apical view. The ratio between the diastolic inflow diameters and areas of the RV and the LV correlates with the degree of RV dilatation: an area ratio ranging from 0.6–1 typically indicates mild RV dilation, while severe RV dilation is associated with a ratio > 1 [41]. Despite various attempts to quantify RV size, however, this remains a notable weakness of TTE evaluation of PHT.
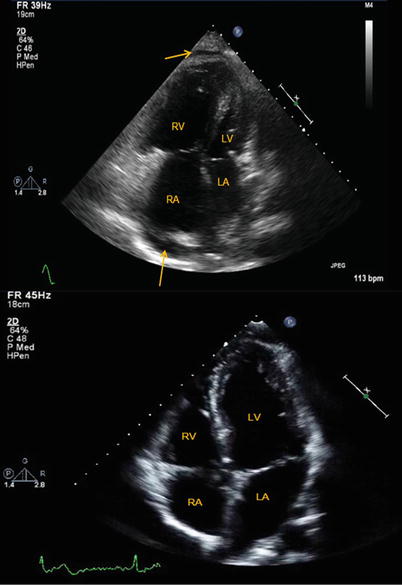

Fig. 11.4
Apical 4 chamber views of a normal size right ventricle and right atrium (top) and of a markedly enlarged right ventricle and right atrium in a patient with pulmonary arterial hypertension. Note the round shape assumed by the right ventricle in the bottom image as compared to the normal, crescent shape right ventricle in the top image. Also noted is the presence of a small pericardial effusion (arrows). RV right ventricle, RA right atrium, LV left ventricle, LA left atrium
Estimation of RV function may be accomplished via several methods. Percentage RV fractional area change (FAC), defined as [(end-diastolic area – end-systolic area)/end-diastolic area] × 100, is a measure of RV systolic function that has been shown to correlate with RV ejection fraction (EF) by magnetic resonance imaging (MRI) [42, 43]. RV FAC is an independent predictor of heart failure, sudden death, stroke, and/or mortality in patients after pulmonary embolism [44] and myocardial infarction [45, 46]. FAC is obtained by tracing the RV endocardium in systole and diastole from the annulus to the apex along the free wall (below the trabeculations), and then back to the annulus along the ventricular septum. The lower reference value for normal RV FAC is ~35 % [24]. Complex RV geometry, however, limits the accuracy of any 2D technique. 3 dimensional TTE is promising, but not yet widely available. Assessment of the RV myocardial performance index, also known as the Tei index, is an alternative, non-geometric approach. This index is defined as the ratio of the isovolumic contraction time plus isovolumic relaxation time to systolic ejection time [47]. With progressive ventricular dysfunction, ejection constitutes a shorter portion of this time period. In pediatric idiopathic PHT, RV performance index is closely related with invasive mPAP and that it can be used to monitor mPAP after initiation of medical therapy [48]. A smaller study conducted in patients with connective tissue disease demonstrated that a myocardial performance index >0.36 combined with sPAP ≥ 35 mmHg may improve TTE accuracy in predicting PHT. The Tei index has also been shown to have important prognostic implications: in a series of 53 PHT patients, an elevated Tei index was associated with an increased risk of clinical events and death [49]. One important caveat to use of this method in monitoring to response to therapy may be its relative independence to changes in afterload [50]. The Tei index is less commonly used in clinical practice, perhaps because of its lack of direct correspondence to any single physiologic parameter and unintuitive interpretation.
RV contraction has a predominantly longitudinal component (as opposed to torsion of the LV), and simply measuring the distance travelled by the tricuspid annulus during contraction provides a reasonable estimate of RV function [9]. This measurement is termed tricuspid annular plane systolic excursion (TAPSE) and is usually measured by M-mode echocardiography of the lateral tricuspid annulus (though it can be estimated from 2D images) (Fig. 11.5). Normal TAPSE is >1.6–1.7 cm (though most normal people have TAPSE > 2–2.2 cm) and is reduced with RV dysfunction [51]. Low TAPSE (<1.8 cm in one study) predicts increased risk of death in pulmonary arterial hypertension [52]. RV function also predicts outcome in patients with left heart failure. Important limitations to this method include its angle and load dependency, its focus on a single dimension of right ventricular motion and the fact that the tricuspid annular motion may be affected by overall heart motion [53].
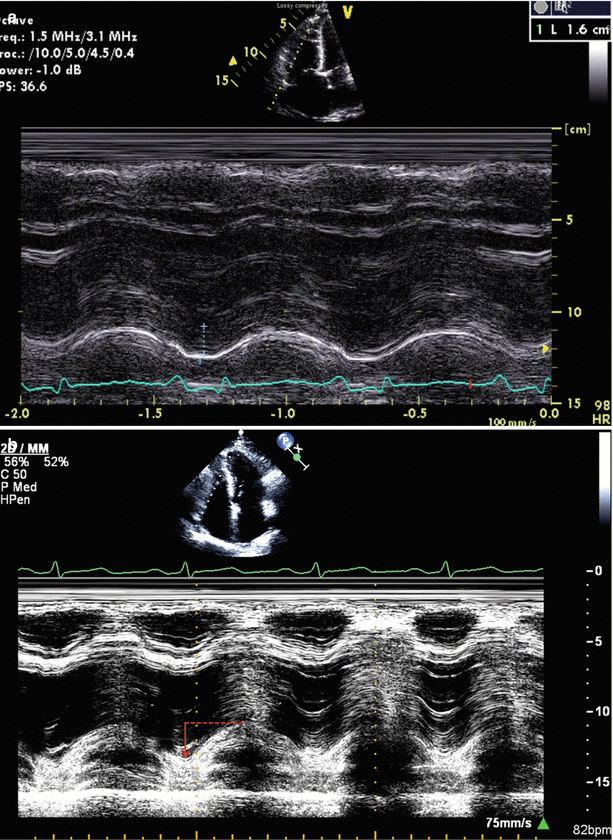

Fig. 11.5
(a, b) Measurement of the tricuspid annular plane systolic excursion (TAPSE) by M-mode echocardiography. (a) Low TAPSE is reduced in the setting of pulmonary arterial hypertension related to systemic sclerosis. (b) A patient with chronic thromboembolic pulmonary hypertension but preserved RV function (TAPSE ~ 2.4 cm). Increasing brightness and contrast on M-Mode images can help define TAPSE
Morphology of the Pulmonary Flow Velocity Curve
The “domelike” morphology (parabolic curve) of Doppler pulmonary flow velocity in individuals with normal pulmonary pressure and resistance assumes a more “triangular” shape skewed towards late systole in patients with PHT (Fig. 11.6). Peak velocity appears during early ejection compared with mid-ejection in normal people. In some cases there is flow deceleration in mid systole followed by a second late-ejection increase in velocity, resulting in the appearance of mid-systolic notching [54, 55]. The pulmonary flow acceleration time (defined as the time interval from the onset of forward flow in the pulmonary artery to the peak velocity) is inversely related to sPAP, mPAP and PVR [56, 57]. Both notching and short acceleration time correspond to true late ejection flow deceleration secondary to reflected pressure waves; therefore, they are present in patients with elevated PVR and non-compliant pulmonary arteries but not in patients with PHT due to left heart disease.
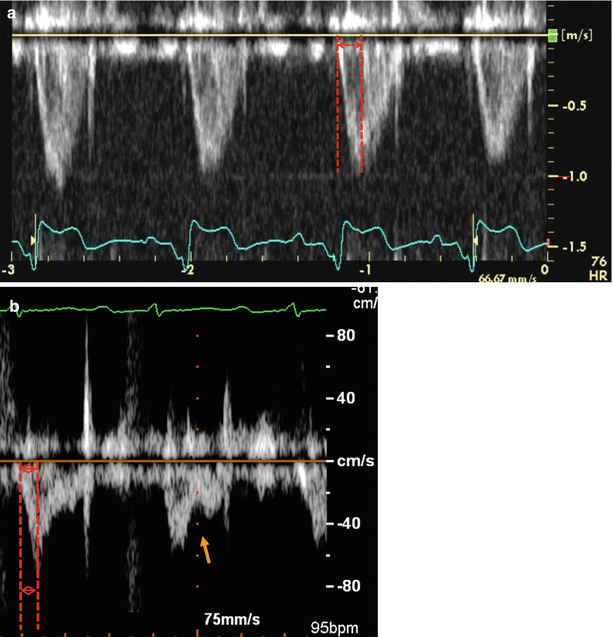

Fig. 11.6
The pattern of systolic (ejection) flow across the pulmonary valve in a patient without (a) and with (b) pulmonary arterial hypertension. Acceleration time, the time between onset of flow and peak velocity, is normal (>100 ms) in the top example and there is a normal parabolic flow envelope. Three distinctive features of pulmonary arterial hypertension with elevated pulmonary vascular resistance are depicted on the bottom image: a more triangular shape of systolic flow skewed towards the end of systole, notching of the systolic flow (orange arrow) and short acceleration time of <80 milliseconds (red lines)
Impact on the Left Heart and Cardiac Output
By altering RV size and geometry PHT may cause compression of the left heart chambers, resulting in impaired LV filling (preload limitation) and reduced cardiac output [39, 58, 59]. LV compression can be quantified using the eccentricity index, the ratio of anterior-inferior to septal-lateral short axis dimensions of the left ventricle, both in diastole and in systole [60]. Eccentricity index is assessed on the two-dimensional short-axis view of the LV (Fig. 11.7). Late systolic septal flattening (systolic eccentricity index >1) is a sensitive marker of elevated RV impedance, largely as the result of prolonged RV contraction [61]. The consequently abnormal LV filling can be assessed by the evaluating the Doppler appearance of the mitral inflow, with E < A velocities (Grade I “diastolic dysfunction”) [39]. Compression of the LV cavity with limited ventricular diastolic filling is associated with worse prognosis in patients with PHT [62].
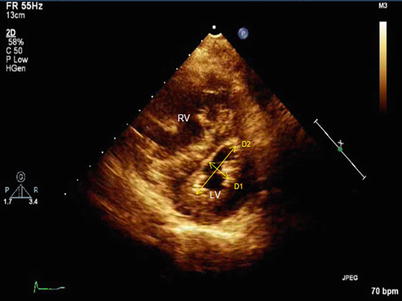

Fig. 11.7
Measurement of the eccentricity index. Normally, D2/D1 ratio approximates 1 throughout the cardiac cycle. In this example of a patient with pulmonary arterial hypertension, the ratio markedly >1 in this late systolic frame. Of note, less prominent end diastolic ventricular septal flattening is often present among patients with elevated PA impedance in the absence of any volume loading of the right ventricle. RV right ventricle, LV left ventricle
Additional Findings Associated with PHT
Coronary sinus dilation suggests elevated RAP in the absence of alternative explanation (e.g., left superior vena cava draining to the coronary sinus). The presence of a pericardial effusion (Fig. 11.4) has similar pathophysiology and has important prognostic implications [63]. Such pericardial effusions are rarely hemodynamically important in patients with severe pulmonary arterial hypertension; pericardiocentesis is contraindicated as it often has catastrophic consequences related to changes in RV geometry. This recommendation does not apply to patients with other forms of PHT or mild PAH with alternative causes for pericardial effusion. Right-to-left shunting through a patent foramen ovale can be present at rest or with exercise. This causes hypoxemia unresponsive to O2 supplementation. The diagnosis can be confirmed by intravenous injection of agitated saline or proprietary contrast material can make this diagnosis and may explain hypoxemia observed in a subset of patients with PHT.
Invasive Hemodynamic Assessment of PHT
Preparation of the Patient for Cardiac Catheterization
Patients are usually asked to fast for at least 4–6 h prior to catheterization, though this is not absolutely necessary if administration of sedative agents is not planned. A peripheral intravenous line should be placed if sedation will be administered or if the patient is considered to be at elevated risk for adverse events. Most chronic medications should be continued as prescribed, including pulmonary vasodilators. It is reasonable to hold a diuretic dose on the morning of a catheterization in stable patients. There is variability in the approach to oral anticoagulant use. While continuing anticoagulants is associated with increased bleeding risk, the absolute risk of serious bleeding from venous catheterization is low even with therapeutic anticoagulation. We generally continue warfarin without change in regimen, and proceed with RHC as long as INR is <3. The INR should not be supratherapeutic, however, as this increases risk with no benefit. The risk-benefit calculus will vary depending on the indication for anticoagulation. For example, uninterrupted anticoagulation is strongly merited in the presence of a mechanical mitral valve but is less important if the indication is primary prevention of stroke in the setting atrial fibrillation. The approach to newer anticoagulants must be similarly approached, though in general holding doses prior is reasonable for most patients, with the duration depending on the specific pharmacokinetics of the drug, and will undoubtedly evolve as more experience is accrued with these agents. The timing for discontinuation of dabigatran prior to the catheterization procedure varies by kidney function and bleeding risk; for patients with glomerular filtration rate > 60 ml/min and a low bleeding risk it is reasonable to hold the medication for 24 h prior to the procedure. This time frame is also recommended for patients at low bleeding risk treated with rivaroxaban and apixaban, regardless of their kidney function. Aspirin or other oral antiplatelet agents can usually be continued without interruption, though those on dual antiplatelet therapy are at increased risk for bleeding. Given a small risk for lactic acidosis, patients taking metformin and scheduled for an elective procedure during which intravenous iodinated contrast material may be administered should hold this medication the morning of the procedure and restart after renal function is confirmed to be stable for at least 48 h after the procedure if contrast is used [64]. Other considerations include allergies, especially to heparin or latex which may require use of different techniques and equipment.
We believe that conscious sedation (e.g., intravenous benzodiazepines or opiates) prior to or during the catheterization procedure should not be routine but rather should be considered on an individual basis. While providers vary in their use of sedation, in the absence of severe anxiety diagnostic RHC is usually tolerated without subjective distress. Conversely, although some prior studies have raised the concern that administrating systemic sedation to patients with PAH may be associated with adverse outcomes [65], the risk is likely small in hemodynamically stable patients unless liver or kidney function is impaired. An additional downside to sedation is that patients must be monitored for a more extended period after the procedure if sedation is administered; this is inconvenient for patients and requires additional resources. Another reason for avoiding systemic sedation is the potential effect on the patient’s hemodynamic profile during catheterization. There are two potential mechanisms: first, administration may result in systemic hypotension [66] leading to unrepresentative (low relative to the unsedated state) readings of certain variables, such as LV end diastolic pressure; second, benzodiazepines have a variable negative inotropic effect with resulting worsening RV function, an effect that has been shown in patients with pre-existing LV diastolic dysfunction [67]. These effects are usually not clinically apparent or relevant but the lack of benefit from routine sedation makes the potential for even minor or rare adverse effects unacceptable. Indirect effects via respiratory inhibition with subsequent hypercapnia can also affect hemodyanamic values.
If mechanical ventilation is clinically indicated, the potential associated hemodynamic effects must be considered. There is often an increase in RV afterload and decline in RV contractility, along with a number of other effects. With the use of positive end expiratory pressure (PEEP), positive intrathoracic pressure is variably transmitted to the central circulation, thus affecting right-sided pressures (especially during forced inspiration) [68–70]. The extent to which PEEP affects right-sided pressures is unpredictable and depends on various variables: baseline filling pressure, compliance of the chest wall, lung and of cardiac chamber compliance, and intravascular/cardiac volume status. There is no universal adjustment to account for the effect of PEEP on the PAWP, but PEEP < 10 cm H2O does not importantly affect PAWP [70]. For values above that, one suggested correction is that PAWP rises ~2–3 cm for every 5 cm H2O increment in PEEP [71]. To avoid unnecessary uncertainty, PEEP should be maintained as low as clinically reasonable.
A second alteration to be considered is an inaccurately elevated PAWP reading due to unexpected lung zone position of the catheter tip. In the upright position, lung zone 3 is located at the base of the lung, where alveolar pressure is lower than both pulmonary arterial and pulmonary venous pressure; position of the catheter tip in zone 3 allows pressure transmission directly from the left atrium to the wedged catheter tip. Under normal conditions, lung zone 3 is where the PAWP accurately reflects left atrial pressure [70]. With mechanical ventilation, the catheter tip is less likely to be located in zone 3, since alveolar pressure is increased and zone 3 accounts for a smaller portion of the lung. Use of PEEP and hypovolemia exacerbate this. Demonstrating that the catheter tip is below the level of the left atrium suggests zone 3 location [72]. Note that when the patient is supine, one cannot confirm position with AP imaging, since zone 3 is posterior to, not inferior/caudal to, the left atrium. It is reasonable to obtain hemodynamic measurements in various pulmonary segments, preferably in both the right and left lungs, to support the assertion that any single measurement is representative of underlying hemodynamics.
Percutaneous Access Sites and Catheter Choice
All roads lead to Rome and all systemic veins lead to the heart; therefore, any systemic vein could be used for venous access. Considerations as to optimal access sites include size of the vein, ease of vascular access, directness of course from access site to right heart, and requirements for monitoring after sheath removal.
The most common access sites used in catheterization for hemodynamic assessment of PHT are the femoral vein and the right internal jugular vein (IJ). The right IJ is preferred unless there is planned concomitant femoral arterial access or specific procedures (e.g., probing for PFO) are expected. Access via the left internal jugular vein or left subclavian vein does not provide as direct a catheter course, but is reasonable when right IJ access is not a good option (e,g., thrombosis). Proximal arm veins can also be used for venous access. This is commonly the favored approach when radial arterial access is used for a simultaneous left heart catheterization, but it limits catheter size and manipulation. Several groups have reported on their experience with the IJ access technique in large groups of patients; when performed by experienced personnel, IJ access is quick (<15 min) and associated with a very low complication rate (1–1.7 %); hemostasis can be rapidly achieved and patients (in the absence of sedation) can be discharged directly following the procedure in most cases [73, 74].To facilitate both cannulation success and speed, 2D ultrasound guidance may be used to locate the IJ and adjacent carotid artery. Ultrasound guidance is especially encouraged when technical difficulties are suspected (i.e. patients with short or thick neck) or when difficulties are encountered at the time of the procedure. Potential complications with IJ access are uncommon and include pulmonary hemorrhage, pneumothorax, carotid puncture, sinus bradycardia (vasovagal, usually transient and responsive to fluid; rarely requiring atropine administration) and complete heart block (especially in setting of pre-existing left bundle branch block). When considering catheter advancement to the pulmonary artery, one should keep in mind that IJ access will usually lead the catheter to the right PA, whereas femoral access will more commonly lead to catheter position in the left PA. When femoral venous catheterization is performed, patients are usually observed in the supine position for at least 2 h following removal of the sheath to ensure adequate venous hemostasis prior to ambulation. In the setting of active anticoagulation or a larger sheath, observation may be extended. Vascular closure devices, such as the Perclose ProGlide Suture-Mediated Closure System (Abbot Vascular, USA) can decrease bleeding time and access site complications. Sheath size is typically required to be 5 French or larger when using closure devices, and other contraindications should be checked with the manufacturer prior to usage. In the authors opinion, the internal jugular approach is preferable when no other interventions are planned, as it allows easier catheter manipulation through the right ventricular outflow tract and into the pulmonary arteries and, barring complications, the patient can be discharged home soon after sheath removal.
When deciding upon access site in a given patient, historical data regarding prior venous and arterial access and potential obstructions, compressions, complex anatomical courses and prior procedural complications should be obtained. Patients with kidney disease on hemodialysis, congenital heart disease, pacemakers, or indwelling chronic venous access for other reasons (e.g., intravenous prostanoids) are more likely to have had multiple prior procedures and vascular injury or thrombosis. Imaging of the vascular bed may be established by various modalities including ultrasound, computed tomography and magnetic resonance angiography.
The quality of hemodynamic data depends on an array of variables. First, the quality of tracings depends on the frequency response of the fluid filled catheter system. Frequency response is directly proportional to the size of the lumen and inversely related to length of tubing. Thus, optimal tracings are obtained with catheters with large lumens and minimal excess tubing.
Of note, the external diameter of the catheter is not always indicative of lumen size. A large catheter with multiple ports (e.g., 8 F catheter with RA, thermodilution and PA ports) will often have slower frequency response than a smaller single port catheter (e.g., 6 F single lumen catheter). Frequency response is generally <12 Hz [75]. Selection of catheter balances the risk associated with larger access sheath (albeit a very small risk), benefits of additional ports or technologies (e.g., ability to perform thermodilution cardiac output estimates) and quality of hemodynamic tracings.
Catheters with end holes are necessary to measure occlusion (wedge) pressures and for sampling pressures within small chambers or when discerning pressure gradients over short distances. While catheters with side holes are preferable to measure intra-cardiac pressures to prevent erroneous readings due to damping effect resulting from obstruction of the catheter tip by cardiac tissue this is a modest concern and issues are recognizable (blunted waveforms) and can be addressed with catheter repositioning. Generally only in the context of congenital heart disease are side-ports truly needed for this reason.
A “Swan-Ganz” catheter is commonly used for measuring right-heart pressures when thermodilution is considered for evaluation of the cardiac output (see below). In addition to the balloon at the tip for flotation, it consists of an end-hole port, a side-hole port 30 cm from the catheter tip, and a thermistor for measurement of cardiac output by the thermodilution method. Other balloon flotation catheters include: the Berman catheter, which includes multiple side-holes near the tip and no end hole or thermistor and is used mainly for angiography; catheters with an RV side port to allow a pacing via a temporary pacemaker wire; and the balloon-wedge catheter, which contains an end-hole similar to the Swan-Ganz catheter but no thermistor for cardiac output measurement or additional infusion or pressure monitoring ports [70].
Stay updated, free articles. Join our Telegram channel

Full access? Get Clinical Tree


