Arterial Blood Gases
Arterial blood gas analysis is performed to answer various clinical questions: Is gas exchange normal? Is there carbon dioxide retention in the patient with chronic obstructive pulmonary disease (COPD), severe asthma, or severe restrictive disease? Is there hypoxemia (low oxygen saturation)? Does the saturation decrease with exercise? What is the acid-base status?
Several important aspects need to be considered for obtaining and handling arterial blood specimens. The laboratory must always indicate on the report form whether the patient was breathing room air or an increased oxygen concentration. As stated in section 3B (page 29), the arterial oxygen tension may be lower in the supine position than the upright posture. Therefore, the posture of the patient should be noted. The patient should be neither hyperventilating nor holding his or her breath. The specimen should not contain any air bubbles, and it should be quickly iced and promptly analyzed. Similar precautions apply to analysis of the pH of pleural fluid when empyema is a possibility.
6A. ARTERIAL OXYGEN TENSION
There are four major steps in the transfer of oxygen from inhaled air to the tissues:
- Ventilation of the alveoli must be adequate.
- Within the lung, the inhaled air must come in contact with venous blood; that is, there must be adequate matching of ventilation (
 ) to perfusion (
 ).
).
- There must be diffusion of the oxygen through the alveolar wall into the hemoglobin in the red cells (see Chapter 4).
- Oxygenated hemoglobin must then be transported by the cardiovascular system to the tissues.
The first two steps are discussed in this chapter. Transport, or so-called internal respiration, deals with the oxygen content of blood, the cardiac output, and the distribution of blood flow to the organs, and this topic is outside the province of this book.
The tension of oxygen in the arterial blood (PaO2) reflects the adequacy of the transfer of oxygen from ambient air to blood. In normal young adults, the PaO2 values at sea level range from 85 to 100 mm Hg. The values decrease slightly with age, to about 80 mm Hg at age 70. Hypoxemia exists when the PaO2 is less than these values. The oxygen dissociation curve is useful in the consideration of hypoxemia. Figure 6-1 shows the average values for the oxygen tension of mixed venous blood (V ~ P O2 = 40 mm Hg, saturation 75%) and arterial blood (a ~ PaO2 = 100 mm Hg, saturation 96%). The curve is very steep at and below the venous point where small changes in oxygen tension produce dramatic change in the oxygen content of blood, and hence the saturation. Conversely, at oxygen tensions of more than 60 to 70 mm Hg, large changes in tension have a relatively small effect on saturation. Hence, very little additional oxygen can normally be added to the blood by using very high inspired oxygen tensions. Cyanosis is not easily appreciated until the saturation has decreased to less than 75%.
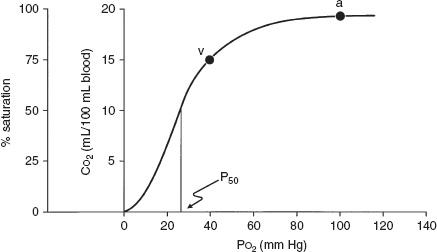
FIG. 6-1. Oxyhemoglobin dissociation curve for hemoglobin that plots oxygen saturation against the partial pressure of oxygen (PO2) and also the oxygen content (CO2). P50 is the partial pressure of oxygen that results in a 50% saturation of hemoglobin. a, arterial blood; v, mixed venous blood. (From AE Taylor, K Rehder, RE Hyatt, et al [eds]. Clinical Respiratory Physiology. Philadelphia: Saunders, 1989. Used with permission.)
The four common causes of hypoxemia occurring with a normal inspired oxygen tension and barometric pressure are hypoventilation, ventilation-perfusion ( /
/ ) mismatch, shunt, and impaired diffusion.
Hypoventilation
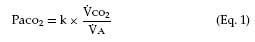
This term refers specifically to alveolar hypoventilation. There are two important, distinguishing features of alveolar hypoventilation. One feature is that arterial carbon dioxide tension (PaCO2) is always increased. The following simple equation defines the relationship between PaCO2 and alveolar ventilation ( A) and carbon dioxide production by the body (
 CO2) (“k” is a constant):
Assume  CO2 stays constant. When (
 A) decreases, PaCO2 must increase. Similarly, an increase in
  CO2 can increase PaCO2, unless alveolar ventilation increases proportionately.
A way to think of alveolar ventilation is as follows. When a subject inhales a tidal volume breath (designated VT), a certain amount of that breath does not reach the gas-exchanging alveoli. A portion stays in the upper airway, trachea, and bronchi, and a portion may go to alveoli with no perfusion (especially in disease), so that gas exchange does not occur in either case. This fraction of the inhaled VT is referred to as the dead space volume (VD). The VD is small in normal conditions but increased in diseases such as emphysema and chronic bronchitis. If total ventilation ( E) is defined as the ventilation measured at the mouth, then
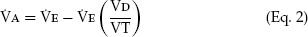
That is, alveolar ventilation is the total ventilation minus the amount ventilating the dead space. Thus,  A in Equation 1 may be reduced by a decrease in VE or by an increase in VD/VT.
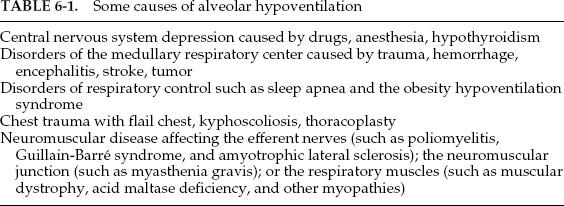
The second feature is that the hypoxemia due to alveolar hypoventilation can always be corrected by increasing the inspired oxygen concentration. An increase of approximately 1 mm Hg in inspired oxygen tension produces a 1-mm Hg increase in arterial oxygen tension. Inspired oxygen can be increased several hundred millimeters of mercury, and the hypoxemia is easily corrected. Some of the more common causes of hypoventilation are listed in Table 6-1; all reflect abnormalities in the function of the respiratory pump.
Hypoventilation can be identified as a cause of hypoxia with use of the alveolar air equation:
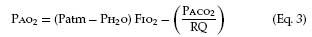
where PAO2 is the partial pressure of oxygen in the alveoli, Patm is atmospheric pressure, PH2O is the partial pressure of water (47 mm Hg at body temperature), FIO2 is the fraction of inspired oxygen, PACO2 is the partial pressure of carbon dioxide in the alveoli, and RQ is respiratory quotient (usually 0.7–0.8 with a normal diet). PAO2–PaO2 is usually called the A–a gradient or, (A–a) DO2. It is typically less than 10 in a young person and less than 20 in an older person. If it is normal, hypoxia is due to hypoventilation or a low FIO2. If it is high, hypoxia may be due to  /
/ mismatch, shunt, or diffusion impairment.
Ventilation-Perfusion Mismatch
Instead of the normal situation in which nearly equal volumes of air and venous blood go to all alveoli, a disparity (mismatch) may develop. Increased blood flow ( ) may go to alveoli whose ventilation (
 ) is reduced. Conversely, increased ventilation may go to areas with reduced blood flow. The result in either case is impaired gas exchange, often of a significant degree. In the ultimate hypothetical mismatch, all the blood goes to one lung and all the ventilation to the other, a situation incompatible with life. In the real–life situation, hypoxemia due to
  /
/ mismatch can be improved and usually corrected by increased inspired oxygen concentrations.
 /
/ mismatch is the most common cause of hypoxemia encountered in clinical practice. It explains the hypoxemia in chronic bronchitis, emphysema, and asthma. It also explains much of the hypoxemia in interstitial lung disease and pulmonary edema.
Estimating the degree and type of mismatch is complex and beyond the scope of this book. Suffice it to say, an increase in the (A–a) DO2 most often suggests the existence of. lung regions with a low  /
/ ratio, due to perfusion exceeding ventilation. The so-called physiologic dead space (VD) can also be estimated; an increase implies the existence of lung regions with a high
  /
/ ratio due to a relative increase in ventilation. To pursue this interesting subject further, the reader should consult a standard text of respiratory physiology.
Right-to-Left Shunt
In this situation, a quantity of venous blood totally bypasses the alveoli. The shunt may be intracardiac, as in atrial septal defect or tetralogy of Fallot, or it may occur within the lung, such as with arteriovenous fistulas in hereditary hemorrhagic telangiectasia (the Osler-Weber-Rendu syndrome). Blood flow through a region of total pneumonic consolidation or atelectasis also constitutes a right-to-left shunt. In shunt, the hypoxemia cannot be abolished by breathing 100% oxygen.
Impaired Diffusion
Diffusion is discussed in detail in Chapter 4. As mentioned before,  /
/ mismatch may contribute to the reduction in the diffusing capacity that is measured in the laboratory. Breathing a highoxygen concentration can usually correct the hypoxemia caused by the diffusion impairment.
Mixed Causes
There are also mixed causes of hypoxemia. The patient with COPD and pneumonia has both  /
/ mismatch and right-to-left shunting. The patient with pulmonary fibrosis has both a diffusion defect and
  /
/ mismatch.
6B. ARTERIAL CARBON DIOXIDE TENSION
The normal values for PaCO2 range from 35 to 45 mm Hg and, unlike PaO2, are not affected by age. Figure 6-2 contrasts the dissociation curve of carbon dioxide with that of oxygen. The carbon dioxide curve does not have a plateau. Thus, the carbon dioxide content of blood is strongly dependent on PaCO2, which in turn is inversely proportional to the level of alveolar ventilation (Eq. 1). Hypercapnia (that is, carbon dioxide retention with increased PaCO2) can result from either of two mechanisms. The first mechanism, hypoventilation (Table 6-1), is more readily understood. Section 6A explains that PaCO2 is inversely proportional to alveolar ventilation (Eq. 1). When alveolar ventilation decreases, PaCO2 increases.
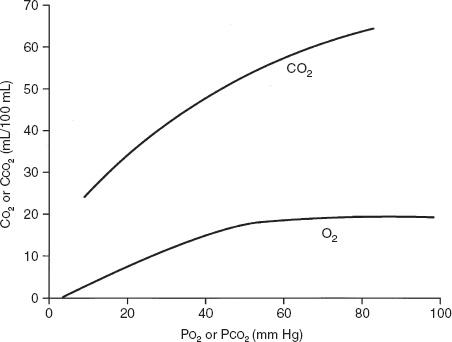
FIG. 6-2. Comparison of the shape of the oxyhemoglobin and carbon dioxide dissociation curves. The slope of the carbon dioxide dissociation curve is about three times steeper than that of the oxyhemoglobin dissociation curve. CCO2 is the carbon dioxide content of blood, CO2 is the oxygen content of blood, and PCO2 and PO2 are the partial pressures of carbon dioxide and oxygen in blood, respectively. (Modified from JB West [ed]. Respiratory Physiology: The Essentials [3rd ed]. Baltimore: Williams & Wilkins, 1985. Used with permission.)
The second mechanism is that severe  /
/ mismatch can also lead to carbon dioxide retention. When PaO2 decreases as a result of
  /
/ mismatch, as discussed previously, PaCO2 increases. This commonly occurs in COPD. However, in some patients ventilation increases to maintain a normal PaCO2. PaO2 also improves some. These are the “pink puffers.” In other patients with COPD, the PaCO2 increases and the PaO2 decreases as a result of
  /
/ mismatch. These are the classic “blue bloaters,” the cyanotic hypoventilators. Of course, many patients with COPD have a course between these two extremes.
6C. ARTERIAL pH
pH is the negative log of the hydrogen ion concentration. This means that in acidosis (low pH) there is an increase in H+ ions. The converse holds for alkalosis, with its decrease in H+ ions and increased pH.
The acid-base status of the blood is classically analyzed in terms of the Henderson-Hasselbalch equation for the bicarbonate buffer system, which highlights the importance of the arterial partial pressure of carbon dioxide (PCO2).
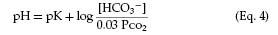
The pK is a constant related to the dissociation of carbonic acid. Note that with constant bicarbonate, increases in the PCO2 lower the pH. Conversely, lowering the PCO2 by increasing ventilation produces alkalosis (increased pH).
Respiratory alterations in acid-base status are related to elimination of carbon dioxide. Metabolic abnormalities, however, entail either a gain or a loss of fixed acid or bicarbonate in the extracellular fluid. Metabolic alterations in acid-base balance are rapidly compensated for by alternating the amount of carbon dioxide eliminated by ventilation. This is followed by the slower elimination by the kidneys of excess acid or base.
The Davenport pH-[HCO3−] diagram shown in Figure 6-3 is a useful way of looking at the body’s response to acid-base alterations. It is a graphic representation of the Henderson-Hasselbalch equation. Shown are three different buffer lines (slanting down and to the right) defining the [HCO3−] and pH responses resulting from adding metabolic acid or base to plasma. Also shown are three isopleths (slanting up and to the right) relating pH to [HCO3−] for three levels of PCO2. Point A indicates the normal situation: pH = 7.4, [HCO3−] = 24 mEq/L, and PCO2 = 40 mm Hg.
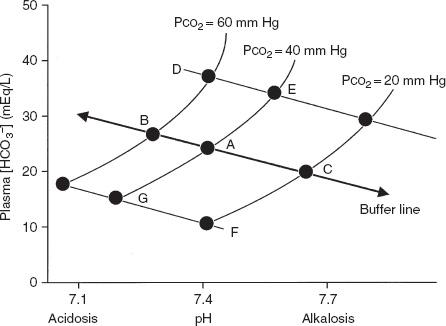
FIG. 6-3. Davenport diagram showing [HCO3−] as a function of pH and partial pressure of carbon dioxide (PCO2). (From AE Taylor, K Rehder, RE Hyatt, et al [eds]. Clinical Respiratory Physiology. Philadelphia: Saunders, 1989. Used with permission.)
Compensatory Mechanisms
- Respiratory acidosis: Point B in Figure 6-3 shows the result of acute hypoventilation; PCO2 increases and pH decreases. The kidney seeks to compensate for the acidosis when hypoventilation becomes chronic, as in COPD, by conserving [HCO3−]. The result is that point B moves toward point D and pH returns toward normal.
- Respiratory alkalosis: Point C shows what occurs with acute hyperventilation; PCO2 decreases and pH increases. As hyperventilation persists, for example, during acclimatization to altitude, the kidneys excrete [HCO3−], and as predicted from Equation 2 the pH is normalized from C toward F.
- Metabolic acidosis: Point G represents acidosis due to the accumulation of fixed acids with a lowering of plasma [HCO3−]. The respiratory system attempts to compensate by increasing ventilation, thus lowering PCO2 and moving from G toward F. The classic example is the hyperpnea of diabetic acidosis.
- Metabolic alkalosis: Loss of fixed acids, as with repeated vomiting, causes a shift from A to E. The respiratory response is a decrease in ventilation resulting in an increase in PCO2 and movement from E toward D.
6D. AN ALTERNATIVE APPROACH TO ACID-BASE ANALYSIS
An alternative approach to the Davenport diagram is preferred by some and may be easier to use in the community hospital. Not all laboratories that perform arterial blood gas analysis have a co-oximeter to determine the bicarbonate level. The bicarbonate level can be calculated with the Henderson equation, in which [H+] is the hydrogen ion concentration:
This can be rearranged to calculate the bicarbonate concentration:
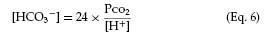
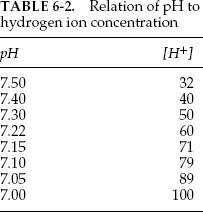
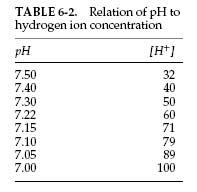
The hydrogen ion concentration (in mEq) can be calculated from the pH. Typical values are listed in Table 6-2. Intermediate values can be calculated by interpolation. Once the bicarbonate, the pH, and the PCO2 values are found, the acid-base status can be determined, and respiratory and metabolic causes of acidosis and alkalosis can be distinguished, as discussed in section 6C and Figure 6-3. A complete discussion of acid-base disturbances is beyond the scope of this book.
Many blood gas laboratories use a co-oximeter to measure total hemoglobin (Hb), hemoglobin saturation, carboxyhemoglobin (COHb), and methemoglobin (MetHb) and to calculate bicarbonate and arterial oxygen-carrying capacity (CaO2). In the emergency department, measurement of COHb and MetHb is valuable for detecting carbon monoxide poisoning and toxicity from various medications that cause methemoglobinemia. In the intensive care unit, arterial blood gas values are checked frequently, and co-oximeter results often provide the first sign of blood loss in patients who have a high risk of gastrointestinal hemorrhage.
Mandated procedures and inspections under the Clinical Laboratories Improvement Act have improved quality control in arterial blood gas laboratories. Physicians should be aware of issues related to sample contamination and calibration of medical instrumentation. A useful rule is that the sum of the PCO2 and partial pressure of oxygen (PO2) should not exceed roughly 150 mm Hg with the subject breathing room air. If the sum is more than this, the instrument’s calibration should be checked.
6F. SOME POSSIBLE PROBLEMS
Case 1
The following blood gas results are from a 40-year-old patient who was sitting when the arterial blood was drawn:
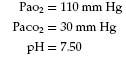
Question: How should these results be interpreted, and what is the underlying problem?
Answer: The data indicate uncompensated acute respiratory alkalosis. The patient was frightened by the needle and hyperventilated as the blood was drawn.
Case 2
The patient is a small, 70-year-old woman with lobar pneumonia. The PaO2 value on admission was 50 mm Hg and saturation was 80%; she was given 40% inspired oxygen. Two hours later the patient looked somewhat better, but the PaO2 value was not improved. However, when the saturation was measured by pulse oximetry, it had increased to 92%.
Question: What might be the cause of the disparity between the blood gas and oximetry data? If the blood gas study was correct, intubation was indicated.
Answer: The technician was asked to draw another blood sample while saturation was monitored by pulse oximetry. As this was done, it was obvious that the patient held her breath during the needlestick and blood sampling and saturation decreased. Because of her small lung volumes, further reduced by pneumonia, her alveolar oxygen tension decreased drastically, leading to the low PaO2. In a sample drawn when she did not hold her breath, the PaO2 was 80 mm Hg and the saturation was 92%.
Case 3
A 55-year-old man is being evaluated for weakness and chronic cough. He has had progressive difficulty swallowing for 6 months. His chest radiograph shows small lung volumes and bibasilar atelectasis with a superior segment infiltrate in the left lower lobe. PO2 is 45 mm Hg breathing room air, and PCO2 is 62 mm Hg.
Question: What is the cause of his hypoxia?
Answer: Hypoventilation due to respiratory muscle weakness (see Chapter 9). The A–a gradient is nearly normal. Despite the radiographic abnormalities, his  /
/ matching is still good. He is hypoxic because of his hypercapnia.

Other Tests of Lung Mechanics: Resistance and Compliance
The tests described here are usually performed in fully equipped laboratories. In the outpatient setting, they add relatively little to the basic evaluations discussed in previous chapters (spirometry, lung volumes, diffusing capacity, and arterial blood gases). However, these tests might be encountered in either graduate training or in laboratory reports and therefore are considered briefly. Also, understanding these concepts is important in the management of patients requiring mechanical ventilation.
7A. RESISTANCE
Resistance is the pressure required to produce a flow of 1 L/s into or out of the lung. The units are centimeters of water per liter per second, (cm H2O per liter per second). This general concept is illustrated in Figure 7-1, in which the pertinent driving pressure (ΔP) is the pressure difference between the ends of the tubes. The pressure required to produce a flow of 1 L/s in a large tube is less than that in a small tube. Hence, the resistance (R) of the small tube is much higher than that of the large tube.
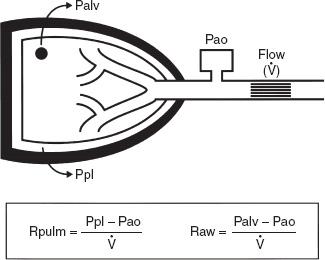
In the lung, measurement of the resistance of the entire system is of interest. Figure 7-2 illustrates how this can be obtained. Flow at the mouth can be measured with a flowmeter. The pressure driving the flow can be measured in either of two ways. Pleural pressure (Ppl) can be measured from a small balloon-catheter unit placed in the lower third of the esophagus and attached to a pressure transducer. Pressure changes in the esophagus have been shown to reflect those in the pleural cavity. The difference between Ppl and Pao (the pressure at the mouth) is the driving pressure, which divided by flow ( ) is defined as the pulmonary resistance (Rpulm). Rpulm includes airway resistance plus a small component due to the resistance of the lung tissue.
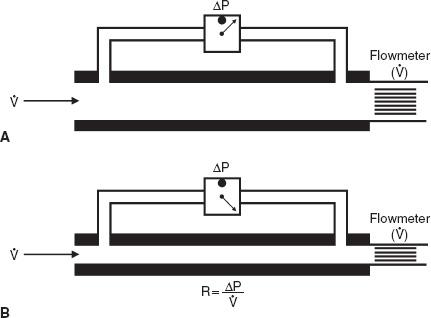
FIG. 7-1. Measurement of resistance (R) through a large tube (A) and small tube (B). Flow ( ) is measured by the flowmeter, and driving pressure (ΔP) is measured by a differential pressure transducer. To drive the same flow, the decrease in pressure is greater in tube B and hence the resistance (R) of tube B is higher than that of tube A.
The other and much more common resistance measurement is obtained by measuring alveolar pressure (Palv) and relating this to Pao. Palv can be measured in a body plethysmograph and does not require swallowing an esophageal balloon. In this method, the driving pressure is Palv minus Pao. This result is divided by flow to determine the airway resistance, Raw. Raw is slightly lower than Rpulm because of the absence of tissue resistance. Both Rpulm and Raw can be measured during either inspiration or expiration, or as an average of both. Figure 7-3 describes how Raw is measured.
Average resistance in normal adults is 1 to 3 cm H2O/L per second. It is higher in the small lungs of children because the airways are smaller. Occasionally, the term conductance is used. Conductance is a term borrowed from the electrical engineering field and is the reciprocal of resistance, its units being liters per second per centimeter of water, L/s per cm H2O. Thus, a high resistance means a low conductance—flow is not “conducted” well.
Stay updated, free articles. Join our Telegram channel

Full access? Get Clinical Tree


