Test Validation and Statistics
I. THE GOLD STANDARD
This is the reference test that is assumed to be “the truth.” It is important to determine validity of noninvasive studies by comparing them to the gold standard. By comparing studies to the gold standard, limitations of the test can be identified or a level of confidence in the test may be established. Ideally, results will match 100% of the time. Realistically, results that match 90% of the time are considered good.
II. FIVE MEASURES BY WHICH COMPARISONS TO THE GOLD STANDARD ARE EVALUATED
A. Specificity.
This is the ability of a test to document a normal study when the gold standard also documents a normal study. It can be calculated using the following formula:
True negatives/(true negatives + false positives)
B. Sensitivity.
This is the ability of the test to detect disease, confirmed by an abnormal result with the gold standard. It can be calculated using the following formula:
True positives/(true positives + false negatives)
C. Positive Predictive Value.
This indicates the percentage of noninvasive test results that accurately predict abnormality. It reveals how meaningful a positive result actually is. It is calculated using the following formula:
True positives/(true positives + false positives)
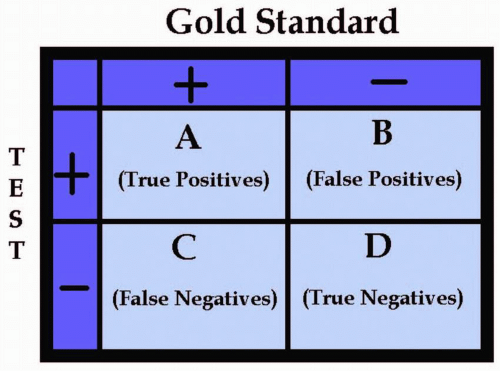 FIGURE 8.1. 2 × 2 factorial table.
Stay updated, free articles. Join our Telegram channel
Full access? Get Clinical Tree
 Get Clinical Tree app for offline access

|