Techniques for Cardiovascular Computed Tomography
Jacob Geleijns
Raoul M.S. Joemai
Albert de Roos
Lucia J.M. Kroft
Computed tomography (CT) is a relatively new versatile clinical tool for assessing acquired and congenital cardiovascular diseases. A CT scan is used not only for the assessment of ischemic heart disease, but also for congenital heart disease, large vessel disease, pulmonary embolism, and pulmonary vein imaging. CT imaging can contribute to screening, diagnosis, treatment optimization, and follow-up of patients with (suspected) cardiovascular diseases.
Fast multislice computed tomography (MSCT) offers three-dimensional (3D) opportunities for simultaneously imaging the coronary arteries (1,2) and myocardium (3) at any time point in the cardiac cycle. As a noninvasive examination, cardiac CT has a low complication rate and allows for generating consistent good image quality at low radiation doses to patients (4).
The speed and relative simplicity of the examination contribute to patient comfort. Cardiac CT imaging offers good spatial and good low-contrast resolution. Limitations of CT imaging include radiation exposure, not providing realtime guidance for coronary interventions, administration of potentially allergenic, and nefrotoxic intravenous contrast material and image artifacts. Other diagnostic imaging techniques for cardiac pathology include two-dimensional (2D) projection imaging of the coronary arteries and bypass grafts with invasive coronary angiography and imaging of the myocardium with echocardiography, cardiovascular MRI, SPECT, or PET.
Visualization of cardiac morphology by CT was already reported in 1976. The infarcted area of the myocardium, both in unenhanced and in enhanced acquisitions, was at that time identified in ex vivo CT examinations in dogs after deliberate coronary occlusion (5,6 and 7). These early experiments provided a first indication for the potential of cardiac CT and they illustrated the excellent low-contrast resolution of axial CT imaging compared to x-ray projection radiography. Being ex vivo experiments, these first cardiac CT studies did not address the main challenge of cardiac imaging; that is, to reduce motion artifacts to an acceptable level. Motion artifacts cause blurring of CT images. Cardiac CT is particularly susceptible to respiratory and cardiovascular motion. In 1976, Harell et al. (8) performed experiments to demonstrate the feasibility of in vivo cardiac CT by imaging the heart of a patient using a CT scanner with 6-second rotation time. They described different approaches to minimize the effect of cardiac motion and presented “stop-action images” (Fig. 3.1). The methodologies that were developed in these early years of cardiac CT are still the conceptual basis for current techniques in cardiac CT and include reducing the duration of data acquisition and synchronization with
the ECG. Cardiac CT, nowadays, is a technique capable of imaging the small, fast-moving coronary arteries, including their calcifications, stenoses, and stents; imaging bypass grafts; assessment of ventricular function; and visualization of myocardial perfusion. This chapter focuses on cardiac CT with scanners employing a fast-rotating x-ray tube and detector array assembly. It does not address other implementations of 3D x-ray cardiac imaging with x-rays, such as cardiac electron beam CT (9), which nowadays has become extinct, and the new application of 3D rotational coronary angiography with C-arm systems by cardiologists in the catheterization laboratories (10,11).
the ECG. Cardiac CT, nowadays, is a technique capable of imaging the small, fast-moving coronary arteries, including their calcifications, stenoses, and stents; imaging bypass grafts; assessment of ventricular function; and visualization of myocardial perfusion. This chapter focuses on cardiac CT with scanners employing a fast-rotating x-ray tube and detector array assembly. It does not address other implementations of 3D x-ray cardiac imaging with x-rays, such as cardiac electron beam CT (9), which nowadays has become extinct, and the new application of 3D rotational coronary angiography with C-arm systems by cardiologists in the catheterization laboratories (10,11).
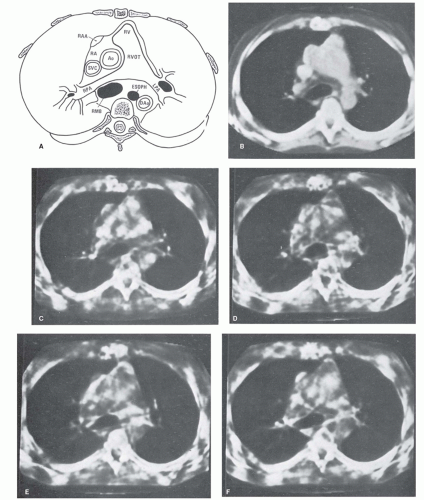 Figure 3.1. CT cardiovascular “stop action” images at five phases of the cardiac cycle obtained in 1976, using 6-second rotation time and 12-second acquisition time.A retrospective segmented sinogram space reconstruction was performed. (From: Harell GS, Guthaner DF, Breiman RS, et al. Stop-action cardiac computed tomography. Radiology. 1977;123(2):515-517, with permission.) |
TECHNICAL PRINCIPLES OF MULTISLICE COMPUTED TOMOGRAPHY
It took more than 25 years of innovation in mechanical and electronic engineering after Harell’s description of “stopaction cardiac CT” to develop CT scanners that fulfill the minimal requirements for the introduction of cardiac CT imaging of the entire heart and coronary arteries in routine clinical practice. Excellent in-plane spatial resolution and low-contrast resolution became available in the 1980s with axial single slice CT scanners. Coverage of the entire heart, from apex to the base, within one breath-hold became feasible 10 years later with the introduction of helical CT in the early 1990s; with these scanners, studies were still performed in rather thick (≥5 mm) slices (12). The combination of thin slices (≤2 mm) and sufficient volume coverage for imaging the entire heart within one breath-hold was realized with the introduction of MSCT scanners operating at rotation times well below 1 second (13). CT technology developed further, and currently cardiac CT imaging can be performed within one heartbeat by using axial wide cone beam volumetric CT or fast, helical dual-source CT (Fig. 3.2).
X-ray imaging is based on the registration of the transmission of x-rays through the body. In radiography and fluoroscopy, the x-ray transmission is measured in one fixed direction yielding a 2D projection of organs and tissues within the exposed part of the human body. In CT, x-ray transmission is registered under a large number of projection angles enabling the reconstruction of axial images and thus avoiding superposition of organs and tissues.
Reconstructed axial CT images show pixels, typically in a 5122 matrix. In cardiac CT, the length and width of these pixels measure about 0.4 mm, depending on the field of view. The height of the associated voxels is in the order of magnitude of 0.5 to 3 mm, depending on the clinical application, with thin slices (<1 mm) in coronary CT angiography, and 3-mm thick slices in coronary artery calcium scoring. The numerical value associated to the pixels represents the average linear x-ray attenuation coefficient of the tissues within the associated voxel relative to the attenuation of water, and these values are referred to as Hounsfield units (HU). The pixel value for air is by definition -1000 HU and for water, 0 HU. Human tissues and the lumen of enhanced vessels can be characterized by a range of Hounsfield units; for example, fat slightly below 0 HU, soft tissue and noncalcified plaque slightly above 0 HU, enhanced coronary arteries in the range of +200 HU, and calcified plaque and bone well above several hundreds of HU (Fig. 3.3). The HU for voxels that contain more than one tissue represents the average attenuation within the voxel; this averaging is referred to as the partial volume effect. The partial volume
effect affects image quality especially in case of large voxels, such as within thick reconstructed slices and within voxels at the border of two tissues with a large difference in HU, or at the border of coronary artery lumen and calcified plaque.
effect affects image quality especially in case of large voxels, such as within thick reconstructed slices and within voxels at the border of two tissues with a large difference in HU, or at the border of coronary artery lumen and calcified plaque.
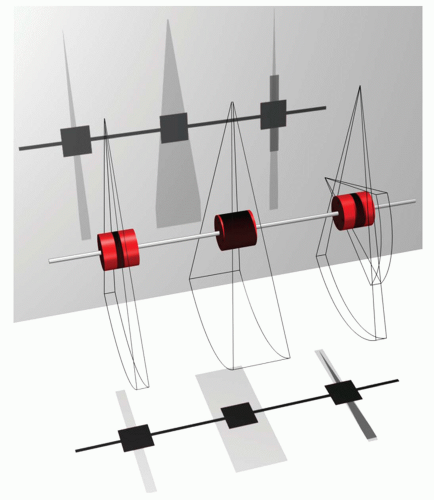 Figure 3.2. Contours of the x-ray beams for three types of CT scanners. From left to right: A 64-slice CT scanner (coverage 32 mm), a volumetric CT scanner (coverage 160 mm), and a dual source CT scanner (coverage 38 mm). |
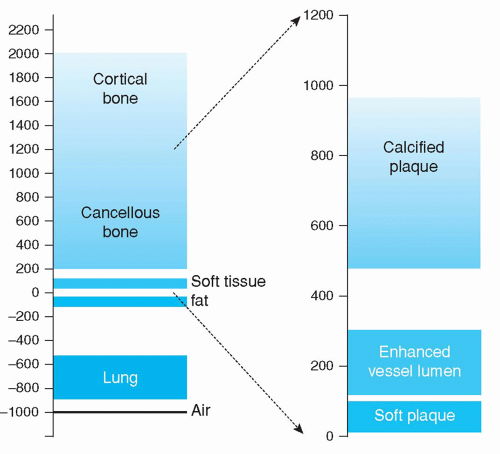 Figure 3.3. Range of Hounsfield units for several tissues and for plaque and enhanced lumen of the coronary arteries. |
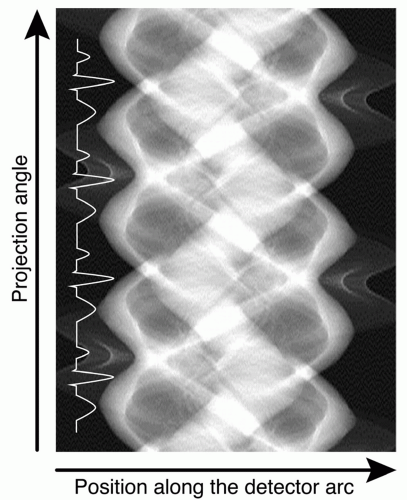 Figure 3.4. Cardiac CT involves simultaneous registration of transmission profiles and an ECG. Each horizontal line in sonogram space represents one transmission profile, at a certain acquisition angle and is associated with the registered ECG signal. MSCT yields multiple sinogram space, that is, each acquisition channel generates its own sinogram space. |
The detectors of a CT scanner record x-ray transmission as a transmission profile. Each transmission profile acquired with the rotating x-ray tube and detector array is associated with a specific projection angle. Transmission profiles measured at consecutive angles yield the lines from which the so-called sinogram space is composed (Fig. 3.4). The horizontal axis in sinogram space is associated to the position along the detector array and represents the transmission measured by all detector elements along one detector array. The vertical axis of sinogram space represents the consecutive projection angles. The sinogram space is visualized by gray levels that correspond to the recorded x-ray transmission for each detector element and for each projection angle. The technique of filtered back projection provides the reconstructed images, but other reconstruction algorithms have become available, like iterative reconstruction techniques.
The basic acquisition parameters in helical and axial cardiac MSCT are slice thickness, number of active detector arrays, x-ray tube rotation time, and in helical CT, also the pitch factor. These parameters must be optimized to achieve contradictory goals such as minimal motion artifacts, coverage of the entire volume of interest, coverage of the cardiac phases of interest, good spatial resolution, and as less radiation dose as possible.
The small, generally 0.5 to 0.625 mm thick, scanned volume corresponding to one registered transmission profile at any moment is referred to as a slice; it is an acquisition parameter that is selected by the operator of the scanner and determines the minimal voxel height within the reconstructed slice.
The latest MSCT scanners register from 64 to 320 transmission profiles simultaneously. Slice thickness and the number of simultaneously acquired transmission profiles together are referred to as the acquisition configuration; for example, an acquisition configuration of 64 × 0.625 mm refers to recording simultaneously 64 transmission profiles each with a slice thickness of 0.625 mm. In this example, the nominal beam width is 64 × 0.625 = 40 mm, and coverage of the entire heart is achieved either in successive axial acquisitions or one helical acquisition. An acquisition configuration of up to 320 × 0.5 = 160 mm can be selected for a wide cone beam volumetric CT scanner; this provides enough coverage for scanning the entire heart in one axial scan.
Rotation time is the duration of a 360-degree rotation of the x-ray tube. The higher the rotation speed, the faster data acquisition and the shorter the rotation time. In helical CT, in order to achieve coverage of the entire volume of interest, the rotation of the x-ray tube is coupled with a continuous translation of the patient through the gantry of the CT scanner. The helical pitch factor is the ratio of patient displacement per 360-degree rotation of the x-ray tube divided by the total nominal thickness of all simultaneously acquired transmission profiles, or in other words, it is the table movement per gantry rotation relative to the beam width.
The acquisition window is duration of the data acquisition at a specific level within the scanned volume. In axial scans, the acquisition window is the actual duration of the axial scan, the axial scan must be at least long enough to cover a 180-degree acquisition, but may be longer in order to cover more cardiac phases or heartbeats. The acquisition window in helical cardiac CT can be estimated by dividing rotation time by the pitch factor. In helical cardiac CT with retrospective ECG gating, the acquisition window should be long enough to catch at least the entire cardiac cycle at any level along the entire volume of interest. A sufficiently long acquisition window can be achieved by a small pitch factor. To facilitate synchronization, cardiac CT scanners are equipped with a device for recording an electrocardiogram (ECG). Data acquisition in cardiac MSCT thus consists of simultaneous registration of transmission profiles together with the associated ECG signal.
PHASE SELECTION AND TEMPORAL RESOLUTION
The main challenge of cardiac CT is to minimize blurring due to motion. This is achieved by optimizing phase selection; that is, reconstruction of the scan at the cardiac phase with least motion and good temporal resolution. For phase selection usually ECG is used. Phase selection is complicated since the cardiac rest phase depends on the heart rate. At lower heart rates, least cardiac motion occurs predominantly at the middiastolic phase, but at higher heart rates minimal motion may occur at end systole.
Phase selection can be performed during the acquisition (prospective) and the reconstruction (retrospective). These
two techniques for phase selection are generally referred to as prospective ECG triggering of the acquisition and retrospective ECG gating of the reconstruction. Often a combination of prospective ECG triggering of the acquisition and retrospective ECG gating of the reconstruction is applied. If no prospective phase selection is performed then the acquisition window must cover the entire RR interval, and in this case, retrospective-gated reconstructions can be made any cardiac phase point but at the cost of elevated patient exposure.
two techniques for phase selection are generally referred to as prospective ECG triggering of the acquisition and retrospective ECG gating of the reconstruction. Often a combination of prospective ECG triggering of the acquisition and retrospective ECG gating of the reconstruction is applied. If no prospective phase selection is performed then the acquisition window must cover the entire RR interval, and in this case, retrospective-gated reconstructions can be made any cardiac phase point but at the cost of elevated patient exposure.
During prospective ECG-triggered acquisitions, ECG is used to trigger the start of the acquisition. ECG can also be used to limit the acquisition window to only that part of the RR interval that covers the cardiac rest phase; this is done in order to reduce patient radiation dose. ECG can also be used to optimize the tube current; this can be achieved by either modulating the tube current in real time between higher and lower levels, or by periodically switching the tube current on and off. Prospective ECG triggering is a common practice in cardiac CT and can be used for both helical and axial acquisitions, and for wide cone beam and dual source CT scanners.
Cardiac phase points define a reconstruction window within the cardiac cycle. Techniques for synchronization often assume a linear relationship between the ECG and the actual contraction and relaxation of the heart chambers, which might be a good assumption if heart rate does not vary too much, but artifacts might occur even in case of mild arrhythmias.
Figure 3.5 shows the acquisition technique and resulting image quality of a low-dose prospective ECG-triggered
helical acquisition. Note that tube current was only on during the gray-marked intervals (acquisition windows). The figure also shows that the ECG-triggered acquisition was performed with an acquisition window that was slightly longer than the reconstruction window. This allows for some retrospective optimization of the phase selection.
helical acquisition. Note that tube current was only on during the gray-marked intervals (acquisition windows). The figure also shows that the ECG-triggered acquisition was performed with an acquisition window that was slightly longer than the reconstruction window. This allows for some retrospective optimization of the phase selection.
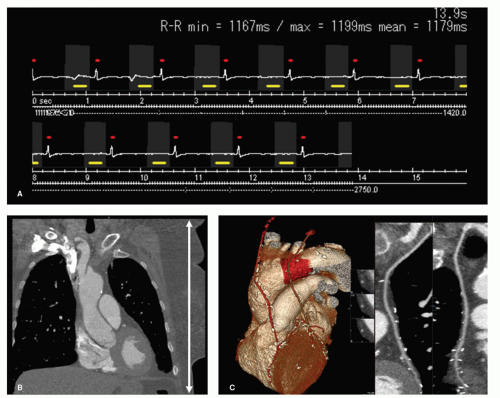 Figure 3.5. A prospective ECG-triggered helical scan in a 64 × 0.5 mm acquisition configuration in a 74-year-old female patient after bypass surgery. The ECG (A) shows the identified R-peaks (red), the short intervals of data acquisition (or acquisition windows, in gray), and marked in yellow the reconstruction windows. This acquisition mode allows for low-dose full thorax imaging (B). A range of 260 mm was acquired in 11 consecutive heartbeats as to visualize the full bypass trajectory after left and right internal mammary artery use (C). Patient had a low heart rate of 50 to 51 beats/minute and was exposed to x-rays only at diastole (effective dose 5.7 mSv, DLP 405 mGy cm, 13.9 seconds scan time, acquisition window at 75% RR, and a helical pitch factor of 0.23). |
In general noncardiovascular applications of CT, the reconstruction window (also referred to as temporal resolution) of any reconstructed image simply equals the full 360-degree rotation time. Rotation times of modern scanners are about one-third of a second. A reconstruction window of this order of magnitude is sufficiently short for most applications of CT, but not for cardiac CT. In CT, opposing projections yield identical transmission profiles meaning that 360-degree sinogram space contains redundant information. The minimal requirements for the CT reconstruction are achieved by excluding all redundant transmission profiles from sinogram space. This yields a 180-degree sinogram space corresponding to a reconstruction window of approximately half the rotation time. For typical rotation times of respectively 0.35, 0.5, and 0.6 seconds, the reconstruction window associated with a reconstruction from a 180-degree sinogram space would be approximately 175, 250, and 300 milliseconds. A quarter of a rotation is sufficient for covering 180-degree sinogram space with a dual source CT scanner; thus for these scanners, the reconstruction window is about one-fourth of the rotation time (14).
To achieve an extra short reconstruction window, techniques have been developed to record transmission profiles during more than one heart cycle throughout the entire volume of interest. The reconstructed slices can then be derived from a so-called 180-degree segmented sinogram space, where small complementary subsegments of sinogram space are derived from successive heartbeats together yielding the 180-degree segmented sinogram space. This technique was already described in 1977 by Harell et al. (8) (Fig. 3.6), and is based on a relatively long acquisition window. The reconstruction window (temporal resolution) that can be achieved theoretically with this technique in retrospective ECG-gated reconstructions is shown in Figure 3.7. The figure applies to a reconstruction algorithm that allows for including all available subsegments in sinogram space. Note that the reconstruction window is independent of rotation time and thus explains the feasibility of cardiac CT by Harell et al. (8) even at a CT scanner with a rotation time of 6 seconds. To achieve the optimal curves in Figure 3.7, it was assumed that rotation time was adapted accurately to the heart rate. In general practice, the theoretically achievable lowest reconstruction window cannot always be realized, since optimal adaptation of rotation time to the actual heart rate cannot be achieved due to the fixed values of rotation time and variations in heart rate during the CT scan.
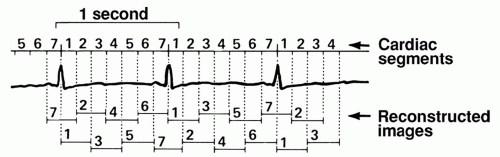 Figure 3.6. Three of the acquired 13½ cardiac cycles. The RR interval for each cycle was subdivided into seven cardiac segments representing different cardiac phases. In reconstructing axial images at different cardiac phases, angular projections (or raw data) from all cardiac cycles, corresponding with the cardiac phase of interest, were used. (From: Harell GS, Guthaner DF, Breiman RS, et al. Stop-action cardiac computed tomography. Radiology. 1977;123(2):515-517, with permission). |
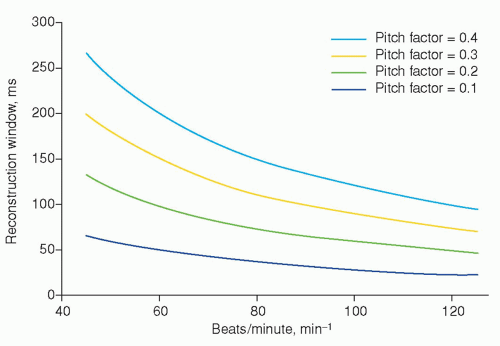 Figure 3.7. Theoretic reconstruction window as a function of heart rate and pitch factor. The graphs are calculated, assuming optimal segmentation of sinogram space and thus optimal adaptation of rotation time to the heart rate. A short reconstruction window reduces motion artifacts, it requires a low pitch factor, especially at low heart rates. |
Volume rendering of two scans of one and the same patient (Fig. 3.8) illustrates the difference in image quality
obtained with a cardiac CT scan (ECG synchronized) versus a regular CT scan (nonsynchronized). The volume rendering of the synchronized images shows the heart in the retrospectively selected diastolic phase. All different phases of the cardiac cycle express in the nonsynchronized images as smooth deformations of the heart. The long reconstruction window leads to poor temporal resolution and blurring of the coronary arteries in the nonsynchronized images whereas the short reconstruction window of the ECG synchronized and retrospectively gated reconstruction enables good temporal resolution and visualization of the coronary arteries.
obtained with a cardiac CT scan (ECG synchronized) versus a regular CT scan (nonsynchronized). The volume rendering of the synchronized images shows the heart in the retrospectively selected diastolic phase. All different phases of the cardiac cycle express in the nonsynchronized images as smooth deformations of the heart. The long reconstruction window leads to poor temporal resolution and blurring of the coronary arteries in the nonsynchronized images whereas the short reconstruction window of the ECG synchronized and retrospectively gated reconstruction enables good temporal resolution and visualization of the coronary arteries.
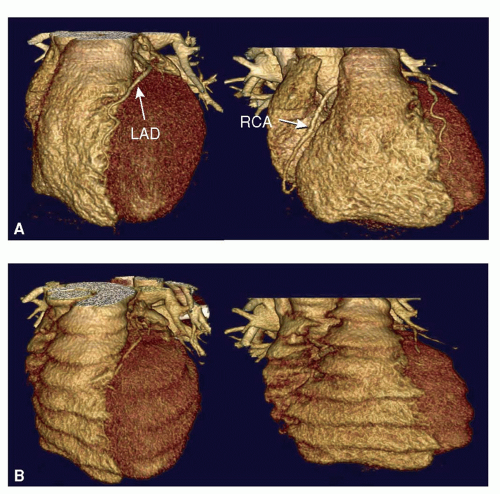 Figure 3.8. Volume rendering of two scans of the same patient illustrates the difference in image quality obtained with a retrospectively gated 180-degree segmented sinogram space reconstruction (ECG synchronized) (A) versus a regular 360-degree sonogram space reconstruction (not synchronized) (B). |
MULTISLICE COMPUTED TOMOGRAPHY IMAGING REQUIREMENTS
REQUIRED SPATIAL RESOLUTION
Spatial resolution, or high-contrast resolution, is the ability to observe the contours of small objects within the scanned volume. Small objects can be resolved properly only when they provide a rather large difference in signal (HU’s) compared to the direct environment. Spatial resolution plays an important role in the visualization of contrast-enhanced distal segments of coronary arteries, calcifications, or stents (Fig. 3.9). In CT,
spatial resolution is limited not only by the acquisition geometry; that is, the dimensions of the detector elements, smallest available slice thickness, focus size, and focus to detector distance, but also by the reconstruction filter and the reconstructed slice thickness.
spatial resolution is limited not only by the acquisition geometry; that is, the dimensions of the detector elements, smallest available slice thickness, focus size, and focus to detector distance, but also by the reconstruction filter and the reconstructed slice thickness.
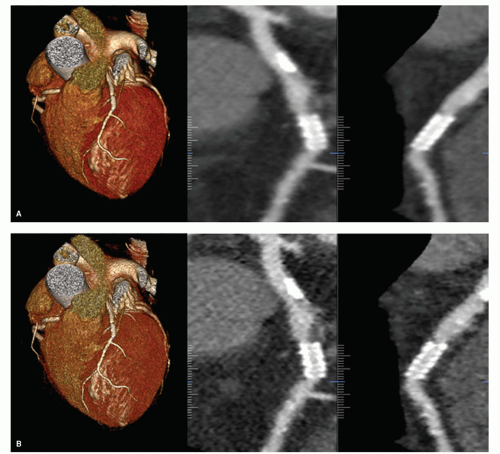 Figure 3.9. Stent reconstructed with medium-soft and sharp kernel. Visualization of the stent in the left anterior descending coronary artery. The medium-soft kernel reconstruction is generally used for coronary artery evaluation (A), but suffers, at the level of the stent, from blooming artifacts that hamper evaluation of the stent, especially within the stent lumen. Additional sharp kernel reconstruction allows better delineation of the stent itself and usually also stent lumen (B). Note the proximal stent-edge intima hyperplasia/plaque causing stenosis. |
TABLE 3.1 Lumen Diameter of Normal Coronary Artery Segments and Venous Bypass Grafts | ||||||||||||||||||||||||
|---|---|---|---|---|---|---|---|---|---|---|---|---|---|---|---|---|---|---|---|---|---|---|---|---|
| ||||||||||||||||||||||||
The reconstruction of small isotropic voxels facilitates advanced postprocessing and 3D image viewing, and is particularly advantageous for review of the coronary arteries. The actual diameters of the lumen of normal coronary artery segments range from 5 mm in the proximal segments to less than 1 mm in the distal segments. Venous bypass grafts typically range from 4 to 6 mm (Table 3.1). This means that a voxel size of 1 mm3 should be sufficient for imaging of the coronary arteries, except for distal segments that would require a spatial resolution of at least 0.5 mm3. A spatial resolution of 2 mm3 might be sufficient for imaging the lumen of venous bypass grafts, but for imaging of structures within the coronary arteries, such as atherosclerotic plaque and stents, excellent spatial resolution even better than 0.5 mm3 might be required. The requirements for spatial resolution are of course less demanding for imaging larger structures such as the myocardium, large thrombi, pulmonary veins, or heart chambers.
REQUIRED TEMPORAL RESOLUTION
The reconstruction window determines the ability to resolve fast-moving objects in the displayed CT image. The reconstruction window is also referred to as the temporal resolution and plays an essential role in the visualization of a beating heart and its coronary arteries. A short reconstruction window avoids degradation of both low-contrast resolution and spatial resolution in the image, generally referred to as blurring of the image, due movement of the cardiac wall and coronary arteries. Actual in-plane velocities of human coronary arteries have been measured at different moments during the cardiac cycle by means of imaging techniques that allow for a very short reconstruction window; that is, gradient-echo MRI (15) and prospectively triggered electron beam CT (16). With these techniques, a reconstruction window as short as 15 milliseconds (MRI) and 50 milliseconds (EBT) was achieved. In these publications, it is concluded that the reconstruction window should be lower than 100 milliseconds for coronary angiography in middiastole at 62 ± 10 beats/minute (17) and that a 100-millisecond reconstruction window is relatively optimal for most patients at heart rates up to 90 beats/minute (16). These considerations assume imaging at the cardiac phase point that is associated with least motion; for example, reconstruction window starting between 60% and 80% of the interval between two consecutive R waves. In practice, the requirements on the reconstruction window appear to be less demanding: A reconstruction window for coronary CT angiography of 250 milliseconds seems to be sufficiently short at heart rates below 70 beats/minute (18). More strict criteria for the reconstruction window apply if the heart should be assessed at more than one cardiac phase point, including those that are associated with rapid movement of the heart wall; for example, for studying the dynamics of the myocardium. Alfidi et al. (19) concluded already in 1976 that for imaging the dynamics of the heart with CT, such as the detection of akinetic and dyskinetic myocardium, it should become possible to achieve a reconstruction window smaller than 50 milliseconds. However, accurate evaluations of cardiac function by CT have been reported under less strict conditions, at reconstruction window exceeding 50 milliseconds (20).
LOW-CONTRAST RESOLUTION
Stay updated, free articles. Join our Telegram channel

Full access? Get Clinical Tree


