Age, year
67 ± 4.6
BMI, kg/m2
28.6 ± 3.0
Blood pressure systolic/diastolic (mmHg)
136 ± 23/84 ± 15
Fasting glucose (mg/dL)
97.1 ± 14.0
Creatinine (mg/dL)
0.8 ± 0.2
2.3 Experimental Design
The study was a prospective, crossover trial, in which every individual served as its own control. The experimental design is displayed in Fig. 1. All subjects underwent a 4 weeks washout period, during which they were briefed to avoid tea drinking and antioxidant supplements until the end of the study. At the end of the washout period, blood and saliva samples were collected after 12 h of night fast. Subsequently, all subjects received the maltodextrin containing PB “tea bags”. The subjects were instructed to brew the PB sachets for 5 min in 240 mL boiling water without stirring and to drink 4 cups per day for 12 weeks period (PB period). After the PB period, fasting samples were collected once more and the subjects received the GT bags. Preparation and drinking instructions were the same as those for the PB drink. At the end of the 12 weeks, GT drinking, fasting blood, and saliva samples were drawn for the third time. During the study, every 4 weeks the subjects were given additional PB or GT bags. For compliance purposes, leftover tea bags were counted and actual consumption was assessed. Nutritional consumption of macronutrients and antioxidants was assessed using a food diary at the beginning, middle, and end of the study. The mean intakes were analyzed using Tzameret (version 2) dietary analysis program (Department of Nutrition, Ministry of Health, Jerusalem, Israel).


Fig. 1
Time plot of experimental design
2.4 Blood Analysis
Blood was collected into disposable vials containing EDTA and separated for plasma and erythrocytes. Plasma was stored at −80 °C for subsequent analyses of oxidized proteins and lipids. Plasma protein carbonyls assay was performed according to the Reznick and Packer (1994) procedure and is presented in nmol per mg of plasma proteins. Plasma lipid peroxidation TBARS assays and plasma peroxides are described elsewhere and expressed as nmol per ml (Lavie et al. 2004). Oxidized lipid results was also adjusted for total plasma lipids [total lipids = 1.28(total cholesterol + triglycerides) + 96 (mg/dL)] (Thuresson et al. 2005).
Erythrocytes were washed 3 times with isotonic saline, kept for 6 days in 4 °C for catalase assay and analyzed immediately for 2,2′-azo-bis (2-amidinopropane) dihydrochloride (AAPH)-induced hemolysis test (HT). The test was based on previously reported protocols (Costa et al. 2009; Verma et al. 2006) and modified as follows: 0.4 ml washed erythrocytes was added to 9.5 ml saline. Two ml of diluted erythrocytes was added to DDW, 100 mM AAPH or saline to a final tube volume of 4 ml. All tubes were incubated at 37 °C for 2.5 h with intermittent shaking. After centrifuging the incubated tubes at 4,000 rpm for 10 min, absorbance was read spectrophotometrically at 540 nm. The HT percentage was calculated by dividing absorbance of AAPH-induced hemolysis from DDW-induced hemolysis. Saline tubes served as a negative control. Catalase activity was determined in erythrocytes hemolysates according to Aebi’s method (1984) and expressed as mU per mg of hemoglobin protein.
2.5 Saliva Analysis
Non-stimulated whole saliva was collected between 7:00 and 8:00 a.m. to avoid circadian variations and stored in 4 °C until the formation of solid sediment containing squamous cells and cell debris. The supernatant was used for the following assays. The activity of OPO was measured according to the 5,5′-dithiobis, 2-nitrobenzoic acid thiocyanate (NBS-SCN) assay as described previously (Narotzki et al. 2013a) and expressed as mU per mg of saliva supernatant protein. Saliva was diluted 1:2 with DDW and used for TAC analysis as described above. Saliva TAC expressed as mM Trolox equivalents per mg of saliva supernatant protein.
2.6 Statistical Analysis
Results are expressed as means ± SD. SPSS Statistics 17 (SPSS Software, Chicago, IL, USA) was used for GT and placebo drinks total phenols and TAC analysis (one way ANOVA followed by post hoc Tukey’s test).
SAS software (version 9.2, SAS Institute Inc, Cary, NC, USA) was used for The MIXED model analyzes of the time changes. Time was specified as categorical. The covariance structure was unspecified and was estimated on the basis of the data. In the comparisons of the means that correspond to different time points, Tukey’s procedure was used to allow for the multiple comparisons. All statistical tests were 2-tailed with a significance level set at P < 0.05.
3 Results
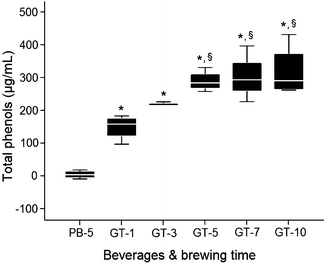
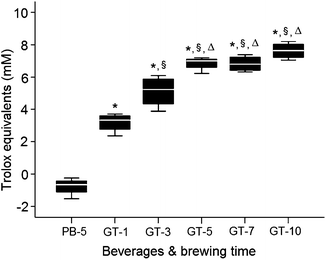
Total phenols content of PB bags brewing in boiling water, was close to zero. GT phenols content rose substantially from 1 to 5 min brewing in boiling water, and marginally increased from 5 to 10 min (Fig. 2). Similar GT different brewing time trends were observed with TAC analysis, while PB capacity was lower than the TAC assay buffer (Fig. 3).


Fig. 2
Brewing time effects on placebo (PB)/green tea (GT) total phenols content. PB or GT bags were added to 240 ml of boiling DDW for different brewing time points (min). Changes in total phenols expressed as μg/mL of gallic acid equivalents. *Difference from placebo, p < 0.05; §difference from 1 min brewing, p < 0.05. Data are means ± SD (n = 4)

Fig. 3
Brewing time effects on placebo (PB)/green tea (GT) total antioxidant capacity (TAC). PB or GT bags were added to 240 ml of boiling DDW for different brewing time points (min). Changes in TAC expressed as mM of Trolox equivalents. *Difference from placebo, p < 0.05, §difference from 1 min brewing, p < 0.05; Δdifference from 3 min brewing, p < 0.05. Data are means ± SD (n = 4)
Compliance with PB and GT drinking was 94.0 ± 5.9 % and 95.9 ± 3.4 %, respectively. According to the nutritional food diary, the consumption of total calories, fat, carbohydrates, dietary fibers, vitamin C, vitamin E, and carotenes remained stable during the study.
Plasma, erythrocytes, and saliva oxidative stress biomarkers as well as antioxidant capacity are summarized in Table 2. Plasma oxidative stress biomarkers: protein carbonyls, TBARS, and peroxides remained unchanged by GT drinking. However, peroxides concentrations slightly increased after PB drinking (4.4 % increase at Week 12, compared with baseline, p = 0.006). Oxidized lipids, adjusted for the total plasma lipid, did not make any difference compared with crude data.
Table 2
Plasma, erythrocytes, and saliva oxidative stress biomarkers as well as antioxidant capacities
Baseline | Week 12 | Week 24 | % change (Week 24 vs. Week 12) | |
|---|---|---|---|---|
Plasma | ||||
Protein carbonyls, nmol/mg | 0.65 ± 0.27 | 0.62 ± 0.20 | 0.66 ± 0.17 | +6.5 |
TBARS, nmol/mL | 11.27 ± 1.53 | 11.51 ± 1.80 | 11.50 ± 1.87 | −0.1 |
Peroxides, nmol/mL | 487.43 ± 41.38 | 508.83 ± 42.81a | 519.77 ± 48.22 | +2.2 |
Erythrocytes | ||||
Catalase activity, mU/mg | 32.95 ± 3.34 | 31.42 ± 3.72 | 32.99 ± 4.18 | +5.0 |
HT, percentage | 69.55 ± 15.39 | 71.27 ± 9.89 | 64.01 ± 12.48b | −10.2 |
Saliva | ||||
OPO activity, mU/mg | 347.51 ± 286.14 | 313.18 ± 299.85 | 328.20 ± 189.44 | +4.8 < div class='tao-gold-member'>
Only gold members can continue reading. Log In or Register to continue
Stay updated, free articles. Join our Telegram channel
Full access? Get Clinical Tree
 Get Clinical Tree app for offline access

|