Sedentary group (12)
Active group (10)
Mean ± SD
Range
Mean ± SD
Range
Sex (F/M)
8/4
–
7/3
–
Age (yr)
57 ± 5
51–63
55 ± 4
50–60
2.2 NOx Assay
NOx were measured in the serum obtained after night sleep. The assay followed the exact protocol as previously described (Carmeli et al. 2009). Sera from all participants were provided by a nurse practitioner. A total of 6 mL of venous blood samples were collected after an overnight fasting and were drawn into ‘vacutainer’ 10 mL tubes for metabolite assays, which did not contain any additives. Briefly, 40 mL of each sample were transferred to 96-well plates and mixed with 40 μL of the reduction solution (NADPH 1.25 ng/μL; FAD 10.4 ng/μL; KH2PO4 0.125 M) containing 0.5 U of NO2 reductase for 2 h at 37 °C. After this time, 80 μL of Griess reagent (one part 0.1 % N-1-naphthyl-ethylene-diamine dihydrochloride in water and one part 1 % sulfanilamide in 3 % concentrated H3PO4) were added to each well. The mixture was incubated for 5 min at room temperature and read at 540 nm in a microplate reader. Concentrations were determined by a standard curve of sodium nitrite. The detection limit of the assay was 1 mM of nitrite.
2.3 Global Oxidative Stress Analysis
This assay followed the same protocol as previously describe (Carmeli et al. 2008). The analyses were carried out using CR 3000 instrument (FORM system, Catellani Group, Callegari S.p.A, Parma, Italy). All measurements were performed within 0.3–1 h post blood drawing. The CR 3000 instrument includes software and photometers (505 nm) with one or three reading cells for the determination of primary tests on whole capillary blood. The CR 3000 kits include ready filled cuvettes (4.8 pH buffered chromogen) that are bar coded (so that the reader automatically recognizes the test about to be performed and the k-factor), and capillaries for blood collection. The prepared reagents are able to promote the iron-catalyzed Haber-Weiss reaction. After an overnight fast (8–10 h), and between 08:00 and 09:00 a.m., a total of one drop of capillary blood samples, approximately 10 μl, were drawn from the subject’s finger, and inserted into the prepared cuvette. The cuvette was then gently rocked several times until the sample was completely diluted. The sample was then placed in the square cuvette which contained the solid chromogen mixture, after closing the cuvette with its cap-on, it was shaken for 30 s until the reactive has dissolved. Then placed in the table centrifuge for 1 min (at room temperature), then placed in the reading cell.
Oxidants profile is measured by a colorimetric test based on the ability of transition metals, such as iron, to catalyze the breakdown of hydroperoxides into derivative radicals according to Fentons and Haber-Weiss’ reactions shown below:
![$$ \begin{array}{l}\mathrm{R}\hbox{-} \mathrm{O}\mathrm{O}\mathrm{H} + {\mathrm{Fe}}^{2+}\ \overset{\mathrm{A}}{\to}\kern0.5em \mathrm{R}\hbox{-} {\mathrm{O}}^{\cdotp }+{\mathrm{O}\mathrm{H}}^{-}+{\mathrm{Fe}}^{3+}\\ {}\mathrm{R}\hbox{-} \mathrm{O}\mathrm{O}\mathrm{H}+{\mathrm{Fe}}^{3+}\overset{\mathrm{B}}{\to}\kern0.5em \mathrm{R}\hbox{-} {\mathrm{O}\mathrm{O}}^{\cdotp } + {\mathrm{H}}^{+} + {\mathrm{Fe}}^{2+}\\ {}{\mathrm{RO}}^{\cdotp }+{\mathrm{RO}\mathrm{O}}^{\cdotp }+2{\mathrm{C}\mathrm{r}\mathrm{NH}}_2\ \overset{\mathrm{C}}{\to }\ {\mathrm{RO}}^{-}+{\mathrm{RO}\mathrm{O}}^{-}\\ {}+\left[\mathrm{C}\mathrm{r}-\mathrm{N}{\mathrm{H}}_2^{+\dot{c}}\right]\end{array} $$](/wp-content/uploads/2016/07/A5584_2015_166_Chapter_Equa.gif) Reference values are
Reference values are
160–200 = 1.22–1.58 mmol/l H2O2 – Excellent
201–250 = 1.59–1.97 mmol/l H2O2 – Very good-Good
251–310 = 1.98–2.17 mmol/l H2O2 – Good – Fair
311–500 = 2.18–2.36 mmol/l H2O2 – Bad
2.4 Statistical Analysis
A group comparison was assessed using a two-tailed Mann-Whitney U test (for abnormally distributed values) and a t-test (for normal distributed values). Data were expressed as means ± SD. Analyses were performed using the SPSS statistical package (ver. 12 for Windows). Differences were considered significant if p < 0.05.
Due to a small sample size, the effect of size was used to quantify differences in OS and NOx measures between the participants. The size-effect for each measure was computed as standardized mean differences in the score change between the two groups, namely, (d1−d2)/δp, where d1 and d2 denote the scores of the sedentary and active groups, respectively, and δp is the pooled standard deviation of the score difference. For the sake of completeness, despite the small sample size, we also conducted a two sample t-test and Mann-Whitney U test for the mean score differences (between the final groups).
3 Results
3.1 Level of Global Oxidative Stress
The CR3000 results for global oxidative stress (OS) in IDD participants were significantly higher in the sedentary group when compared with the active control group (Fig. 1).
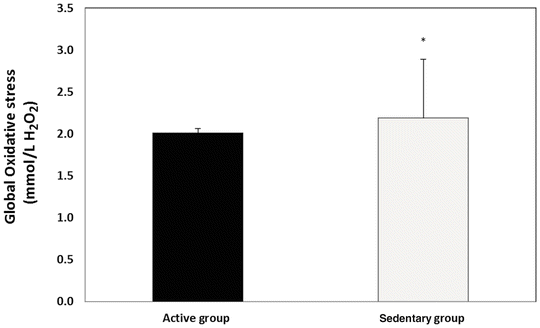
Fig. 1
Global oxidative stress in active vs. sedentary individuals with intellectual and developmental disabilities (IDD); *p < 0.05 vs. the active group
3.2 Level of Oxidized Metabolites of Nitrogen
Oxidized metabolites of nitrogen (NOx) were significantly higher in sedentary group when compared with active control group (Fig. 2). The mean NOx level of females and males in both groups were not statistically different. In the sedentary group, the level of OS correlated significantly with NOx level of the same participants at the same point of time (r = 0.78, p < 0.05). Insignificant correlation was found between NOx and OS in the active control group (r = 0.45).
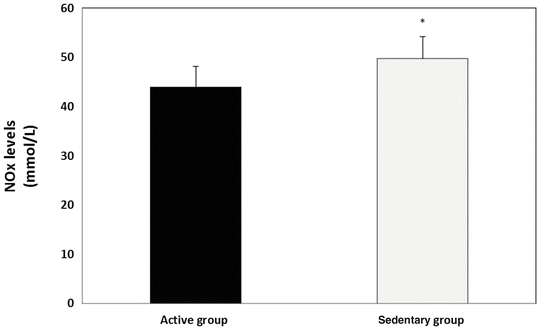
Fig. 2
NOx in active vs. sedentary individuals with intellectual and developmental disabilities (IDD); *p < 0.05 vs. the active group
4 Discussion
Early aging, chronic morbidities, and a sedentary lifestyle are more common among older adults with IDD. Higher levels of OS and NOx may promote various pathological processes and accelerated aging in older adults with IDD. The aim of the present study was to assess the OS and NOx levels in sera of active and sedentary older adults with IDD.
Despite research progress in the field of early-onset aging among IDD persons, our knowledge and understanding of what mechanisms are involved is still ambiguous. One of the main factors that attribute to accelerated aging, particularly among IDD persons, is a passive lifestyle or lack of physical activity. The consequences of physical activity on one hand, and physical inactivity on the other hand are widely known. Metabolic and physiologic adaptation to explain inactivity is generally supported by a model of metabolic homeostasis based on ‘use it or lose it’ assumption (Baskin et al. 2015). Following prolong inactive periods, certain biological pathways are induced such as apoptosis and inflammation, and often they are irreversible, especially in the aged (Russ and Lanza 2011).
< div class='tao-gold-member'>
Only gold members can continue reading. Log In or Register to continue
Stay updated, free articles. Join our Telegram channel

Full access? Get Clinical Tree


