The investigators recently validated a method of quantifying systemic–to–pulmonary arterial collateral flow using phase-contrast magnetic resonance imaging velocity mapping. Cross-sectional data suggest decreased collateral flow in patients with total cavopulmonary connections (TCPCs) compared with those with superior cavopulmonary connections (SCPCs). However, no studies have examined serial changes in collateral flow from SCPCs to TCPCs in the same patients. The aim of this study was to examine differences in collateral flow between patients with SCPCs and those with TCPCs. Collateral flow was quantified by 2 independent measures from 250 single-ventricle studies in 219 different patients (115 SCPC and 135 TCPC studies, 31 patients with both) and 18 controls, during routine studies using through-plane phase-contrast magnetic resonance imaging. Collateral flow was indexed to body surface area, aortic flow, and pulmonary venous flow. Regardless of indexing method, SCPC patients had significantly higher collateral flow than TCPC patients (1.64 ± 0.8 vs 1.03 ± 0.8 L/min/m 2 , p <0.001). In 31 patients who underwent serial examinations, collateral flow as a fraction of aortic flow increased early after TCPC completion. In TCPC patients, indexed collateral flow demonstrated a significant negative correlation with time from TCPC. In conclusion, SCPC and TCPC patients demonstrate substantial collateral flow, with SCPC patients having higher collateral flow than TCPC patients overall. On the basis of the paired subset analysis, collateral flow does not decrease in the short term after TCPC completion and trends toward an increase. In the long term, however, collateral flow decreases over time after TCPC completion.
Systemic-to-pulmonary collateral flow has been implicated as an important factor in the outcome of patients with cavopulmonary palliation for single-ventricle physiology, although considerable controversy exists over its role. Collateral flow has been difficult to study systematically because there has previously been no reliable way to measure it. Several groups, including our own, have recently demonstrated that collateral flow can be accurately measured in patients with superior cavopulmonary connections (SCPCs) using phase-contrast velocity mapping by magnetic resonance imaging (PC-MRI). Our group and others have used this method to demonstrate an association between collateral flow and longer hospitalization and duration of pleural effusions after Fontan completion. Here we report the largest series to date of single-ventricle patients in cross section as well as serially who underwent the previously described noninvasive method to test the hypotheses that collateral flow is different between SCPC and total cavopulmonary connection (TCPC) patients and represents a significant hemodynamic burden and that collateral flow regresses with increasing age in TCPC patients.
Methods
In a prospectively enrolled cohort, we investigated 285 consecutive studies in patients with SCPC or TCPC physiology at the Children’s Hospital of Philadelphia who underwent cardiac magnetic resonance (CMR) from April 2008 to December 2012. Thirty-five studies were excluded for significant accessory pulmonary blood flow (anterograde ventricle to pulmonary artery or residual aortopulmonary shunt flow), significant stent or coil artifacts that severely degraded the required PC-MRI sequences, or limited examinations that did not obtain complete PC-MRI. In the resultant 250 studies, 115 patients with SCPCs and 135 with TCPCs were included in the analysis. Thirty-one patients underwent CMR studies before and after TCPC completion, allowing a longitudinal paired analysis in a small subset. To establish a control group, we enrolled 18 2-ventricle patients (2 patients without heart disease, 8 with minor aortic arch anomalies and no prior surgery, and 8 postoperative 2-ventricle repair patients with no known residual shunts) who had complete pulmonary vein flow and branch pulmonary artery measurements. Eleven of these patients also underwent vena cava PC-MRI.
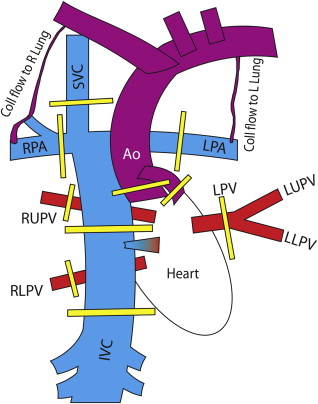
All patients underwent CMR imaging, consisting of routine anatomic assessment as well as comprehensive through-plane PC-MRI as part of their routine clinical evaluation or research protocol. Retrospectively gated, through-plane PC-MRI cines were performed in the aorta (native and/or neoaorta), superior vena cava (SVC) and inferior vena cava (IVC), right pulmonary artery (RPA) and left pulmonary artery (LPA), and right pulmonary vein (RPV) and left pulmonary vein (LPV). We previously described the typical protocol with parameters and positions used (see Figure 1 ). When 2 outflows were present (aorta and neoaorta), they were measured separately and summed for the total aortic flow. When possible (based on whether all the pulmonary veins on 1 side formed a common vein of sufficient length), all the pulmonary veins on 1 side were measured in 1 acquisition. In a subset of patients, descending aortic flow at the level of the diaphragm was measured and compared with inferior vena cava flow. PC-MRI sequences were analyzed using Argus flow analysis software on a Leonardo workstation (Siemens Medical Solutions, Malvern, Pennsylvania) to obtain the aortic, SVC, IVC, RPA, LPA, RPV, and LPV flows (Q). All contours and values were reviewed by a single observer (KKW). To account for baseline offset on PC-MRI, a static reference region was contoured on all aortic PC-MRI studies as close to the vessel of interest as possible. If correction made a >10% difference in the aortic flow, the corrected value was used, and static reference regions were checked on the remaining PC-MRI sequences. The following calculations were then made for each patient:
where Q coll-syst and Q coll-pulm represent the estimated collateral flow by comparing supply and return of the systemic and pulmonary systems, respectively; Q coll is the mean estimator of collateral flow; Q P and Q S are the total pulmonary venous and systemic venous blood flows, respectively; Q VR is the total venous return to the heart and should equal the aortic flow leaving the heart; and Q RL is the right-to-left shunt, which is equivalent to IVC flow in an SCPC and fenestration flow in a Fontan. In 2 SCPC patients in whom there was a left SVC to coronary sinus, the left SVC was included in the IVC flow for calculation purposes because the left SVC flow represented systemic venous return not connected directly to the pulmonary arterial system.

Collateral flow was normalized to (1) body surface area to obtain an indexed flow, (2) aortic flow as a percentage of the entire cardiac output, and (3) total pulmonary vein flow (Q RPV + Q LPV ) to determine the percentage of pulmonary flow from collateral flow. As a further check of internal consistency, total venous return to the heart was calculated ( equation 6 ) to compare to the aortic flow in the SCPC patients.
Ventricular volumes (indexed to body surface area) were also obtained when available. Estimated indexed collateral flow was compared with indexed end-diastolic ventricular volumes by linear regression.
The 2 methods of calculating collateral flow, as well as aortic outflow and venous return to the heart, were tested for internal consistency using linear regression, Bland-Altman analysis, and intraclass correlation. Collateral flow parameters among control, TCPC, and SCPC patients were compared initially using single-factor analysis of variance. When a significant difference across groups was detected by analysis of variance, individual pairwise comparisons were tested using unpaired Student’s t tests with Bonferroni correction for multiple comparisons. For the 31 patients who underwent SCPC and TCPC examinations, their SCPC and TCPC examinations were compared using paired Student’s t tests. The authors had full access to the data and take responsibility for its integrity. All authors have read and agree to the manuscript as written. The study was approved by the institutional review board, and informed consent was obtained.
Results
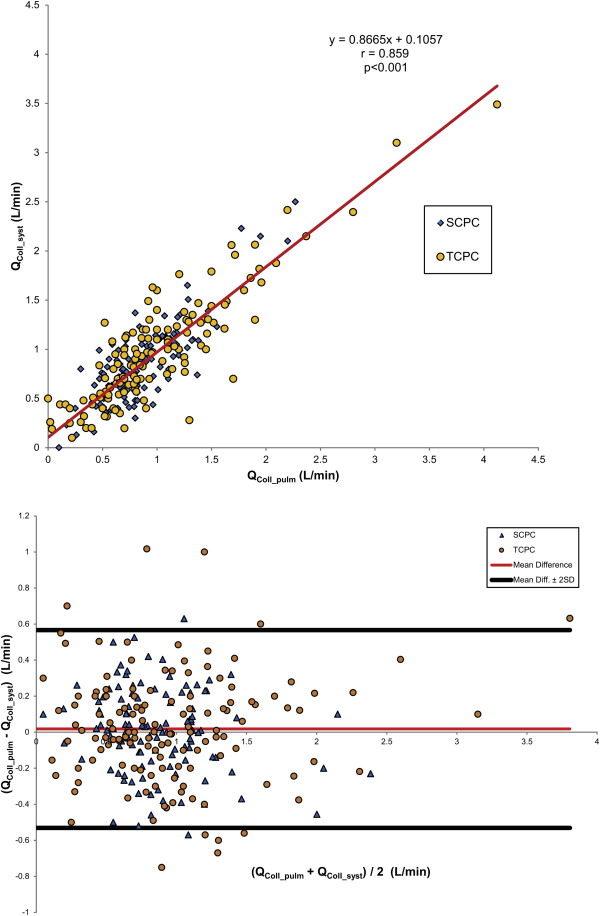
A summary of demographics is listed in Table 1 . Excellent agreement was demonstrated between Q coll-syst and Q coll-pulm for SCPC and TCPC, with negligible bias at 0.02 L/min, a pooled 2-SD range of −0.6 to 0.6 L/min ( Figure 2 ), and an intraclass correlation coefficient of 0.84 (p <0.001). Table 2 lists the comparison among SCPC, TCPC, and controls. Whether collateral flow was normalized to body surface area, aortic flow, or total pulmonary flow, SCPC patients on average demonstrated significantly higher collateral flow than TCPC patients. The pulmonary-to-systemic flow ratio (Q P /Q S ; see equations 4 and 5 ) was significantly higher for TCPC than for SCPC. This appeared to be secondary to a significant decrease in Q S , as Q P was not significantly different between SCPC and TCPC patients.
| SCPC | TCPC | |
|---|---|---|
| n | 115 | 135 |
| Age at SCPC (years) | 0.51±0.21 | 0.76±0.96 |
| Age at TCPC (years) | N/A | 3.2±2.4 |
| Time from SCPC | 2.1±1.2 | 9.0±6.5 |
| Time from TCPC | N/A | 8.9±8.2 |
| Right Ventricle morphology | 79 (69%) | 76 (56%) |
| Left Ventricle morphology | 29 (25%) | 54 (40%) |
| Mixed morphology | 7 (6%) | 5 (4%) |
| Hypoplastic Left Heart Syndrome | 56 (49%) | 47 (35%) |
| Heterotaxy Syndrome | 16 (14%) | 9 (7%) |
| Tricuspid atresia | 11 (10%) | 25 (19%) |
| Double Inlet Left Ventricle | 7 (6%) | 11 (8%) |
| Pulmonary atresia with intact ventricular septum | 5 (4%) | 1 (1%) |

| SCPC | TCPC | p-value SCPC vs. TCPC | Controls | p-value SCPC vs. Ctrl | p-value TCPC vs. Ctrl | |
|---|---|---|---|---|---|---|
| n | 115 | 135 | 18 | |||
| Age (years) | 2.6±1.2 | 12.2±8.8 | <0.001 | 10.1±7.4 | <0.001 | 1.0 |
| Body surface area (m 2 ) | 0.53±0.10 | 1.16±0.51 | <0.001 | 1.05±0.49 | <0.001 | 1.0 |
| Q Ao (L/min/m 2 ) | 4.85±1.1 | 3.61±1.0 | <0.001 | 3.9±0.9 | 0.007 | 1.0 |
| Q coll (L/min/m 2 ) | 1.64±0.8 | 1.03±0.8 | <0.001 | 0.21±0.27 | <0.001 | <0.001 |
| 100xQ coll /Q Ao (%) | 34%±12% | 26%±15% | <0.001 | 5%±6 % | <0.001 | <0.001 |
| 100xQ coll /Q P (%) | 48%±17% | 29%±17% | <0.001 | 5%±5 % | <0.001 | <0.001 |
| Q P (L/min/m 2 ) | 3.4±0.9 | 3.3±0.8 | 1.0 | 4.1±1.0 | 0.006 | 0.005 |
| Q S (L/min/m 2 ) | 3.2±0.9 | 2.6±0.6 | <0.001 | 3.7±0.8 | 0.11 | <0.001 |
| Q PA (L/min/m 2 ) | 1.7±0.6 | 2.3±0.6 | <0.001 | 3.9±0.9 | <0.001 | <0.001 |
| Q P / Q S | 1.10±0.3 | 1.31±0.40 | <0.001 | 1.13±0.2 | 1.0 | 0.20 |
Stay updated, free articles. Join our Telegram channel

Full access? Get Clinical Tree


