Spirometry: Dynamic Lung Volumes
Spirometry is used to measure the rate at which the lung changes volume during forced breathing maneuvers. The most commonly performed test uses the forced expiratory vital capacity (FVC) maneuver, in which the subject inhales maximally and then exhales as rapidly and completely as possible. Of all the tests considered in this book, the FVC test is both the simplest and the most important. Generally, it provides most of the information that is to be obtained from pulmonary function testing. It behooves the reader to have a thorough understanding of this procedure.
2A. Spirograms and Flow-Volume Curve
The two methods of recording the FVC test are shown in Figure 2-1. In Figure 2-1A, the subject blows into a spirometer that records the volume exhaled, which is plotted as a function of time, the solid line. This is the classic spirogram showing the time course of a 4-L FVC. Two of the most common measurements made from this curve are the forced expiratory volume in 1 second (FEV1) and the average forced expiratory flow (FEF) rate over the middle 50% of the FVC (FEF25-75). These are discussed later in this chapter.
The FVC test can also be plotted as a flow-volume (FV) curve, as in Figure 2-1B. The subject again exhales forcefully into the spirometer through a flowmeter that measures the flow rate (in liters per second) at which the subject exhales. The volume and the rapidity at which the volume is exhaled (flow in liters per second) are plotted as the FV curve. Several of the common measurements made from this curve are discussed later in this chapter.
The two curves reflect the same data, and a computerized spirometer can easily plot both curves with the subject exhaling through either a flowmeter or a volume recorder. Integration of flow provides volume, which, in turn, can be plotted as a function of time, and all the measurements shown in Figure 2-1 are also readily computed. Conversely, the volume signal can be differentiated with respect to time to determine flow. In our experience, the FV representation (Fig. 2-1B) is the easiest to interpret and the most informative. Therefore, we will use this representation almost exclusively.
Caution: It is extremely important that the subject be instructed and coached to perform the test properly. Expiration must be after a maximal inhalation, initiated as rapidly as possible, and continued with maximal effort until no more air can be expelled. “Good” and “bad” efforts are shown later on page 13 in Figure 2-6.
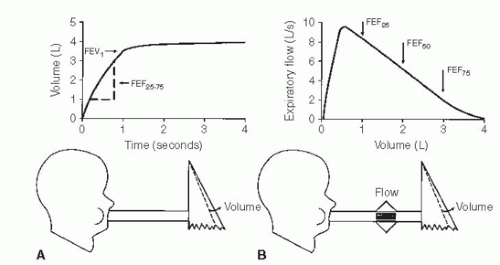 FIG. 2-1. The two ways to record the forced expiratory vital capacity (FVC) maneuver. A. Volume recorded as a function of time, the spirogram. FEV1, forced expiratory volume in 1 second; FEF25-75, average forced expiratory flow rate over the middle 50% of the FVC. B. Flow recorded as a function of volume exhaled, the flow-volume curve. FEF25(50,75), forced expiratory flow after 25% (50%, 75%) of the FVC has been exhaled. |
2B. Value of the Forced Expiratory Vital Capacity Test
The FVC test is the most important pulmonary function test for the following reason: For any given individual during expiration, there is a unique limit to the maximal flow that can be reached at any lung volume. This limit is reached with moderate expiratory efforts, and increasing the force used during expiration does not increase the flow. In Figure 2-1B, consider the maximal FV curve obtained from a normal subject during the FVC test. Once peak flow has been achieved, the rest of the curve defines the maximal flow that can be achieved at any lung volume. Thus, at FEF after 50% of the vital capacity has been exhaled (FEF50), the subject cannot exceed a flow of 5.2 L/s regardless of how hard he or she tries. Note that the maximal flow that can be achieved decreases in an orderly fashion as more air is exhaled (i.e., as lung volume decreases) until at residual volume (4 L) no more air can be exhaled. The FVC test is powerful because there is a limit to maximal expiratory flow at all lung volumes after the first 10% to 15% of FVC has been exhaled. Each individual has a unique maximal expiratory FV curve. Because this curve defines a limit to flow, the curve is highly reproducible in a given subject. Most important, maximal flow is very sensitive to the most common diseases that affect the lung.
The basic physics and aerodynamics causing this flow-limiting behavior are not explained here. However, the concepts are illustrated in the simple lung model in Figure 2-2.
Figure 2-2A shows the lung at full inflation before a forced expiration. Figure 2-2B shows the lung during a forced expiration. As volume decreases, dynamic compression of the airway produces a critical narrowing that develops in the trachea and produces limitation of flow. As expiration continues
and lung volume decreases even more, the narrowing migrates distally into the main bronchi and beyond. Three features of the model determine the maximal expiratory flow of the lung at any given lung volume: lung elasticity (e), which drives the flow and holds the airways open; size of the airways (f); and resistance to flow along these airways.
and lung volume decreases even more, the narrowing migrates distally into the main bronchi and beyond. Three features of the model determine the maximal expiratory flow of the lung at any given lung volume: lung elasticity (e), which drives the flow and holds the airways open; size of the airways (f); and resistance to flow along these airways.
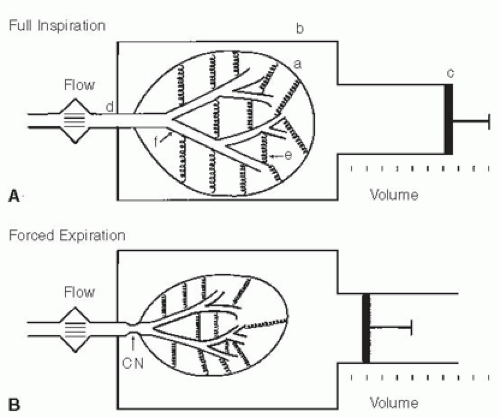 FIG. 2-2. Simple lung model at full inflation (A) and during a forced expiration (B). The lung (a) is contained in a thorax (b) whose volume can be changed by the piston (c). Air exits from the lung via the trachea (d). The lung has elasticity (e), which both drives the flow and plays a role in holding the compliant bronchi (f) open. Critical narrowing (CN) occurs during the FVC maneuver. |
The great value of the FVC test is that it is very sensitive to diseases that alter the lung’s mechanical properties:
In chronic obstructive pulmonary disease, emphysema causes a loss of lung tissue (alveoli are destroyed). This loss results in a loss of elastic recoil pressure, which is the driving pressure for maximal expiratory flow. Airways are narrowed because of loss of tethering of lung tissue. This results in increased flow resistance and decreased maximal expiratory flow.
In chronic bronchitis, both mucosal thickening and thick secretions in the airways lead to airway narrowing, increased resistance to flow, and decreased maximal flow.
In asthma, the airways are narrowed as a result of bronchoconstriction and mucosal inflammation and edema. This narrowing increases resistance and decreases maximal flow.
In pulmonary fibrosis, the increased tissue elasticity may distend the airways and increase maximal flow, even though lung volume is reduced.
2C. Normal Values
Tables and equations are used to predict the normal values of the measurements to be discussed. The best values have been obtained from nonsmoking, normal subjects. The prediction equations we use in our laboratory are listed in the Appendix. The important prediction variables are the size, sex, and age of the subject. Certain races, African American and Asian, for example, require race-specific values. Size is best estimated with body height. The taller the subject, the larger the lung and its airways, and thus maximal flows are higher. Women have smaller lungs than men of a given height. With aging, lung elasticity is lost, and thus airways are smaller and flows are lower. The inherent variability in normal predictive values must be kept in mind, however (as in the bell-shaped normal distribution curve of statistics). It is almost never known at what point in the normal distribution a given subject starts. For example, lung disease can develop in people with initially above-average lung volumes and flows. Despite a reduction from their initial baseline, they may still have values within the normal range of a population.
PEARL: Body height should not be used to estimate normal values for a subject with kyphoscoliosis. Why? Because the decreased height in such a subject will lead to a gross underestimation of the normal lung volume and flows. Rather, the patient’s arm span should be measured and used instead of height in the reference equations. In a 40-year-old man with kyphoscoliosis, vital capacity is predicted to be 2.78 L if his height of 147 cm is used, but the correct expected value of 5.18 L is predicted if his arm span of 178 cm is used—a 54% difference. The same principle applies to flow predictions.
2D. Forced Expiratory Vital Capacity
The FVC is the volume expired during the FVC test; in Figure 2-1 the FVC is 4.0 L. Many abnormalities can cause a decrease in the FVC.
PEARL: To our knowledge, only one disorder, acromegaly, causes an abnormal increase in the FVC. The results of other tests of lung function are usually normal in this condition. However, persons with acromegaly are at increased risk for development of obstructive sleep apnea as a result of hypertrophy of the soft tissues of the upper airway.
Figure 2-3 presents a logical approach to considering possible causes of a decrease in FVC:
The problem may be with the lung itself. There may have been a resectional surgical procedure or areas of collapse. Various other conditions can render the lung less expandable, such as fibrosis, congestive heart failure, and thickened pleura. Obstructive lung diseases may reduce the FVC by limiting deflation of the lung (Fig. 2-3).
The problem may be in the pleural cavity, such as an enlarged heart, pleural fluid, or a tumor encroaching on the lung.
Another possibility is restriction of the chest wall. The lung cannot inflate and deflate normally if the motion of the chest wall (which includes its abdominal components) is restricted.
Inflation and deflation of the system require normal function of the respiratory muscles, primarily the diaphragm, the intercostal muscles, and the abdominal muscles.
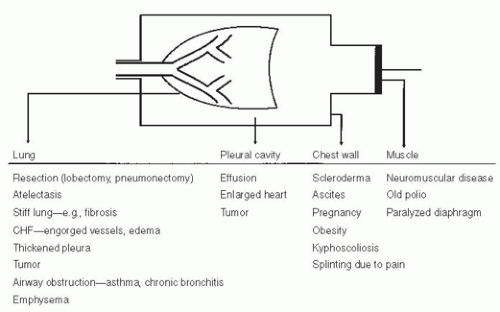 FIG. 2-3. Various conditions that can restrict the forced expiratory vital capacity. CHF, congestive heart failure. |
If the four possibilities listed are considered (lung, pleura, chest wall, and muscles), the cause(s) of decreased FVC is usually determined. Of course, combinations of conditions occur, such as the enlarged failing heart with engorgement of the pulmonary vessels and pleural effusions. It should be remembered that the FVC is a maximally rapid expiratory vital capacity. The vital capacity may be larger when measured at slow flow rates; this situation is discussed in Chapter 3.
Two terms are frequently used in the interpretation of pulmonary function tests. One is an obstructive defect. This is a lung disease that causes a decrease in maximal expiratory flow so that rapid emptying of the lungs is not possible; conditions such as emphysema, chronic bronchitis, and asthma cause this. Frequently, an associated decrease in the FVC occurs. A restrictive defect implies that lung volume, in this case the FVC, is reduced by any of the processes listed in Figure 2-3, except those causing obstruction.
Caution: In a restrictive process, the total lung capacity (TLC) will be less than normal (see Chapter 3).
Earlier in the chapter, it was noted that most alterations in lung mechanics lead to decreased maximal expiratory flows. Low expiratory flows due to airway obstruction are the hallmark of chronic bronchitis, emphysema,
and asthma. The measurements commonly obtained to quantify expiratory obstruction are discussed below.
and asthma. The measurements commonly obtained to quantify expiratory obstruction are discussed below.
2E. Forced Expiratory Volume in 1 Second
The FEV1 is the most reproducible, most commonly obtained, and possibly most useful measurement. It is the volume of air exhaled in the first second of the FVC test. The normal value depends on the patient’s size, age, sex, and race, just as does the FVC. Figure 2-4A and B shows the FVC and FEV1 from two normal subjects; the larger subject (A) has the larger FVC and FEV1.
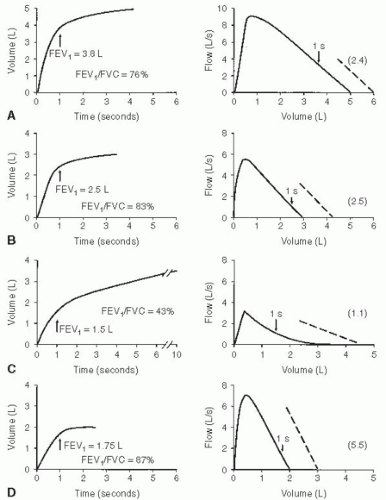 FIG. 2-4. Typical spirograms and flow-volume curves during forced expiration. A and B. Normal subjects of different sizes. C. Patient with severe airway obstruction. D. Values typical of a pulmonary restrictive process. The arrows indicate the forced expiratory volume in 1 second (FEV1). The ratios of FEV1 to forced expiratory vital capacity (FEV1/FVC) and the slopes of the flow-volume curves (dashed lines) are also shown with their values in the parentheses. |
When flow rates are slowed by airway obstruction, as in emphysema, the FEV1 is decreased by an amount that reflects the severity of the disease. The FVC may also be reduced, although usually to a lesser degree. Figure 2-4C shows a severe degree of obstruction. The FEV1 is easily identified directly from the spirogram. A 1-second mark can be added to the FV curve to identify the FEV1, as shown in the figure. The common conditions producing expiratory slowing or obstruction are chronic bronchitis, emphysema, and asthma.
In Figure 2-4D, the FEV1 is reduced because of a restrictive defect, such as pulmonary fibrosis. A logical question is, “How can I tell whether the FEV1 is reduced as a result of airway obstruction or a restrictive process?” This question is considered next.
2F. FEV1/FVC: Forced Expiratory Volume in 1 Second/Forced Expiratory Vital Capacity Ratio
The FEV1/FVC ratio is generally expressed as a percentage. The amount exhaled during the first second is a fairly constant fraction of the FVC, irrespective of lung size. In the normal adult, the ratio ranges from 75% to 85%, but it decreases somewhat with aging. Children have high flows for their size, and thus, their ratios are higher, up to 90%.
The significance of this ratio is twofold. First, it aids in quickly identifying persons with airway obstruction in whom the FVC is reduced. For example, in Figure 2-4C, the FEV1/FVC is very low at 43%, indicating that the low FVC is due to airway obstruction and not pulmonary restriction. Second, the ratio is valuable for identifying the cause of a low FEV1. In pulmonary restriction (without any associated obstruction), the FEV1 and FVC are decreased proportionally; hence, the ratio is in the normal range, as in the case of fibrosis in Figure 2-4D, in which it is 87%. Indeed, in some cases of pulmonary fibrosis, the ratio may increase even more because of the increased elastic recoil of such a lung.
Thus, in regard to the question of how to determine whether airway obstruction or a restrictive process is causing a reduced FEV1, the answer is to check the FEV1/FVC ratio. A low FEV1 with a normal ratio usually indicates a restrictive process, whereas a low FEV1 and a decreased ratio signify a predominantly obstructive process.
In severe obstructive lung disease near the end of a forced expiration, the flows may be very low, barely perceptible. Continuation of the forced expiration can be very tiring and uncomfortable. To avoid patient fatigue, one can substitute the volume expired in 6 seconds, the FEV6, for the FVC in the ratio. Normal values for FEV1/FEV6 were developed in the third National Health and Nutrition Examination Survey (NHANES III).1
Recently,2 an international group has recommended that the largest vital capacity measured during a study be used in the denominator of the ratio. In most cases this will be the FVC, but on occasion it will be a slow vital capacity (SVC). When the SVC exceeds the FVC, a subject with a low normal FEV1/FVC may be moved into the mild obstructive category. The impact and value of this change are yet to be determined (see Section 14D).
Stay updated, free articles. Join our Telegram channel

Full access? Get Clinical Tree


