Chapter 2
Spirometry
Spirometry is probably the most commonly performed lung function test. Spirometry measures flow and volume components of ventilatory function and is measured under relaxed or forced conditions. Forced vital capacity (FVC) manoeuvres provide information regarding dynamic changes in lung volumes, whereas relaxed (slow vital capacity, SVC, or vital capacity, VC) manoeuvres provide information regarding volumes under relaxed, resting conditions.
This chapter focuses primarily on FVC manoeuvres, although SVC manoeuvres are used in the assessment of ventilatory function, static lung volumes and diaphragm function, and are mentioned throughout the book.
Test quality
The validity of spirometry results is dependent on the quality of each effort. The guidelines for spirometry state that an optimal quality result consists of a minimum of three acceptable efforts, and of these efforts, the highest and second highest FEV1 and the highest and second highest FVC are within 150 mL (1). Test acceptability has many components, the basics of which are explained in Figure 2.1. A suboptimal quality test has the potential to affect the measured parameters of spirometry and hence impact negatively on interpretation (Figure 2.2).
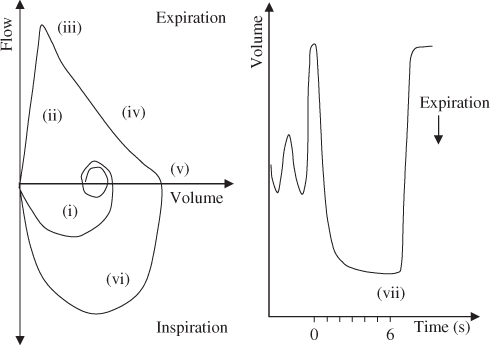
Figure 2.1 Following a maximal inspiration to total lung capacity (TLC) (i), there is a maximal, rapid exhalation, without hesitation (ii) defined by a sharp peak (iii), followed by a smooth continuous curve (iv) to a point of zero flow (or near zero flow) on the flow–volume curve (v). The inspiratory loop from residual volume (RV) back to TLC is rapid and of maximal effort (vi). The end of test criteria (no volume change for at least 1 s and ‘tried to blow’ for at least 6 s [3 s for children]) are best identified from the volume–time curve (vii). The peak expiratory flow (PEF) is useful for assessing the initial (blast) effort (iii).
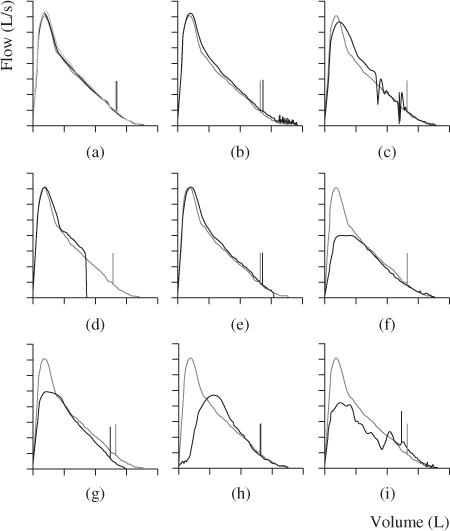
Figure 2.2 A series of expiratory flow–volume curves depicting various poor quality manoeuvres overlayed with a good quality manoeuvre. The short vertical line on the curve represents the FEV1, and the FVC is represented by the point at which the curve touches the volume axis. (a) represents a good quality FVC manoeuvre; (b) and (c) represent FVC manoeuvres with cough, though in (b) the cough probably does not affect the validity of the test result as it occurs after 1 s, while in (c), the cough occurs before the first second and will impact on results; (d) and (e) represent glottic closure that affect FEV1 (d only) and FVC; (f) represents a submaximal effort; (g) represents a poor lip seal and leak; (h) represents a slow start to the test and (i) represents tongue obstruction in the mouthpiece. Note how each of the suboptimal quality manoeuvres may affect the FEV1 and FVC measurements.
Interpretation strategy
The primary parameters used in the interpretation of spirometry, in order, are as follows:
- FEV1/(F)VC—the ratio of FEV1 to FVC or VC
- (F)VC—the FVC or VC
- FEV1—the forced expiratory volume in 1 s
Note: (F)VC means that either FVC or VC can be used. If both FVC and VC are measured in a test, then the largest VC is used. The largest VC can be taken from spirometry (FVC or SVC), TLCO (VI) or static lung volume (VC) measurements.
Limits of normal
Lung pathology almost exclusively results in abnormally low results for parameters of spirometry used in interpretation. Hence, only a lower limit of normal is used and this is set at −1.64 z-scores.
Ventilatory defects can be broadly classified into obstructive, restrictive, mixed obstructive/restrictive defects and non-specific ventilatory patterns (Table 2.1) (2, 3). You will note that spirometry parameters alone are used to define results that are within normal limits or obstructive defects. Total lung capacity (TLC) measured by static lung volumes, however, is required for identifying restriction, mixed obstructive/restrictive defects and non-specific ventilatory patterns in addition to spirometry parameters. This is because (F)VC can be reduced in spirometry due to airflow limitation or reduced lung size (Figure 2.3) and, without measuring TLC, the cause of the reduced (F)VC cannot be determined (4).
Table 2.1 Classification of ventilatory function patterns.
| Parameter | Ventilatory pattern |
| FEV1/(F)VC, (F)VC, FEV1 > LLN | Within normal limits |
| FEV1/(F)VC < LLN | Obstructive ventilatory defect |
| FEV1/(F)VC > LLN and TLCa < LLN | Restrictive ventilatory defect |
| FEV1/(F)VC and TLC a < LLN | Mixed obstructive/restrictive ventilatory defect |
| FEV1/(F)VC > LLN, TLCa > LLN, (F)VC < LLN and/or FEV1 < LLN | Non-specific ventilatory pattern |
a TLC is measured via static lung volumes.
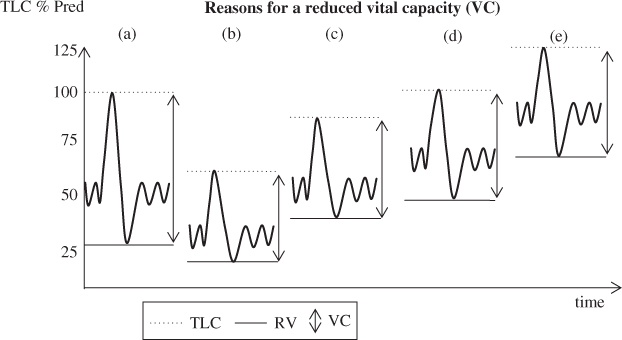
Figure 2.3 Depiction of (a) a normal trace with RV ∼25% of the TLC and (b) a restrictive ventilatory pattern. RV is reduced in proportion to the reduction in TLC. VC is reduced as a result of the reduced TLC; (c) depiction of suboptimal effort or possible neuromuscular weakness. TLC is reduced and RV is elevated, resulting in a reduced VC. FRC is within the normal range; (d) depiction of obstruction with gas trapping. TLC is within the normal range but RV is elevated, with the VC reduced as a result of the elevated RV; (e) depiction of gas trapping and hyperinflation of TLC. RV is elevated disproportionately to the elevated TLC, resulting in a reduced VC.
Obstructive ventilatory defects are primarily related to pathologies that result in airway narrowing (Table 2.2). Restrictive ventilatory defects (reduced lung volume) may result from pathologies intrinsic or extrinsic to the lungs (Table 2.2). It is also possible that individuals may present with concomitant obstruction and restriction, resulting in a mixed obstructive/ restrictive pattern. The non-specific pattern is described in more detail in Chapter 3, but is, as its name suggests, an abnormal pattern that does not fit the other defined patterns of abnormality.
Table 2.2 Pathologies that are reflected by obstructive or possible restrictive defects on spirometry.
| Obstruction | Restrictiona |
Any pathology that leads to narrowing of the airways, for example:
| Diseases of the interstitium (e.g. pulmonary fibrosis) that result in reduced compliance of the lung Pulmonary congestion (e.g. oedema) Disorders of chest wall (e.g. kyphoscoliosis) Neuromuscular disease affecting respiratory muscles Lobectomy or pneumonectomy Pleural effusion Morbid obesity |
a Note: Static lung volumes are required to confirm restriction.
The steps in interpretation using spirometry alone are shown in the flow diagram in Figure 2.4. The final level of the diagram gives an example of a written technical interpretation.
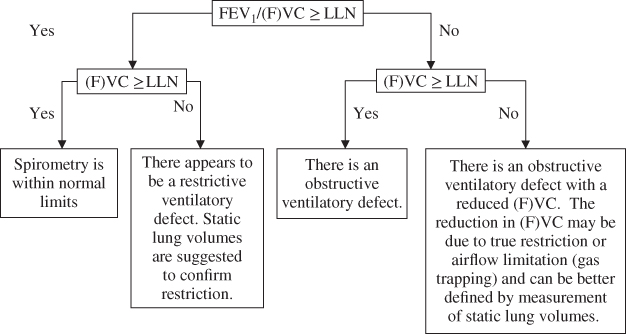
Figure 2.4 Interpretation strategy using spirometry results alone.
Spirometry before and after bronchodilator (BD)
Baseline spirometry (also referred to as control or pre-bronchodilator (pre-BD) spirometry) is generally used as the basis for interpretation of spirometry.
Determining normality using post-bronchodilator spirometry should only be performed if no baseline data are recorded and this should be clearly stated. For example, There is an obstructive ventilatory defect on post-bronchodilator spirometry or Post-bronchodilator spirometry shows an obstructive ventilatory defect.
- After classifying the pattern of the baseline spirometry result, the bronchodilator response can be assessed.
Assessing bronchodilator response
- A significant response to inhaled bronchodilator is defined as an increase ≥12% and ≥200 mL in either FEV1 or FVC between the baseline and post-bronchodilator results (2).
- When there is a significant response to inhaled bronchodilator:
- If spirometry returns to within normal limits (FEV1/(F)VC, FEV1 and (F)VC within the normal range), then there is complete reversibility of airflow limitation.
- If obstruction remains apparent after inhaled bronchodilator, then there is incomplete reversibility of airflow limitation.
- If spirometry returns to within normal limits (FEV1/(F)VC, FEV1 and (F)VC within the normal range), then there is complete reversibility of airflow limitation.
- When there is a significant response to inhaled bronchodilator:
- Also consider responses that are insignificant by definition, but return spirometry to within normal limits and whether or not this is clinically important information.
Analysing the shape of the flow–volume curve
The shape of the flow–volume curve can provide information regarding the type of ventilatory defect (Figure 2.5). Be careful using the flow–volume curve alone for identifying obstruction. The shape of the expiratory limb changes with age, and in an older population it may have a concave appearance similar to that seen in obstruction. Use the values in addition to the shape to identify the pattern seen. Also see Special Cases of Spirometry Interpretation Upper Airway Obstruction following for identification of upper airway obstruction using flow–volume curves.
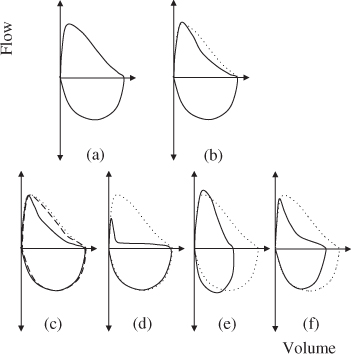
Figure 2.5 The dotted line for all curves represents a normal flow–volume curve in a young adult. (a) and (b) depict typical flow–volume curve shapes for spirometry within normal limits for a young adult and older person, respectively. Note that the expiratory limb of (b) has some concavity despite the result being within normal limits. (c) shows an example of airway obstruction with almost complete reversibility. The baseline curve (solid line) has concavity, typical of airflow obstruction. The post-bronchodilator curve (dashed line) has returned to close to the ‘normal’ curve (dotted). (d) depicts significant airflow obstruction. (e) represents the pattern often seen with restriction. The curve appears to be compressed along the volume axis, but the expiratory limb does not appear to have any concavity. (f) portrays an obstructive pattern. Note also that the volume appears to be reduced. This pattern may represent obstruction with a reduced FVC due to gas trapping or may represent a mixed obstructive/restrictive ventilatory pattern. Measurement of static lung volumes are required for determination.
Comparisons to previous results
- Use FEV1 and FVC to monitor change over time.
- A change of ≥12% and ≥200 mL in either direction is likely to represent a real change over time (2).
- As explained in Chapter 1, when spirometry is measured at baseline and post-bronchodilator, comparisons over time should be made between post-bronchodilator results.
Special cases of spirometry interpretation
Upper airway obstruction
Variable or fixed upper airway obstruction is most easily identified by the shape of the flow–volume curve (also known as flow–volume loop) (Figure 2.6). Although not specific, parameters such as the FIF50/FEF50 have been suggested to be helpful (2).
- Variable intrathoracic upper airway obstruction is characterised by flattening of the expiratory limb of the flow–volume curve (Figure 2.6b,c). FIF50/FEF50 > 1 (2).
- Variable extrathoracic upper airway obstruction is characterised by a flattening of the inspiratory limb of the flow–volume curve (Figure 2.6f). FIF50/FEF50 < 1 (2).
- Fixed upper airway obstruction results in flattening of both the inspiratory and expiratory limbs (Figure 2.6d,e). FIF50/FEF50 ∼ 1 (2).
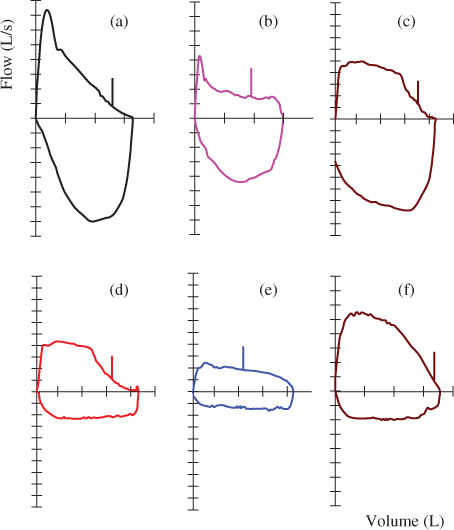
Figure 2.6 Flow–volume curve (a) depicts a normal curve shape; curves (b) and (c) are examples of variable intrathoracic upper airway obstruction; curves (d) and (e) depict examples of fixed upper airway obstruction of varying degrees; and curve (f) is an example of a variable extrathoracic upper airway obstruction.
Note:
- FEV1, FVC and FEV1/FVC values may not be affected in all cases of intrathoracic airway obstruction (see Case 12). This highlights the importance of reviewing the flow–volume curves as part of the interpretation strategy.
- In order to detect extrathoracic upper airway obstruction, a high-quality inspiratory portion of the flow–volume curve is essential. The inspiratory manoeuvre is entirely effort dependent and false-positive findings of extrathoracic upper airway obstruction can occur as a result of suboptimal effort.
Hyper-reactive airways
In a small number of individuals, the act of performing forced expiratory manoeuvres may result in progressive airways obstruction (see Case 11). The typical pattern seen with hyper-reactive airways presents as follows:
- The first effort is often within normal limits.
- The FEV1 falls with subsequent consecutive efforts (as opposed to variable FEV1 where changes may occur in both directions).
- Often the repeatability criteria are not met.
- Following bronchodilator, the FEV1 may or may not return to the best baseline level, but generally post-bronchodilator FEV1 is repeatable.
The test operator plays an important role in identifying and noting the pattern in the technical comments. It is also important that the lowest FEV1 obtained is documented in the technical comments for reporting. The reporter should look at the raw data to confirm the pattern.
Examples of interpretation of spirometry
Spirometry interpretation is performed using the following steps as applicable:
- Check for requirements of cautionary statements related to the following:
- Reference values (are values appropriate for this subject? See Chapter 1 for details).
- Quality of test (read technical comments, check raw data if required).
- Reference values (are values appropriate for this subject? See Chapter 1 for details).
- Read clinical notes
- Follow flow chart of Figure 2.4
- Assess loop shape
- Assess response to inhaled bronchodilator
- Write technical interpretation
- Compare results to previous
- Put results into clinical context.

Full access? Get Clinical Tree


