2 Special Tools in Cardiac Evaluation
A number of special tools are available to the cardiologist in the evaluation of cardiac patients. Noncardiologists have access to some noninvasive tools, such as echocardiography, exercise stress test, and ambulatory ECG (e.g., Holter monitor). Magnetic resonance imaging (MRI) and computed tomography (CT) are other noninvasive tools that have become popular in recent years. Cardiac catheterization and angiocardiography are invasive tests. Although catheter intervention procedures are not diagnostic, they are included here because they are usually performed with cardiac catheterization.
I. ECHOCARDIOGRAPHY
A. M-MODE ECHOCARDIOGRAPHY
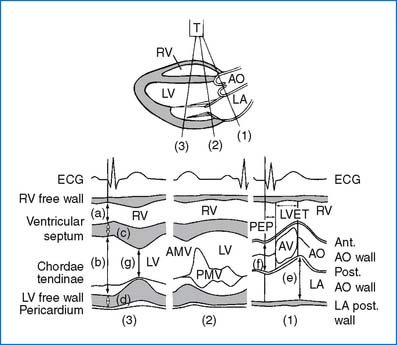
Figure 2-1 shows three important structures of the left side of the heart that are imaged using the M-mode echo. The following are some applications of the M-mode echo.
• Measurement of the dimensions of cardiac chambers and vessels, thickness of the ventricular septum and free walls
• LV systolic function (e.g., fractional shortening, ejection fraction)
• Study of the motion of the cardiac valves (e.g., MVP, MS) and the interventricular septum
1. Normal M-mode echo values. The dimensions of the cardiac chambers and the aorta are measured during diastole, coincident with the onset of the QRS complex; the LA dimension and LV systolic dimension are exceptions (see Fig. 2-1). Table 2-1 shows normal M-mode values of cardiac chamber size, wall thickness, and aortic size, according to the patient’s weight. More detailed normal values of chamber dimensions and LV wall thickness by stand-alone M-mode echo are shown according to body surface area in Appendix D (Table D-1). M-mode echo measurement of the aortic annulus, LA, and LV dimensions as part of a two-dimensional study are shown by age in Table D-2. Table D-3 shows M-mode echo measurements of the LA and LV dimensions by height.
2. Left ventricular systolic function
FS(%) ≡ Dd − Ds/Dd × 100,
EF(%) ≡ (Dd)3 − (Ds)3/(Dd)3 × 100,
B. TWO-DIMENSIONAL ECHOCARDIOGRAPHY
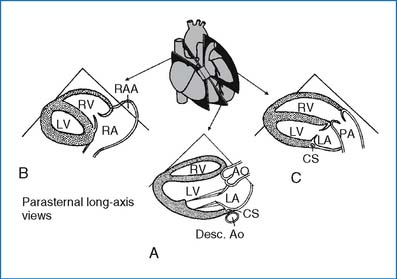
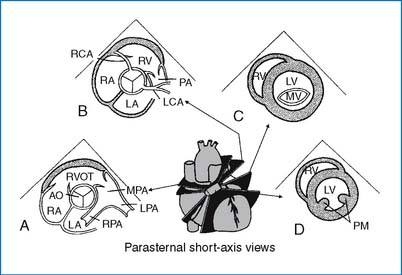
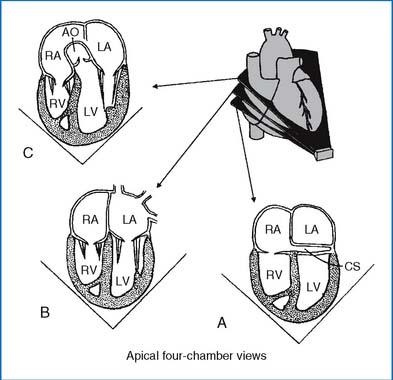
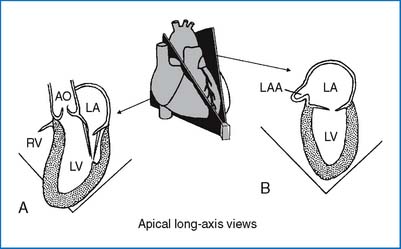
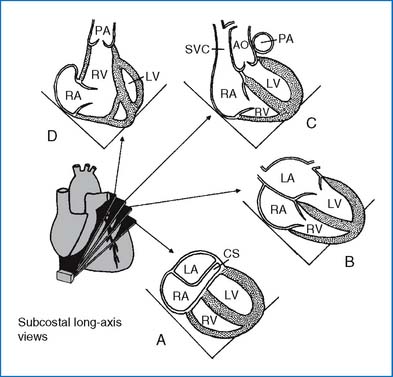
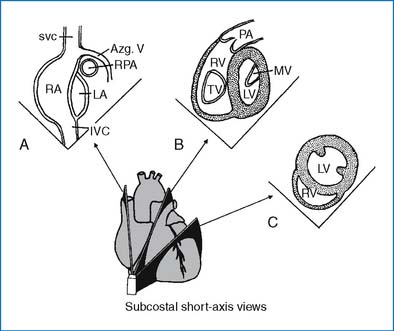
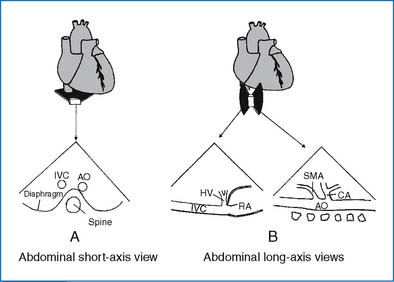
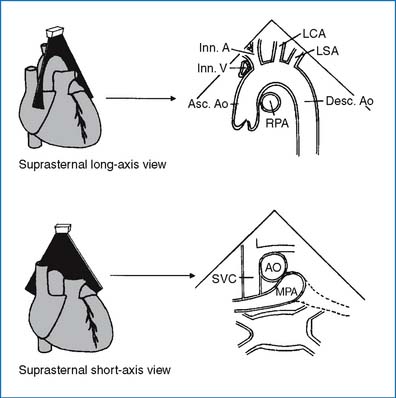
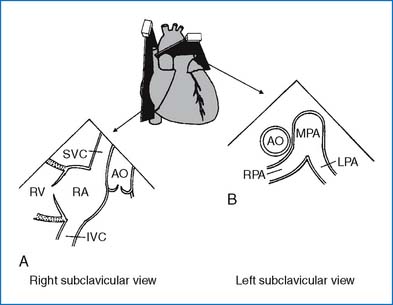
Routine 2D echo is obtained from four transducer locations: parasternal, apical, subcostal, and suprasternal notch positions. Sometimes, abdominal and subclavicular views are also obtained. Figures 2-2 through 2-10 illustrate selected standard images of the heart and great vessels. Selected normal dimensions of cardiac chambers and the great arteries are presented in Appendix D. Table D-4 shows the dimensions of the aorta and pulmonary arteries. Table D-5 shows the aortic root dimensions. Table D-6 shows the mitral and tricuspid valve annulus dimensions, and Table D-7 shows the valve annulus in the neonate.
D. DOPPLER ECHOCARDIOGRAPHY
The two commonly used Doppler techniques are continuous wave and pulsed wave. The pulsed wave (PW) emits a short burst of ultrasound, and the Doppler echo receiver “listens” for returning information. The continuous wave (CW) emits a constant ultrasound beam with one crystal, and another crystal continuously receives returning information. The pulsed-wave Doppler can control the site at which the Doppler signals are sampled, but the maximal detectable velocity is limited, making it unusable for quantification of severe obstruction. In contrast, continuous-wave Doppler can measure extremely high velocities (e.g., for the estimation of severe stenosis), but it cannot localize the site of the sampling; rather, it picks up the signal anywhere along the Doppler beam. When these two techniques are used in combination, clinical application expands.
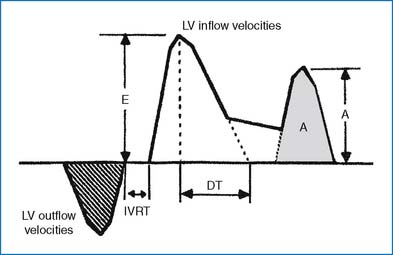
Normal Doppler velocities in children and adults are shown in Table 2-2. Normal Doppler velocity is less than 1 m/sec for the pulmonary valves, but it may be up to 1.8 m/sec for the ascending and descending aortas. With stenosis of the atrioventricular valves, the flow velocity of the E and A waves increases (Fig. 2-11). Normally, the E wave is taller than the A wave, except for the first 3 weeks of life, during which the A wave may be taller than the E wave. In normal subjects 11 to 40 years of age, mitral Doppler indexes are as follows (mean ± SD). The average peak E velocity is 0.73 ± 0.09 m/sec, the average peak A velocity is 0.38 ± 0.089 m/sec, and the average E:A velocity ratio is 2.0 ± 0.5.
TABLE 2-2 NORMAL DOPPLER VELOCITIES IN CHILDREN AND ADULTS: MEAN (RANGES) (IN M/SEC)
| CHILDREN | ADULTS | |
|---|---|---|
| Mitral Flow | 1.0 (0.8–1.3) | 0.9 (0.6–1.3) |
| Tricuspid Flow | 0.6 (0.5–0.8) | 0.6 (0.3–0.7) |
| Pulmonary Artery | 0.9 (0.7–1.1) | 0.75 (0.6–0.9) |
| Left Ventricle | 1.0 (0.7–1.2) | 0.9 (0.7–1.1) |
| Aorta | 1.5 (1.2–1.8) | 1.35 (1.0–1.7) |
From Hatle L, Angelsen B: Doppler ultrasound in cardiology, ed 2, Philadelphia, 1985, Lea & Febiger.
1. Measurement of pressure gradients
P1 − P2 (mm Hg) ≡ 4(V22 − V12),
P1 − P2 (mm Hg) × 4(V max)2,
2. Prediction of intracardiac or intravascular pressures.
Stay updated, free articles. Join our Telegram channel

Full access? Get Clinical Tree


