(1)
Division of Public Health Sciences, Wake Forest School of Medicine, Winston-Salem, NC, USA
Synopsis
This chapter presents brief introductory notes about some special features of the female electrocardiogram (ECG). ECGs are generally displayed as one-dimensional functions of time with different ECG leads grouped in various conventional sequences to provide some two-dimensional (2-D) information such as chest leads V1 through V6. The mean horizontal plane (XZ) QRS and T vector loops of normal adult women show that the spatial direction of the initial repolarization sequence in horizontal plane is predominantly reverse and terminal repolarization concordant with depolarization sequence. Frontal plane QRS and T vector loops both are narrow and directed to the left indicating that spatial direction of repolarization sequence in frontal plane is predominantly reverse with respect to depolarization sequence.
Two-dimensional display of vector loops in principal planes is reasonably effective for illustrating ECG data of an individual person or mean ECG data of a group of individuals. However, these display formats reveal no information about the scatter or clustering of directional information at various time points of excitation or repolarization sequence. Directional distributions of vectorial data require in essence three-dimensional displays. Novel three-dimensional display procedures are introduced in this chapter for this purpose. Of particular importance is information obtained about three-dimensional distribution at time points of peak QRS peak and T peak vectors. While the spatial distribution of T peak vector is relatively tightly clustered at time point T peak and remain tightly clustered throughout repolarization, spatial directions of QRS vectors vary widely in the course of depolarization. The latter finding corresponds to QRS vectors rotating over 180° through the depolarization sequence.
Among the most characteristic features in female ECG with distinctive gender differences are ST segment patterns in anterior chest leads particularly in V2. The ST segment amplitude increases slowly from the J-point (end of QRS) until the onset of the T wave and then increases more rapidly until T wave peak. The slowly ascending ST segment with a relatively tall positive T wave in V2 represents a characteristic female (‘U’-shaped) waveform with a positive convexity.
Abbreviations and Acronyms
AL
Anterior-left
AR
Anterior-right
AS
Anterior-superior
ILA
Inferior-left-anterior
IP
Inferior-posterior
IRA
Inferior-right-anterior
L
Left
PL
Posterior-left
PR
Posterior-right
R
Right
Rp
R wave peak
RT
Repolarization time
RTgrad
RT gradient
SLP
Superior-left-posterior
SRP
Superior-right-posterior
Tp
T wave peak
1.1 Electrocardiographic and Vectorcardiographic Patterns of Adult Women
The main characteristics of the electrocardiogram of normal adult women are presented in this chapter, with a special focus on those ECG features where the sex differences are most pronounced. Sex differences will be covered in detail in Chap. 3.
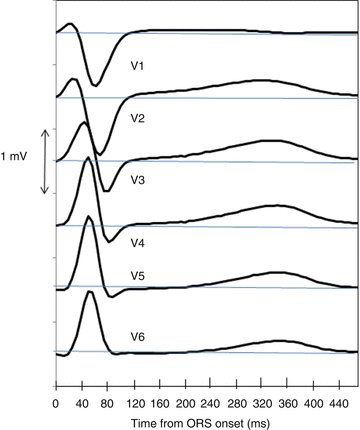
The chest lead ECGs V1-V6 in Fig. 1.1 of a normal 57 year old woman show the normal gradual transition of QRS from rS patterns (small initial R and large S waves) in V1 and V2 to qR pattern (small Q and tall R waves) in left lateral lead V6. T wave amplitude in V1 can normally be negative, biphasic (negative/positive) or flat as in this ECG. TV2 is generally positive but it can occasionally be slightly negative. In other chest leads T wave amplitudes are normally positive.


Fig. 1.1
ECG Chest leads V1–V3 and V4–V6 of a normal 57 years old woman
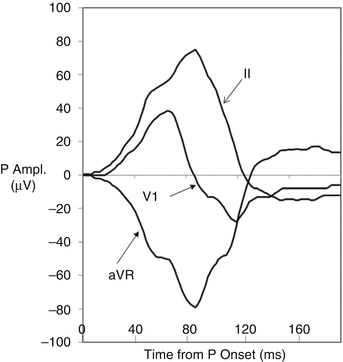
P waves in leads II, V1 and aVR are shown on an enlarged scale in Fig. 1.2. The P waves are seen merging with some overlap into atrial repolarization (so called Ta wave). The PR interval in this ECG was measured as 178 ms. The onset of the QRS complex cuts the Ta wave short. P wave in V1 is biphasic with the initial positive deflection corresponding to the right atrial depolarization and the terminal negative deflection corresponding to the left atrial depolarization in left-posterior direction. Increased terminal PV1 amplitude and duration are used in criteria for left atrial overload. The spatial sequence of atrial repolarization is closely concordant with the spatial direction of atrial depolarization sequence. Because cardiac membrane current flow during repolarization is reverse with respect to the depolarization current flow, Ta waves are of opposite polarity compared to the P waves.


