(4.1)
where S0(x,y) represents the object, x and y are the image-domain position or distance variables in centimeters, and kx and ky are the spatial frequency domain variables (the frequency and phase-encoding directions, respectively) in 1/cm, or cycles per centimeter. This is equivalent to the 2D Fourier transform of the object S0(x,y). For 3D acquisitions, k-space is extended to the kz direction.
K-space has measurable dimensions and an overall size. For each dimension, ∆k (∆kx, ∆ky, ∆kz) is a measure of the spacing between adjacent data points in k-space, and kmax (kxmax, kymax, kzmax) is the highest spatial frequency sampled in each direction. The overall width of k-space W (Wx, Wy, Wz) in each direction is the product of the spacing between k-space sample points and the number of samples (Eq. 4.2):


(4.2)
If the k-space is sampled symmetrically around the k-space center (the origin) in each direction then


(4.3)
MR data acquired in k-space is normally referred to as the raw data. The central region of k-space contains the low spatial frequency components of the image, such as the spatially slowly changing parts of the object and the overall contrast; the periphery of k-space contains the high spatial frequency components of the image that provide the edge definition and finer structures.
All of the phantom and volunteer images in this chapter were acquired on a 1.5T scanner (MAGNETOM Aera, Siemens Healthcare, Germany). All the MR images of the heart were collected from the same normal volunteer. The relationship between k-space and the reconstructed image is illustrated in Fig. 4.1 using an MR image of the heart acquired in the four-chamber view. The original image was acquired with a FOV of 340 × 340 mm2 and an acquired matrix size of 256 × 256 (a). In the lower left column, the central 1/64th (b), 1/16th (c) and 1/4th (d) portion of k-space were preserved and the peripheral portions were filled with zeros; conversely, in the lower right column the central 1/64th (e), 1/16th (f) and 1/4th (g) of k-space was filled with zeros and the peripheral portions preserved. As shown in the corresponding reconstructed images, the central portion of k-space mostly contains information about the overall image contrast, while the peripheral portion of k-space mostly contains information about the fine details and edges.
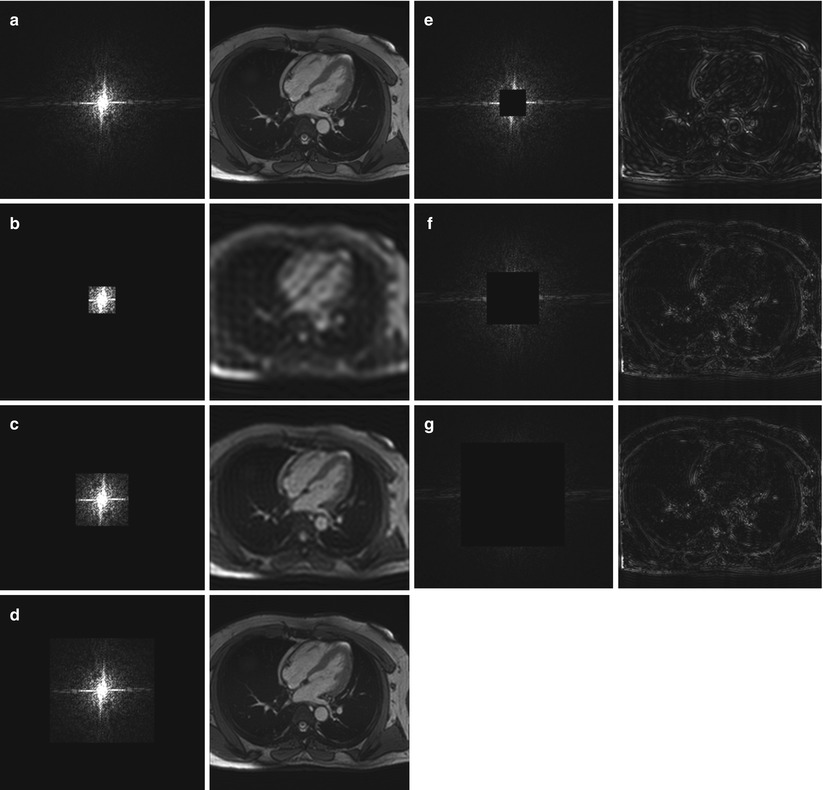

Fig. 4.1
The relationship between k-space and the reconstructed image. (a) The fully sampled k-space and its reconstructed image consisting of an FOV of 340 × 340 mm2 with an acquired matrix size of 256 × 256. The effect of preserving the central 1/64th (b), 1/16th (c) and 1/4th (d) of k-space while filling the peripheral portions with zeros is demonstrated on the left. Conversely, the effect of filling the central 1/64th (e), 1/16th (f) and 1/4th (g) of k-space with zeros while preserving the peripheral portions is shown on the right
The Relationship Between k-Space and Image Space
The desired in-plane spatial resolution is determined by selecting the FOV and number of sample points in the frequency- and phase-encoding directions. These selections in turn determine the sampling of k-space (the extent of coverage and sampling interval).
The spacing between k-space points is inversely related to the FOV of the image (Eq. 4.4). A larger FOV requires denser sampling in k-space, while a smaller FOV results from sparser sampling in k-space.


(4.4)
Similarly, there is an inverse relationship between the spatial resolution and the overall extent of k-space (Eq. 4.5). Since k-space represents the spatial frequency content of the image, higher spatial frequencies are required to visualize the details of smaller objects. Increasing the extent of k-space results in reduced voxel size and therefore increased spatial resolution.


(4.5)
The relationship between image space and k-space is shown in Fig. 4.2.
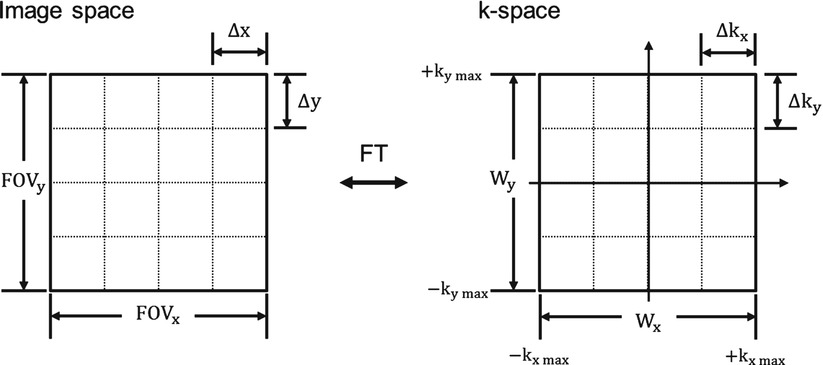

Fig. 4.2
The relationship between image space and k-space. The sampling interval between k-space points is inversely related to the FOV of the image and the spatial resolution is also inversely related to the overall size of k-space
In Fig. 4.3, image a and image b have the same spatial resolution, but the FOV of image b is twice the size of the FOV of image a. The pixel size (spatial resolution) and extent of k-space coverage (W) are the same for both image a and image b; however, the k-space sampling interval (∆k) of image a is twice that of image b, and therefore the FOV of image a is only one half that of image b. On the other hand, image a and image c have the same FOV, but the spatial resolution of image c is twice that of image a, i.e., the pixel dimensions of image c are only half those of image a. As the result, the k-space sampling interval of image a is the same as that of image c, but the k-space of image a has twice the extent compared to that of image c. Figure 4.3 demonstrates that the extents of the acquired k-space (Wx and Wy) determine the pixel dimensions, while the sampling intervals of k-space (∆kx and ∆ky) determine the image FOV.
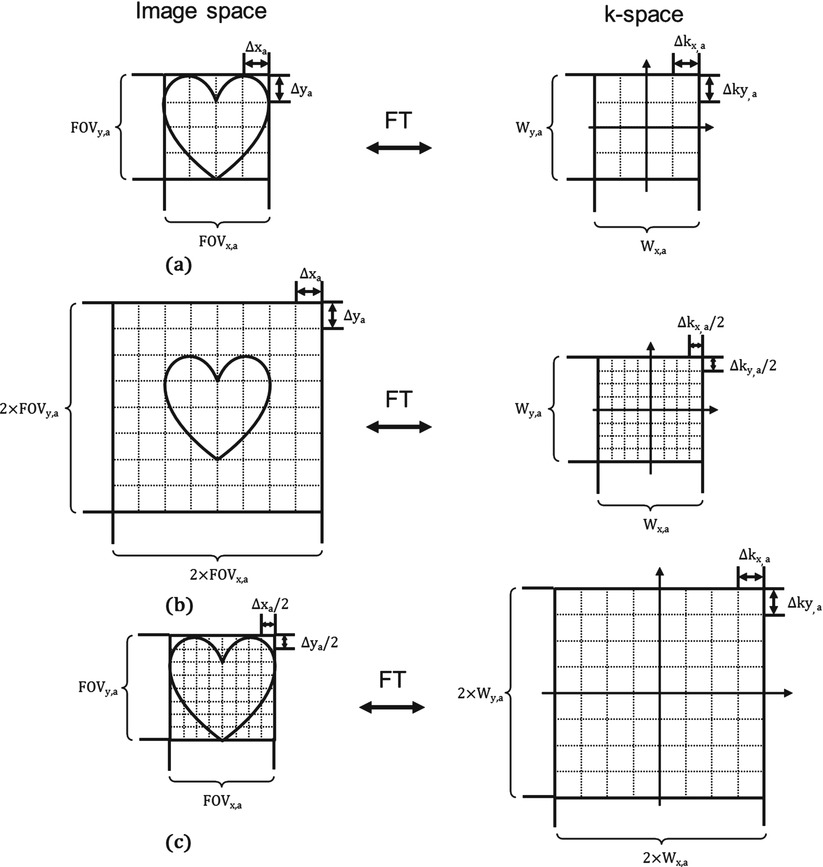

Fig. 4.3
Image (a) and image (b) have the same spatial resolution, but the FOV of image (b) is twice the FOV of image (a). Therefore the corresponding k-spaces for image (a) and image (b) have the same coverage (W), but the k-space sampling interval (∆k) of image (a) is twice that of image (b). Image (a) and image (c) have the same FOV, but the spatial resolution of image (c) is twice the spatial resolution of image (a). As a result, the k-space sampling interval of image (a) is the same as that of image (c), but the k-space coverage of image (a) is twice that of image (c)
Effect of Truncating k-Space on Image Quality
Because the object being imaged (typically a human or an animal) is of finite extent, by the properties of the Fourier Transform the corresponding k-space has infinite extent (Eq. 4.1). As the result, the measured k-space signal, which is of finite extent, is a truncated representation of the actual Fourier transform of the object. As shown in Fig. 4.1, the periphery of k-space contains the high spatial frequency information. With k-space truncation, some high spatial frequency information is unavoidably lost, leading to reduced image sharpness and loss of fine details in the image. Truncation of k-space is equivalent to multiplying the k-space by a rectangular function, which is by the properties of the Fourier Transform equivalent to convolution of the image with a sinc function (the Fourier transform of the rectangular function). The sinc function (sin(x)/x), has a main lobe of finite width, and an infinite number of sidelobes of diminishing amplitude, as shown in Fig. 4.4. Truncating the k-space causes image blurring and ringing artifacts around the edges of objects called Gibbs ringing artifacts; these can be explained by the convolution of the image with the sinc function. For larger voxel size, the rectangular function is narrower and truncates k-space nearer to the center of k-space; this results in a sinc function with wide side lobes that produces a broader ringing artifact. The truncation artifacts become substantial when the width of an edge (the transition between tissues of different image intensities) is on the order of or smaller than the voxel size.
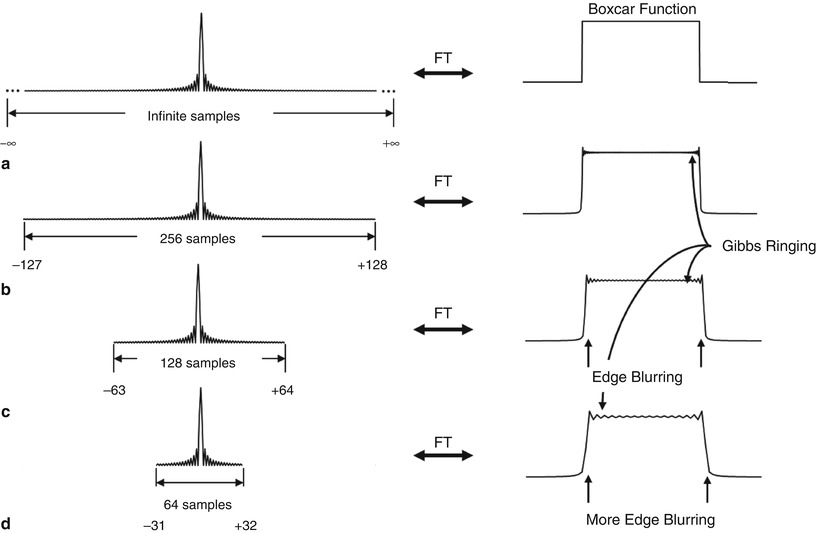

Fig. 4.4
The effect of frequency truncation on the boxcar function (a). With the decreased sampling in frequency space (b–d), blurring and Gibbs ringing are observed in the reconstructed signal
Figure 4.4 demonstrates the effect of frequency space truncation using a 1D boxcar, which is another name for the rectangular function discussed earlier. The Fourier transform of the boxcar function has an infinite extent. If the entire frequency spectrum of the Fourier transform of the boxcar function could be sampled, its inverse transform would again result in a boxcar function with perfect edges. However, given that only a finite number of frequency components can be sampled, Gibbs ringing artifacts and edge blurring are observed in the reconstructed signal. As shown in Fig. 4.4b–d, with fewer points sampled in the frequency space, the edge becomes blurred and the Gibbs ringing artifact becomes broader. Figure 4.5 uses the same example as in Fig. 4.1. If only the central 64 × 64 of the k-space is acquired, the high-spatial-frequency information is lost and the reconstructed image shows edge blurring and ringing artifacts.
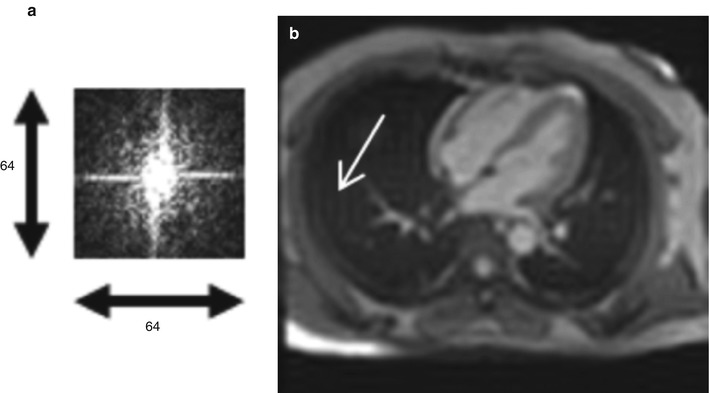

Fig. 4.5
If only the central 64 × 64 of the k-space (a) is sampled, the reconstructed image (b) shows blurring and Gibbs ringing artifacts (arrow)
The Gibbs ringing artifacts can be minimized by multiplying the k-space data by a filter or window function that smoothly attenuates the high-frequency information, rather than sharply cutting off the data with a boxcar or rectangular function. However, the trade-off is reduced spatial resolution due to the loss of additional high spatial frequency information [2].
Nominal Spatial Resolution vs. Apparent Spatial Resolution
Based on the concept of k-space and the relationship between k-space and image space, the nominal spatial resolution, which is also called the true spatial resolution, is determined by the extent of k-space coverage. Once the raw data are acquired, the nominal spatial resolution is defined and cannot be further improved. The nominal resolution determines the smallest structure that can be resolved in the image. Lesions or vessels smaller than the size of the nominal resolution cannot be distinguished from the background tissue since the information needed to visualize smaller structures is not contained in the raw data. On the other hand, the apparent spatial resolution, which is also called the display resolution, can be improved. It is determined by the image FOV and the number of pixels in the reconstructed image. Due to the nature of digital imaging, the display resolution may have little to do with the true spatial resolution, and can be improved by digital image interpolation.
Zero Filling
Digital image interpolation can be achieved by employing a strategy called zero padding or zero filling. It involves filling the uncollected peripheral regions of k-space with zeros before the Fourier transform to improve the apparent resolution.
The process is shown in Fig. 4.6. The original image is acquired on a FOV of 340 mm with an imaging matrix of 256 × 256, resulting in a nominal or true spatial resolution roughly equal to 1.3 × 1.3 mm. A 512 × 512 matrix in k-space can be generated by filling the periphery of the 256 × 256 matrix with zeros to increase the raw data matrix size. Taking the Fourier transform of the 512 × 512 matrix in k-space creates an image with 512 × 512 pixels, cutting the pixel dimensions in half in each in-plane direction. Compared to the original image with 256 × 256 pixels, the new image with 512 × 512 pixels may appear smoother or less blocky; however, there is no additional true spatial resolution; the original pixels have merely been interpolated. Interpolation is roughly the equivalent of taking the average value of two adjacent pixels to make a new pixel in between the two. In the new image, the apparent resolution becomes 0.65 × 0.65 mm with zero filling, but the nominal resolution remains at 1.3 × 1.3 mm.
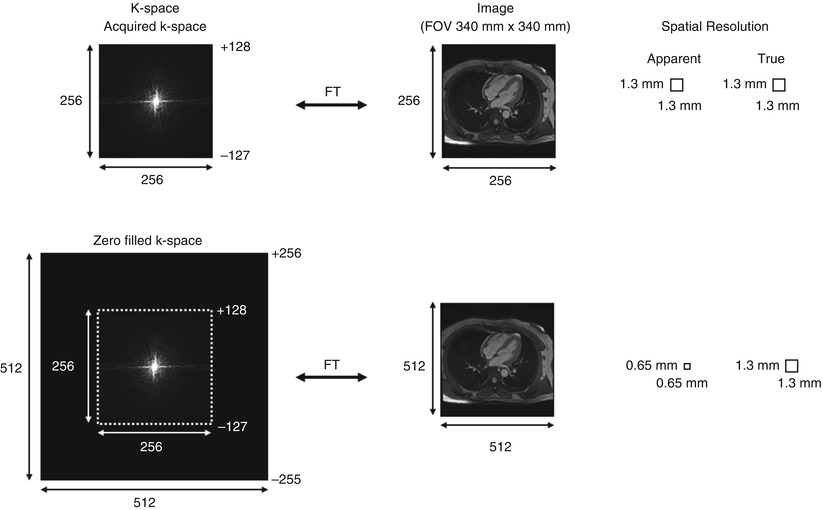

Fig. 4.6
Zero filling of an imaging matrix of 256 × 256–512 × 512 and its effect in image interpolation. The apparent spatial resolution of the reconstructed image improves by a factor of 2 due to interpolation, but the nominal spatial resolution does not change
Zero filling is commonly used to increase the image matrix size in the phase-encoding direction or in the partition-encoding direction for 3D scans. In practice, zero-filling with a factor of 2 is used to improve the display resolution. Increasing the zero filling factors beyond 4 provides magnification of the image, but with diminishing returns.
One drawback of zero filling is the increase in reconstruction time due to the increased Fourier transform length. Also larger image files can burden the image archiving system: a 512 × 512 image requires four times the disk space compared to a 256 × 256 image. Finally, zero filling can increase the conspicuity of Gibbs ringing artifacts in the MR images due to the rapid signal changes in the high-spatial frequencies. Although zero filling has these minor drawbacks, it is still commonly used on commercial systems due to its computational convenience and the advantage of increasing apparent spatial resolution without a scan time penalty.
Partial Fourier
Partial Fourier acquisition is another method used to reduce acquisition time while maintaining spatial resolution. This technique is based on the fact that if an object is real (vs. complex valued), its Fourier transform (k-space) has a particular symmetry that reflects the relationship between the real and imaginary components. This symmetry is referred to as Hermitian conjugate symmetry, in which the data located diagonally from each other across the origin of k-space have identical amplitudes but opposite phases. In Fig. 4.7, point A and point B are located symmetrically across the k-space center. If point A is a complex number with its value equals to a+bi, where a is its real number and b is its imaginary number, and then based on the Hermitian conjugate symmetry, point B is known to be a-bi. Mathematically, Hermitian 2D k-space data obeys the equation (Eq. 4.6):
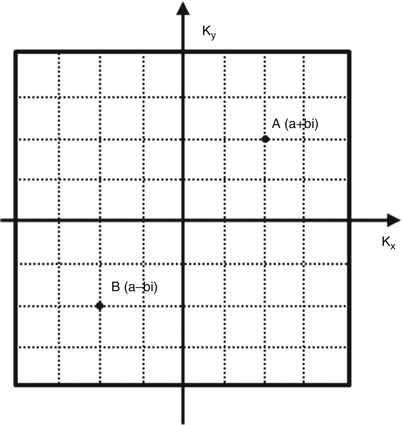

where * denotes complex conjugation. As the result, theoretically, to reconstruct an image of a real object, only one half of k-space is needed, while the other half can be synthesized based on Hermitian symmetry. However, in MR imaging, unwanted phase shifts resulting from motion, B0 and B1 inhomogeneities, eddy currents, and hardware delays, cause the reconstructed images to be complex (real and imaginary parts), instead of strictly real; as a result, the Hermitian conjugate symmetry is no longer perfect.

Fig. 4.7
Hermitian conjugate symmetry of k-space. Point A and point B are located diagonally from each other across the k-space center. If point A is a complex number with its value equals to a+bi, where a is its real number and b is its imaginary number, and then based on the Hermitian conjugate symmetry, point B is known to be a–bi

(4.6)
Partial Fourier acquisition takes advantage of Hermitian conjugate symmetry to collect data asymmetrically around the center of the k-space. One half of k-space is collected completely, while the other half of k-space is only partially filled. Collection of partial k-space can be implemented in either the frequency-encoding or the phase-encoding direction. Partial Fourier acquisition in the frequency-encoding direction is called fractional echo, or partial echo, or asymmetric echo sampling. Its primary advantages are reduced TE, and also reduced frequency encoding gradient moment, which can reduce flow and motion artifacts. Partial Fourier in the phase-encoding direction is often called partial NEX (number of excitations). Its primary advantage is reduced total scan time. Similarly, partial Fourier can be applied in the partition-encoding direction for 3D scans.
The partial Fourier fraction, defined as the ratio between the partially acquired k-space data size and the full k-space data size, can be used to characterize the k-space acquisition in partial Fourier. For example, a full Fourier acquisition has a matrix size of 256. A partial Fourier acquisition in the phase-encoding direction may only acquire 192 phase-encoding lines asymmetrically with respect to the center of the k-space. One hundred twenty-eight lines are fully sampled in one half of k-space, while only 64 lines are sampled in the other half of the k-space; this results in a partial Fourier fraction of 0.75 (192/256). In practice, we always sample at least slightly more than one-half of k-space, despite the common use of the term “half-Fourier acquisition” to mean any partial Fourier sampling. For example, in Half-Fourier Acquisition Single-shot Turbo spin Echo imaging (HASTE), typically at least eight lines of data are acquired on the undersampled side of k-space.
Zero filling is the simplest way to reconstruct data acquired with partial Fourier. It is implemented by substituting zeros for the uncollected portion of k-space data, followed by conventional Fourier transform reconstruction. The process is demonstrated in Fig. 4.8. In this example, each line of k-space would normally contain 256 data points, 128 on either side of the center peak. The right side of the k-space is fully sampled, while only 64 out of 128 points on the left side are sampled, and the missing samples are filled with zeros. After zero filling, the standard Fourier transform can be used. The advantage of zero filling is that it gives a relatively faithful representation of the object over the low spatial-frequency range. The phase of most large structures is therefore accurate and allows zero filling to be used for phase-sensitive reconstruction, but because some of the signal power is lost at higher spatial frequencies, zero filling introduces blurring and reduces spatial resolution. Other advanced methods, such as Homodyne reconstruction [2], or iterative partial Fourier reconstruction such as Projection onto Convex Sets, POCS [3], exploit the Hermitian conjugate symmetry of k-space to estimate the missing data. Those methods use a phase map generated from the fully sampled central region of k-space to correct for phase errors produced by the reconstruction of incomplete k-space data. Compared with zero filling, these methods do a better job of preserving the true spatial resolution, but add some computational complexity and reconstruction time.


Fig. 4.8
Zero filling reconstruction in partial Fourier acquisition
When k-space is sampled using partial Fourier and zero filled, the true spatial resolution becomes more difficult to determine. The true spatial resolution depends on the degree of asymmetry, i.e., how much data was skipped. However, for the same number of sample points, partial Fourier with zero filling generally improves the spatial resolution compared with symmetric sampling at the expense of SNR. This effect is demonstrated using a resolution phantom in Fig. 4.9. The image has an FOV of 384 mm. Symmetric sampling collects 384 phase encoding lines symmetrically to the center of k-space, i.e., 192 points on each side, generating an image with a true spatial resolution of 1 mm square. If only half of the k-space is acquired (partial Fourier fraction of 0.5), the true spatial resolution is expected to be between 1 and 2 mm in the phase-encoding direction. Compared to symmetric sampling with 96 points on each side of the k-space and a spatial resolution of 2 mm along the phase-encoding direction, partial Fourier improves spatial resolution.
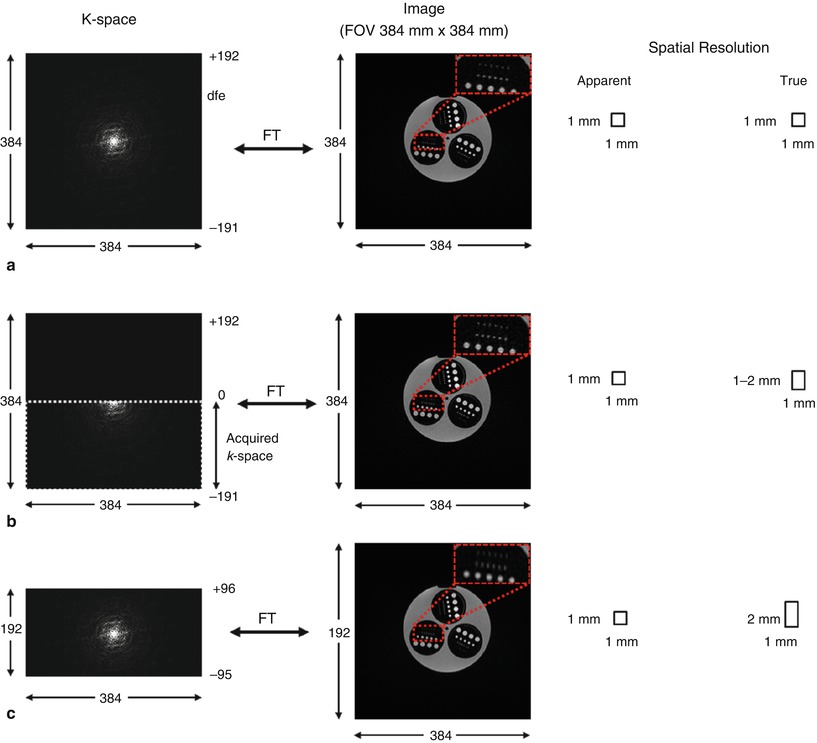

Fig. 4.9
The apparent and true spatial resolution of symmetric sampling and partial Fourier sampling. (a) 384 lines of k-space were acquired symmetrically to the center of k-space, resulting 1 mm of apparent and true spatial resolution. (b) 192 lines of k-space were acquired to fill only half of the k-space. The apparent spatial resolution in the phase-encoding direction is still 1 mm, but the true spatial resolution is expected to be between 1 and 2 mm due to partial Fourier acquisition. (c) 192 lines of k-space were acquired symmetrically to the center of k-space. Compared to (b), the same number of lines was acquired, but the true spatial resolution is now 2 mm in the phase-encoding direction
Temporal Resolution
Introduction
In general terms, temporal resolution can be defined as the “precision of a measurement with respect to time” [4]. In medical imaging, temporal resolution is a fundamental parameter that defines our ability to evaluate dynamic processes. Functional MRI [5] aims to capture dynamic changes in blood oxygenation levels in the brain to analyze neural activity. Cine cardiac MRI captures the movement of the heart to assess cardiac function. Perfusion MRI captures the dynamic changes in image intensity following injection of contrast agent. Flow imaging measures blood flow dynamics. All of these various applications have a basic requirement in common; sufficient temporal resolution is needed to evaluate the dynamic physiological process of interest [6–8].
For cardiac MRI, the required temporal resolution could be defined as the shortest time per temporal frame required to capture cardiac dynamics. However, this is somewhat ambiguous as it could potentially be defined by the number of frames displayed per second, or by the acquisition time required to gather enough data to reconstruct one single image. In practice, temporal resolution in MRI can be difficult to define precisely for a particular acquisition. Going back to the general definition for temporal resolution, it is clear that higher temporal resolution should allow us to better distinguish motion without blurring. For cardiac cine MRI, the SCMR guidelines [9] suggest at least 50 ms temporal resolution for a nominal 1,000 ms R-to-R (RR) interval, which is equivalent to 20 frames per second.
Various image acquisition strategies have been used to improve temporal resolution for cardiac MRI. Some of these methods aim to improve the number of frames displayed per second (apparent temporal resolution) while keeping the acquisition times intact; others aim to decrease the acquisition time per frame (real temporal resolution). In the following sections, the aforementioned imaging methods will be described in detail and their effects on apparent and real temporal resolutions will be illustrated. Due to difficulties visualizing the effects of temporal resolution on still images, video files from in-vivo cardiac scans covering different scenarios are provided.
View-Sharing
Temporally adjacent k-space frames tend to share a significant amount of information because many of the features in sequential images remain unchanged. Therefore, in theory one could partially acquire each frame and recover the missing information from the adjacent frames. This strategy is broadly termed view-sharing [10]. View sharing improves the apparent temporal resolution by increasing image refresh rate; however, real temporal resolution may remain unchanged since the temporal information in the reconstructed images depends on the temporal window used to acquire the data. Please refer to Videos 4.1 (standard acquisition) and 4.2 (view-shared acquisition) to visualize the differences.
Over the years, various methods based on view-sharing principles had been presented; such as keyhole [11], blocked regional interpolation scheme for k-space (BRISK) [12], cardiac triggered phase-contrast examinations [13, 14], Continuous update with random encoding (CURE) [15] and TWIST [16].
Keyhole
The keyhole method dynamically acquires only a small portion of k-space for each reconstructed frame and fills the missing information from a fully sampled static reference image. Since some dynamic processes such as first-pass contrast enhancement are mostly represented by low-frequency information, central k-space lines are reacquired for each reconstructed frame. In practice, a factor of four acceleration (i.e., dynamically sampling only 25 % of k-space) may be achieved. The unacquired high spatial frequency content in each frame is filled in using data from a previously acquired fully sampled reference frame1 as depicted in Fig. 4.10. The choice of the k-space area to acquire has profound effects on image quality. Spraggins [17] showed that if the dynamic object is much smaller than the dynamically updated k-space region can depict, image intensity cannot be correctly estimated.
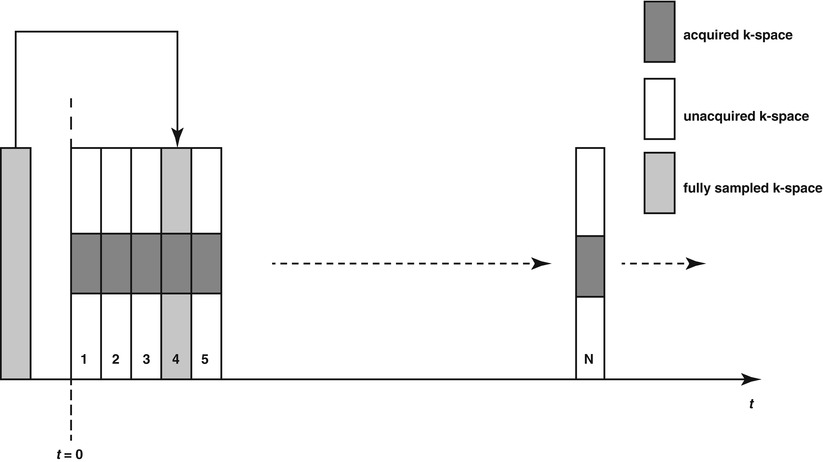

Fig. 4.10
Keyhole method. Data are partially acquired; for each frame, only a central portion of k-space is sampled. Outer k-space lines are filled using the fully sampled reference data acquired previously
The most straightforward reconstruction scheme for a keyhole acquisition is to directly copy the missing high spatial frequency k-space content directly from the reference data (Eq. 4.7):

Where S full represents the full k-space, S k represents keyhole k-space, and S ref represents reference k-space frame, p is a specific phase encoding line, and K A is the keyhole area acquired: missing phase encoding lines are directly copied from the reference frame to the keyhole frame to obtain the full k-space data.

(4.7)
An alternative approach, reduced-encoding imaging by generalized-series reconstruction (RIGR), was presented by Webb et al. [18]. In this method the high spatial frequency information in the reconstructed image is forced to be continuous with the acquired low-frequency content to improve image quality.
While the apparent temporal resolution for keyhole methods can be fairly high, the real temporal resolution is still low. Despite high image quality, these methods may excessively smooth out some kinetic information due to large temporal footprint used for data acquisition, especially in smaller anatomical structures that are represented more strongly by outer lines of k-space [19].
< div class='tao-gold-member'>
Only gold members can continue reading. Log In or Register to continue
Stay updated, free articles. Join our Telegram channel

Full access? Get Clinical Tree


