Sinus Node Function
Disorders of sinus node function are an important cause of cardiac syncope. Approximately 50% of permanent pacemakers implanted at our own and other institutions are for the specific treatment of bradyarrhythmias, caused by sinus node dysfunction. This number is increasing as the number of elderly people in our population rises. This has been associated with an increase in symptomatic disorders of sinus node dysfunction, particularly the bradycardia–tachycardia syndrome. Clinical disorders of sinus node dysfunction can be characterized as abnormalities of automaticity or conduction, or both. Automaticity refers to the ability of pacemaker cells within the sinus node to undergo spontaneous depolarization and generate impulses at a rate faster than other latent cardiac pacemakers. Once generated, the impulses must be conducted through and out of the sinus node to depolarize the atrium. Delay or failure of conduction can occur within the sinus node itself or at the sinoatrial junction in the perinodal tissue. The methods by which sinus node automaticity and conduction are evaluated include ECG monitoring, atrial stimulation techniques, and direct recording of the sinus node. The assessment of the influence of autonomic tone on these parameters can provide additional information concerning inherent sinus node function.
Electrocardiographic Features of Sinus Node Dysfunction
Because no method is currently available to directly record sinus node activity from the body surface in humans, noninvasive evaluation of sinus node automaticity and conduction must be made by indirect methods. Therefore, we attempt to assess sinus function electrographically by analyzing the frequency and pattern of atrial depolarization, that is, P-wave morphology, frequency, and regularity.
Sinus Bradycardia
When persistent and unexplained, sinus bradycardia (a rate less than 60 beats per minute [bpm]) is said to reflect impaired sinus automaticity. The value of 60 bpm, an arbitrary one, is extremely nonspecific, and it has led to the misclassification of many normal persons as abnormal. Kirk and Kvorning analyzed the ECGs of 482 consecutive patients admitted to the general medicine service; their results suggested that a rate of less than 60 bpm would classify one-third of all men and one-fifth of all women as abnormal.1 A study that involved 24-hour Holter monitoring of 50 healthy medical students revealed that all the students had sinus bradycardia at some time during the 24-hour period and 26% of the students had significant sinus bradycardia (a rate less than 40 bpm) during the day.2 Because autonomic tone plays such an important role in determining the sinus rate, we believe that an isolated heart rate of less than 60 bpm should not be considered abnormal, particularly in asymptomatic people, unless it is persistent, inappropriate for physiologic circumstances, and cannot be explained by other factors. Sinus bradycardia usually results in dizziness, fatigue, mental status changes, and dyspnea on exertion if chronotropic insufficiency is marked.
Sinoatrial Block and Sinus Arrest
Both sinus arrest and exit block are definite manifestations of sinus node dysfunction. Although sinoatrial block is a conduction disturbance, it remained unsettled whether sinus arrest actually reflects impaired or absent sinus automaticity or varying degrees of sinus exit block. Recently, use of direct recordings of the sinus node has allowed one to ascertain the cause of such pauses (see later section in this chapter entitled Sinus Node Electrogram). Symptoms are uncommon unless pauses are marked. When this happens, syncope can occur.
Bradycardia–tachycardia Syndrome
In our own experience and the experience of others, the bradycardia–tachycardia syndrome is the most frequently encountered form of symptomatic sinus node dysfunction, and it is associated with the highest incidence of syncope.3 The syncope is generally associated with the marked pauses following the cessation of paroxysmal supraventricular tachyarrhythmias that occur in the setting of sinus bradycardia (primarily atrial fibrillation). Of importance is the recognition that a prolonged asystolic period occurring in the setting of any form of sinus node dysfunction also implies impaired function of lower (nonsinus) pacemakers. The drugs used to prevent atrial fibrillation or control its rate are often responsible
for the symptomatic bradycardias following cessation of the arrhythmia, and hence, the need for pacemakers. Syncope is much rarer in patients with isolated sinus bradycardia. When these patients are symptomatic, it is usually fatigue or dyspnea on exertion. Syncope in patients with isolated sinus bradycardia is usually neurocardiac. Autonomic reflex abnormalities consistent with neurocardiac syncope (see below) are usually present when syncope occurs in patients with isolated sinus bradycardia.4
for the symptomatic bradycardias following cessation of the arrhythmia, and hence, the need for pacemakers. Syncope is much rarer in patients with isolated sinus bradycardia. When these patients are symptomatic, it is usually fatigue or dyspnea on exertion. Syncope in patients with isolated sinus bradycardia is usually neurocardiac. Autonomic reflex abnormalities consistent with neurocardiac syncope (see below) are usually present when syncope occurs in patients with isolated sinus bradycardia.4
Electrocardiographic Monitoring of Patients Suspected of Having Sinus Node Dysfunction
If a random ECG in a patient with episodic symptoms is normal, prolonged (24-hour) ECG monitoring is the next step in evaluating sinus node function. Unfortunately, most episodes of syncope or dizziness are paroxysmal and unpredictable, and even 24-hour monitoring may fail to include a symptomatic episode. The use of event recorders has improved our ability to correlate symptoms with sinus node dysfunction. In cases with infrequent episodes of syncope, an implantable event recorder is now available. It must be interrogated as a pacemaker currently, but in the near future, it will have automatic detection. Although asymptomatic sinus bradycardia may be noted frequently, its significance remains uncertain. The appropriateness of the sinus rate relative to the physiologic circumstances under which it occurs is critical in deciding whether there is an abnormality of sinus automaticity.
The frequency and clinical significance of sinus pauses have been studied.4,5 Sinus pauses greater than or equal to 2 seconds were found in 84 (2.6%) of 3,259 consecutive 24-hour Holter monitor studies.4 The pauses ranged from 2 to 15 seconds. The length of pause correlated poorly with symptoms and did not predict death. Most pauses were asymptomatic, whereas in the remainder, pauses could have produced symptoms. Pacemakers did not benefit asymptomatic people and failed to prevent dizziness, presyncope, and syncope in one-third of the patients in whom such symptoms were felt to be secondary to the pauses. In a second study of 6,470 Holters, 0.3% had sinus pauses greater than or equal to 3 seconds.5 Only one patient was symptomatic during a pause. All patients did well without a pacemaker. Other studies have demonstrated pauses >2 seconds in 11% normals and in one-third of trained athletes.6,7,8 Despite the limitations of retrospective studies, these data suggest that although rare, sinus pauses equal to or greater than 3 seconds, particularly when asymptomatic, need not be treated. As noted above, syncope in such instances is more likely neurocardiac in origin (Alboni). However, demonstration of symptomatic unexplained sinus bradycardia, long asystolic periods following paroxysmal tachyarrhythmias, sinus exit block, or sinus arrest is diagnostic of sinus dysfunction and may obviate the need for further diagnostic evaluation. Furthermore, 24-hour monitoring and/or event recorders can exclude sinus node dysfunction, atrioventricular (A-V) block, or cardiac arrhythmias as causes of syncope by demonstrating sinus rhythm during an attack.
Assessment of Autonomic Tone
The response of the sinus node, including heart rate and heart rate variability, to changes in autonomic tone should be assessed in all patients suspected of having sinus node dysfunction. The assessment can be made pharmacologically by evaluating the response of the sinus node to atropine, isoproterenol, and propranolol. The effects of “pharmacologic denervation” can be evaluated after the concurrent administration of atropine and propranolol. The response to carotid sinus massage may be diagnostically useful in patients with syncope that is due to carotid sinus hypersensitivity in which there is a heightened response to vagal stimuli. Exercise testing offers another method of assessing sinus node response to enhanced sympathetic tone.9
Atropine (1 to 3 mg) is the most widely used agent to assess parasympathetic tone. The normal response is an acceleration of heart rate to greater than 90 bpm and an increase over the control rate of 20% to 50%.10,11,12,13,14,15,16,17 Most patients with symptomatic sinus node dysfunction exhibit a blunted response to atropine.11,13,17,18 Failure to increase the sinus rate to above the predicted intrinsic heart rate (IHR, see following discussion) following 0.04% mg/kg of atropine is diagnostic of impaired sinus node automaticity. In our experience, patients with asymptomatic isolated sinus bradycardia commonly show a normal or sometimes exaggerated chronotropic response.
Isoproterenol (1 to 3 mg/min) produces sinus acceleration of at least 25% in normal people.10,11,12,17,19 An impaired response to isoproterenol correlates well with a blunted heart rate response to exercise observed in some patients with sinus node dysfunction.9 The response of some patients with suspected sinus node dysfunction to isoproterenol is occasionally normal or even exaggerated. Such responses are not unexpected because the chronotropic responses to exercise in those patients are usually normal. This exaggerated response may represent a form of denervation hypersensitivity, with basal bradycardia that is due to a low resting sympathetic tone in contrast to a primary lack of responsiveness to sympathetic stimulation.
Propranolol has not been extensively studied in patients with the sick sinus syndrome. In normal persons, propranolol (0.1 mg/kg, up to 10 mg) produces a 12% to 22.5% increase in sinus cycle length.20,21,22 A similar (17.4%) increase in sinus cycle length has been noted in a study of 10 patients with symptomatic sinus node disease.17 Thus, the chronotropic response to propranolol is usually no different in patients with and those without sinus node dysfunction, suggesting that sympathetic tone and/or responsiveness is intact in most patients with sinus node dysfunction at rest.
Pharmacologic denervation using atropine (0.4 mg/kg) and propranolol (0.2 mg/kg) has been used to determine an IHR.23,24,25 Tonken et al.26 have suggested that lower doses
(0.03 mg/kg of atropine and 0.15 mg/kg of propranolol) are sufficient. The effects of this autonomic blockade peak after 5 minutes and are usually stable for 30 minutes. The IHR is age-dependent in persons 15- to 70-years old, and it can be defined by the regression equation: IHR = 117.2 − (0.57 × age) bpm (Fig. 3-1). Thus, the normal response to autonomic blockade usually results in an increase in heart rate. Because a depressed IHR correlates well with other abnormalities of sinus node function, the determination of the IHR in patients with isolated sinus bradycardia may more accurately identify patients who truly have sinus node dysfunction from those who have enhanced parasympathetic tone.27
(0.03 mg/kg of atropine and 0.15 mg/kg of propranolol) are sufficient. The effects of this autonomic blockade peak after 5 minutes and are usually stable for 30 minutes. The IHR is age-dependent in persons 15- to 70-years old, and it can be defined by the regression equation: IHR = 117.2 − (0.57 × age) bpm (Fig. 3-1). Thus, the normal response to autonomic blockade usually results in an increase in heart rate. Because a depressed IHR correlates well with other abnormalities of sinus node function, the determination of the IHR in patients with isolated sinus bradycardia may more accurately identify patients who truly have sinus node dysfunction from those who have enhanced parasympathetic tone.27
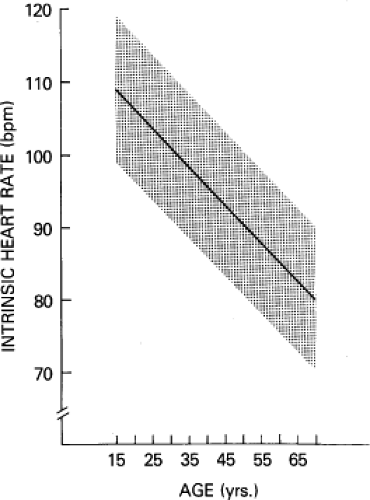 FIGURE 3-1 Relationship of intrinsic heart rate to age. The stippled area delineates the normal range ±2 SD of intrinsic heart rate at different ages. (From Jose AD. Effect of combined sympathetic and parasympathetic blockade on heart rate and cardiac function in man. Am J Cardiol 1966;18:476.) |
This is evident from observations that tests of sinus node function are more often positive in patients with abnormal IHR. The IHR correlates well with the rate of the denervated sinus node of transplanted hearts.28 Following autonomic blockade, the sinus cycle length is stable and allows for more reproducible results when electrophysiologic perturbations are employed (see following discussion). The response to atropine alone may provide as much information and obviate the need for propranolol. Failure of the sinus rate to accelerate above the predicted IHR is diagnostic of abnormal sinus automaticity.
Carotid sinus pressure (CSP) with ECG monitoring occasionally reveals patients in whom paroxysmal dizziness and/or syncope is due to a hypersensitive carotid sinus (see later section in this chapter entitled Vagal Hypersensitivity Syndromes). Pauses in excess of 3 seconds in response to 5 seconds of CSP are said to be abnormal and may be responsible for such symptoms. Similar pauses, however, may be observed in asymptomatic elderly people. We have observed ≥3 second pauses in 40% of asymptomatic patients ≥70-years old. Wellens (personal communication) has a similar experience. Thus, the use of CSP may give false-positive results. Only if pauses are long and produced symptoms identical to those occurring spontaneously should therapy be based on this isolated finding. Even then, all other potential causes of syncope should be ruled out. Other tests of autonomic reflexes include baroreceptor reflexes, valsalva maneuver, and, most commonly, the upright tilt test (see below).
Exercise testing using a Bruce or modified protocol has demonstrated that many patients with sinus node dysfunction have a blunted response to exercise when compared to controls at comparable oxygen consumption, but significant overlap exists. A chronotropic assessment protocol that focuses on intermediate workloads (3 to 5 METs) is more appropriate since symptomatic individuals have their symptoms at such activity. Even so, I believe too much overlap exists to rely on heart rate alone. Symptoms must be related to the inadequate heart rate.
Electrophysiologic Evaluation of Sinus Node Function
The evaluation of sinus node function should include the assessment of sinus automaticity and sinoatrial conduction as well as the effects of physiologic and pharmacologic interventions on these properties. Unfortunately, most methods used for these tests provide only indirect and impure analysis of sinus node automaticity and conduction. Notwithstanding, because of their widespread use, a description of these electrophysiologic tests follows. It is imperative that one understands the limitations of these tests if they are to be used to help make clinical decisions. The tests used to evaluate sinus node function have been recently evaluated by Benditt et al.
Sinoatrial Conduction Time
The response of the sinus node to induced atrial premature depolarizations (APDs) has been used as an indirect method to evaluate sinoatrial conduction.17,29,30,31,32,33,34 This method of evaluation involves the introduction of progressively premature APDs (A2) after every eighth to tenth beat of a stable sinus rhythm (A1-A1) and measurement of the first (A2-A3) and second (A3-A4) return cycles. Measurement A3-A4 allows one to assess the presence of depression of automaticity, which may be responsible for a variable component of the first return cycle. Four zones of response to APDs have been identified (Fig. 3-2). They can be best demonstrated by plotting the coupling interval of the APD (A1-A2) versus the return cycle (A2-A3) (Fig. 3-3). Many investigators prefer to normalize those values by dividing them by the spontaneous sinus cycle length (A1-A1) and deriving a percentage.
Zone I is the range of A1-A2 intervals at which the return cycle (A2-A3) is fully compensatory, that is, A1-A2 + A2-A3
(A1-A3) = 2 (A1-A1) (Fig. 3-4A). Zone I usually occurs in response to APDs falling in the last 20% to 30% of the spontaneous cycle length. Zone I is variously referred to as the zone of collision, interference, or nonreset because the mechanism of the response is a collision of the spontaneous sinus impulse with the stimulated atrial impulse (A2). Because the sinus pacemaker is therefore unaffected by A2, the subsequent sinus beat occurs “on time.”
(A1-A3) = 2 (A1-A1) (Fig. 3-4A). Zone I usually occurs in response to APDs falling in the last 20% to 30% of the spontaneous cycle length. Zone I is variously referred to as the zone of collision, interference, or nonreset because the mechanism of the response is a collision of the spontaneous sinus impulse with the stimulated atrial impulse (A2). Because the sinus pacemaker is therefore unaffected by A2, the subsequent sinus beat occurs “on time.”
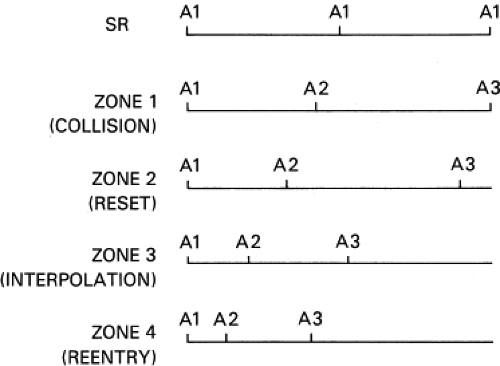 FIGURE 3-2 Response of the sinus node to atrial premature depolarizations (APDs). Four zones of response are seen. A1-A1 is the spontaneous sinus cycle length. In zone 1 an APD (A2) delivered late in the cardiac cycle does not affect the sinus node, as manifested by the next sinus beats (A3) occurring on time. In zone II, a more premature A2 results in resetting of the sinus node so that A3 occurs early although A2-A3 is greater than A1-A1 owing to conduction time between the atrium and sinus node. In zone III, A2 results in a return cycle (A3) that is early. Since A2-A3 is less than A1-A1, that is, A2 is interpolated. In zone IV, A2 results in an even earlier return cycle, so that A1-A2 + A2-A3 < A1-A1 is consistent with sinus node reentry. See text for discussion. |
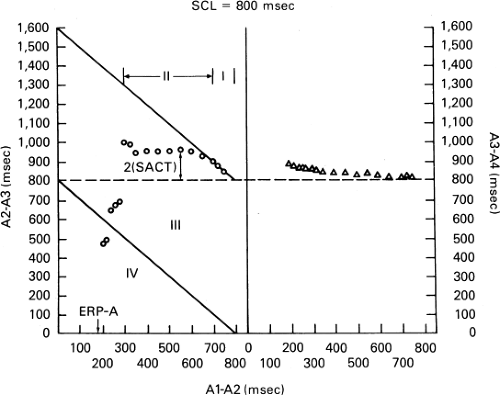 FIGURE 3-3 Graphic display of sinus node response to atrial premature depolarizations (APDs). The spontaneous sinus cycle length (SCL) is 800 msec. The coupling intervals of the APD (A1-A2) are plotted on the abscissa, and the first return cycles (A2-A3, open circles) and the second return cycles (A3-A4, open triangles) are plotted on the ordinate. The upper and lower diagonal lines represent the lines of full compensatory pause (A1-A3 = 2[A1-A1]) and complete interpolation (A1-A3 = A1-A1), respectively. The horizontal dashed line is the SCL. In zone I, the responses fall along the line of compensatory pauses. In zone II they move off the line of compensatory pauses and produce a plateau in the curve. The difference between the A2-A3 of the plateau and the SCL is presumed to represent conduction time into and out of the sinus node. One-half of this difference is therefore taken as the sinoatrial conduction time (SACT). In zone III the return cycles lie between the line of complete interpolation and the SCL, and in zone IV the return cycles fall below the line of interpolation. ERP-A, atrial effective refractory period. See text for further discussion. |
Zone II is the range of A1-A2 intervals at which reset of the sinus pacemaker occurs, resulting in an A2-A3 that exceeds the basic sinus cycle. However, the sum of A1-A2 and A2-A3 (A1-A3) is less than 2 (A1-A1); that is, it is less than compensatory (Fig. 3-4B). Zone II is a zone of long duration, typically occupying 40% to 50% of the cardiac cycle. In most patients, the pause (A2-A3) remains constant throughout zone II, producing a plateau in the curve. The plateau results because A2 penetrates the sinus node and resets the pacemaker without changing pacemaker automaticity. Because the duration of the return cycle (A2-A3) depends on conduction time into and out of the sinus node and sinus automaticity, the difference between A2-A3 and A1-A1 has been taken as an estimate of total sinoatrial conduction time. Conventionally, it has been assumed that conduction into and out of the sinus node is equal, resulting in the calculation of sinoatrial conduction time (SACT) as A2-A3-A1-A/-2 (Fig. 3-5).25 Data suggest,
however, that this assumption is not valid. Although some investigators initially demonstrated that conduction into the node is slower than conduction out of the node, later data showed that this is not true during sinus rhythm. Studies in isolated rabbit atria using multiple simultaneous microelectrodes have shown that conduction time out of the sinus node is greater than conduction time into the node.35,36,37,38 These data using multiple microelectrode recordings obviate many of the limitations of earlier studies and are probably correct. Direct recording from the sinus node confirms this (see following). Under certain conditions, however, conduction time into the node is slower than out of the node. Conduction time into the node is determined by an unquantifiable extent by conduction through atrial and perinodal tissue, which in turn is related to the distance of the site of stimulation from the sinus node and atrial refractoriness. Therefore, the site of stimulation is critical. The farther the site of stimulation from the sinus pacemaker site, the greater the overestimation of SACT. In addition, the more premature an APD, the more likely it will encroach on perinodal and/or refractoriness, which will slow conduction into the node. Early APDs commonly cause pacemaker shift to a peripheral latent pacemaker, which can excite
the atrium earlier because of its proximity to that tissue; hence, conduction out of the node appears more rapid.36,38,39,40,41 Despite these limitations, for practical purposes the SACT is a reasonable estimate of functional SACT, providing that stimulation is performed as close as possible to the sinus node and the measurement is taken when a true plateau is present in zone II. We usually take the measurement in the first third of zone II responses. In our laboratory, where patients range from 12 to 98 years of age, the normal SACT ranges from 45 to 125 msec.
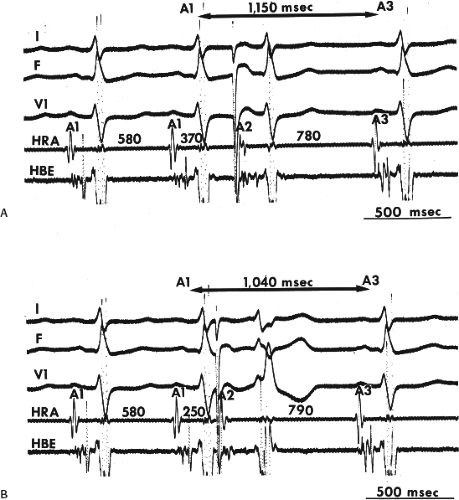 FIGURE 3-4 Analog records of zones I and II. From top to bottom: ECG leads I and V1, and intracardiac electrograms from the high-right atrium in the area of the sinus node (HRA) and at the His bundle recording sight (HBE). The sinus cycle (A1-A1) is 580 msec. A: An APD (A2) is delivered at a coupling interval (A1-A2) of 370 msec. The return cycle (A3) is fully compensatory. B: At a shorter coupling interval (A1-A2 = 250 msec), the return cycle falls along the plateau of zone II. The A2-A3 (790) − A1-A1 (580) = conduction time of A2 into and out of the sinus node (210 msec); that is, SACT = 105 msec. |
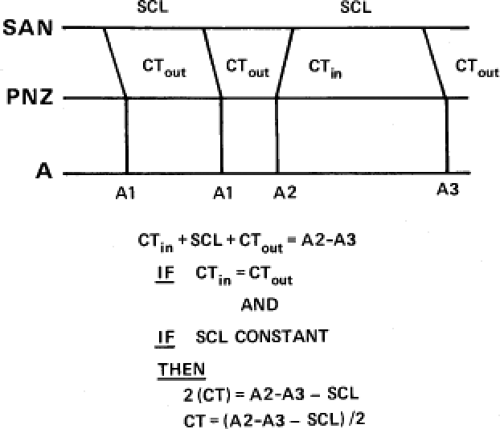 FIGURE 3-5 Assumptions in the calculation of sinoatrial conduction time. SCL, sinus cycle length; SAN, sinoatrial node; PNZ, perinodal zone; A, atrium; CT, conduction time; A1-A1, SCL; A2, atrial premature depolarization; A3, sinus return cycle. See text for further discussion. |
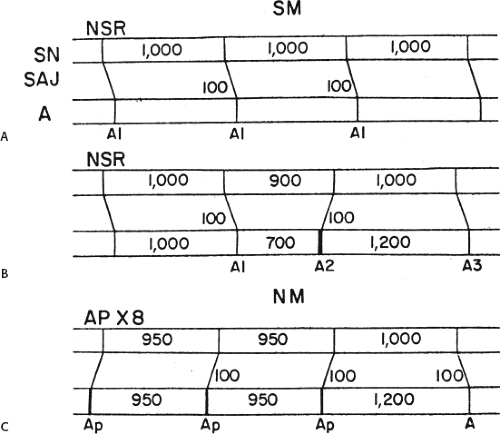 FIGURE 3-6 Schematic of Strauss method and Narula method for determining sinoatrial conduction time. A and B: The Strauss method (SM). C: The Narula method. Each panel shows the sinus node (SN), sinoatrial junction (SAJ), and atrium (A). A: Sinus rhythm (NSR) is shown with A1-A1 equal in the sinus rate. B: An extrastimulus (A2) is delivered at 700 msec. It takes approximately 100 msec to read the sinus node, which gives rise to A3. The conduction into and out of the sinus node is assumed to be 100 msec, giving an A2-A3 of 1,200 msec. C: Atrial pacing (AP) for eight beats at a cycle length of 950 msec is performed with the sixth, seventh, and eighth paced complexes (Ap) shown. The last Ap takes 100 msec to get to the sinus node, resets the sinus node, leading to the subsequent atrial impulse. The SACT 100 msec also is depicted as an Ap-A interval of 1,200 msec. |
The SACT appears to be independent of spontaneous cycle length,34,42 although one report has shown an inverse relationship.43 Marked sinus arrhythmia invalidates the calculation of SACT by APDS, because it is impossible to know whether the return cycle is as a result of spontaneous oscillation or a result of the induced APD. In the presence of mild sinus arrhythmia, this limitation may be partially overcome by performing multiple tests at each coupling interval. Still, the presence of even small degrees of sinus arrhythmia may produce errors in the measurement of SACT.
In an attempt to eliminate the effects of sinus arrhythmia, two other methods have been employed. Narula et al.44 proposed that brief (eight-beat) periods of atrial pacing at rates just above sinus should be used instead of atrial extrastimuli delivered during sinus rhythm. The difference between the postpacing pause and the sinus cycle length would equal the SACT. The Strauss17 and Narula methods44 are schematically compared in Figure 3-6. Preliminary data from Breithardt and Seipel45 comparing the two methods demonstrate that they are not always equivalent. Other studies show a reasonable correlation.46,47,48 Reasons for differences may relate to the paced cycle length used for the Narula method. Inoue et al.48 found that the correlation is best if pacing is performed 100 msec less than the sinus cycle length. If pacing is performed within 50 msec of the sinus cycle length, sinus acceleration occurs.49 Thus, the postpacing sinus cycle length should be used as the control cycle length to compute the SACT if the Narula method is used. Other problems with both techniques include depression of automaticity, pacemaker shifts, sinus entrance block, and shortening of sinus action potential leasing to earlier onset of phase 4, each of which can give misleading results. We have found both techniques to give fairly comparable results in normal persons, particularly (but not necessarily) when cycle lengths of at least 50 msec less than sinus are used (Fig. 3-7). A second method for circumventing sinus arrhythmia is the use of atrial extrastimuli during atrial pacing. Kirkorian et al.50 showed a close correlation of this method and the Strauss method. Further studies are required to corroborate these findings. Most studies using normal persons have shown that atropine with or without propranolol shortens the SACT unrelated to its effect on heart rate.18,42,51,52,53,54
In an occasional patient in response to progressively premature APDs, A2-A3 either continuously increases or increases after a brief plateau phase (in either instance, the pause remains less than compensatory). The progressive increase in A2-A3 during this zone may be due to any
of the following factors, either singly or in combination: (a) suppression of sinus pacemaker automaticity, (b) shift to a slower latent pacemaker, or (c) increase in conduction time into the sinus node that is due to A2 encountering perinodal tissue refractoriness. Thus, we recommend that the earliest third of zone II be used to measure the SACT because it is less likely to introduce errors that are due to any of those three factors. Analysis of postreturn cycles (A3-A4) may provide insight into changes in automaticity or pacemaker shift.41,55 An A3-A4 greater than A1-A1 suggests depression of automaticity; in this instance, SACT calculated from A2-A3 yields an overestimation of the true SACT. Correction or exclusion of SACT using A2-A3 in the presence of an A3-A4 greater than A1-A1 is necessary. In this case, using A3-A4 as the basic sinus cycle length to which A2-A3 is compared will help correct a falsely prolonged SACT if A2-A3 were related to the prior sinus cycle length (A1-A1).
of the following factors, either singly or in combination: (a) suppression of sinus pacemaker automaticity, (b) shift to a slower latent pacemaker, or (c) increase in conduction time into the sinus node that is due to A2 encountering perinodal tissue refractoriness. Thus, we recommend that the earliest third of zone II be used to measure the SACT because it is less likely to introduce errors that are due to any of those three factors. Analysis of postreturn cycles (A3-A4) may provide insight into changes in automaticity or pacemaker shift.41,55 An A3-A4 greater than A1-A1 suggests depression of automaticity; in this instance, SACT calculated from A2-A3 yields an overestimation of the true SACT. Correction or exclusion of SACT using A2-A3 in the presence of an A3-A4 greater than A1-A1 is necessary. In this case, using A3-A4 as the basic sinus cycle length to which A2-A3 is compared will help correct a falsely prolonged SACT if A2-A3 were related to the prior sinus cycle length (A1-A1).
Zones III and IV are ranges of A1-A2 at which the A2-A3 shortens to less than A1-A1. Two types of early responses are found in these zones. The responses in zone III are termed complete and incomplete interpolation, and they include those in which A2-A3 is less than A1-A1 and A1-A3 is less than 2 (A1-A1) (see Fig. 3-3). The coupling interval at which incomplete interpolation is first observed defines the refractory period of the perinodal tissue. Some investigators refer to this as the sinus node refractory period. In this instance, A3 represents delay of A1 exiting the sinus node, which has not been affected. The A1-A2 at which complete interpolation is observed probably defines the effective refractory period of the most peripheral of the perinodal tissue, because the sinus impulse does not encounter refractory tissue on its exit from the sinus node. In this instance, A1-A2 + A2-A3 = A1-A1, and sinus node entrance block is said to exist. In our laboratory, zone II responses can be seen in 15% of patients using the Strauss method. This has ranged from 13% to 46%.30,50,56 In two studies using atrial pacing and premature stimuli to evaluate SACT and “sinus node refractoriness,” zone III responses were observed in 65% and 85%.50,57 They also demonstrated an increase in sinus node refractoriness at decreasing paced cycle lengths. Increased perinodal refractoriness may have been responsible for their high incidence of zone III responses. Kerr and Strauss.57 found the refractory period of the sinoatrial node to be 325 ± 39 msec at a paced cycle length of 600 msec in normals and 522 ± 20 msec at the same cycle length in patients with sinus node dysfunction. Autonomic blockade shortens the refractory period. More work is necessary to establish the utility of these measurements.
A second type of early response, which defines zone IV is due to sinus node reentry. This response by definition occurs when A1-A2 + A2-A3 is less than A1-A1 (Fig. 3-8) and the atrial activation sequence and P-wave morphology are identical to sinus. Dhingra et al.30 found sinus node reentry in 11% of patients. In our laboratory, the incidence of this finding is similar (10%).
A wide range of “normal” values of SACT has been reported (Table 3-1). This, in large part, reflects the inherent limitations of these indirect methods. Even after autonomic blockade, the range of “normals” reflects the previously described fallibility of the assumptions of indirect measurements as well as the variability of pacing site relative to the site of sinus impulse formation.
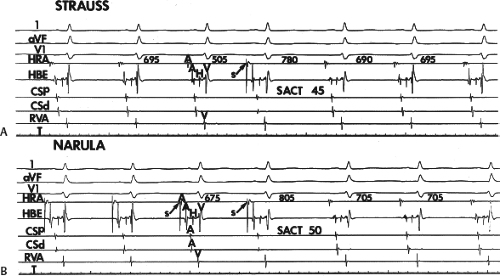 FIGURE 3-7 Analog records comparing the Strauss and Narula methods for determining sinoatrial conduction time (SACT). A and B: From top to bottom, leads 1, aVF, and V1, electrograms from the high-right atrium (HRA), His bundle electrogram (HBE), proximal and distal coronary sinus (CSp, CSd), and right ventricular apex (RVA) are shown. Time lines, T. A: The sinus cycle length approximates 695 msec. A premature stimulus (arrows) delivered at 505 msec resents the sinus node. The SACT reveals difference between the return cycle length and the sinus cycle of 90 msec divided by 2 = 45. B: The same patient is paced at a cycle length of 675 msec leading to a postdrive return cycle length of 805 msec followed by a sinus cycle length of 705 msec. The 100 msec difference divided by 2 gives rise to an SACT of 50 msec. Thus, in this patient the two methods are comparable. T, time line. |
Sinus Node Electrogram
In view of the limitations of indirect methods to assess sinoatrial conduction and the assumptions that are necessarily required to derive the SACT, a method of directly recording a sinus node electrogram was developed by Cramer et al.,58 who identified extracellular potential changes associated with directly recorded electrical activity of the sinus pacemaker in isolated rabbit atria. Further work using endocardial recordings from the intact canine heart confirmed the ability to record diastolic phase 4 slope, followed by slow upstroke culminating in a rapid atrial electrogram.59 Subsequently, several investigators developed techniques to record electrograms from human subjects with and without sinus node dysfunction.46,60,61,62 To record sinus node electrograms, one can use catheters with 0.5- to 1.5-cm interelectrode distances. Two techniques have been employed; in one the catheter is positioned at the junction of the superior vena cava and right atrium in the region of the sinus node, and the other – which appears more reliable and from which more stable recordings can be obtained – requires that the catheter be looped in the right atrium with firm contact at the region of the superior vena cava and atrial junction (Fig. 3-9). This latter method, which produces firm contact against the atrial wall, produces an atrial injury potential simultaneously with the recording of the sinus node electrogram. The reported frequency for obtaining node electrograms ranges considerably, from 40% to 90%. Those studies using methods similar to the second method report higher success rates. In addition, filter settings play a prominent role in the ability to record stable electrograms that are not obscured by marked baseline drift. Use of low end (high-pass filters) of less than 0.1 Hz (0.01 to 0.05 Hz) is associated with marked baseline drift and difficulty in interpretation of the recordings. Use of low-end filter settings of 1 Hz or more produces diminution or loss of the sinus node electrogram. Thus, the low-end filter used should be between 0.1 and 0.6 Hz. The high-end or low-pass filter frequency can be set at 20 or 50 Hz, the latter being more commonly employed. The signal then must be gained using a range of 50 to 100 μV/cm. Using these techniques, which are time consuming, a stable sinus node electrogram without significant baseline shift can be recorded. However, in my opinion, the frequency and ease with which this recording can be made have been exaggerated. We obtained stable sinus node electrograms in only 50% of an unselected population of patients. It has been recognized that factors that produce encroachment of the T and U wave on the P wave make it
difficult to record and/or measure sinus node electrograms. These factors include sinus tachycardia, prolonged A-V conduction, long QT syndromes, and large prominent U waves. If such patients are included in the unselected population of patients in whom sinus node electrogram requirements are attempted, the incidence of adequate recordings will be markedly diminished. Baseline drift is an important problem in preventing the recording of stable electrograms for measurements. Such drifts are more marked in young children and in those with significant cardiopulmonary disease and exaggerated respirations. Such baseline sinus drift can be obviated by using a low-end filter frequency of 0.6 Hz.
difficult to record and/or measure sinus node electrograms. These factors include sinus tachycardia, prolonged A-V conduction, long QT syndromes, and large prominent U waves. If such patients are included in the unselected population of patients in whom sinus node electrogram requirements are attempted, the incidence of adequate recordings will be markedly diminished. Baseline drift is an important problem in preventing the recording of stable electrograms for measurements. Such drifts are more marked in young children and in those with significant cardiopulmonary disease and exaggerated respirations. Such baseline sinus drift can be obviated by using a low-end filter frequency of 0.6 Hz.
TABLE 3-1 Normal Upper Limits for Sinoatrial Conduction Time (SACTa, msec) | |||||||||||||||||||||||||||||||||||||||||||||||||||
|---|---|---|---|---|---|---|---|---|---|---|---|---|---|---|---|---|---|---|---|---|---|---|---|---|---|---|---|---|---|---|---|---|---|---|---|---|---|---|---|---|---|---|---|---|---|---|---|---|---|---|---|
| |||||||||||||||||||||||||||||||||||||||||||||||||||
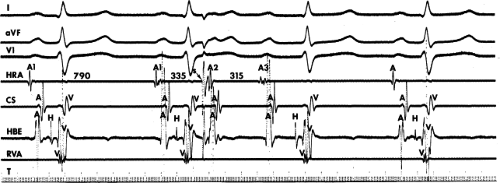 FIGURE 3-8 Sinus node echo in response to atrial premature depolarization (APD). ECG leads 1, aVF, and V1 are displayed with electrograms from the high-right atrium (HRA), coronary sinus (CS), His bundle (HBE), and right ventricular apex (RVA). An APD (A2) is introduced at a coupling interval of 335 msec. There is an early return beat (A3), with an atrial activation sequence and P-wave morphology identical to that of sinus rhythm. Since the A1-A3 (650 msec) is less than the spontaneous sinus cycle length (790 msec), A3 is probably due to reentry in the region of the sinus node. |
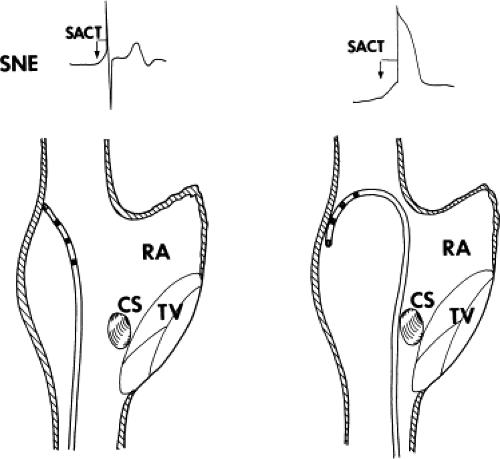 FIGURE 3-9 Schema of methods for obtaining sinus node electrograms. The right atrium is depicted with a catheter in the region of the sinus node. Tricuspid valve (TV), coronary sinus (CS), and right atrial appendage (RA) are shown. In the left panel, where the catheter is merely positioned with the tip touching the region of the sinus node, one gets a sinus node electrogram (SNE) and calculated sinoatrial conduction time (SACT), as shown in the upper left. On the right, a second method of obtaining the sinus node electrogram is shown with a catheter-looped positioning of the recording electrodes at the sinus node area. The pressure caused by the looped catheter produces more of a monophase type of signal with a calculated SACT, as shown in the upper right. |
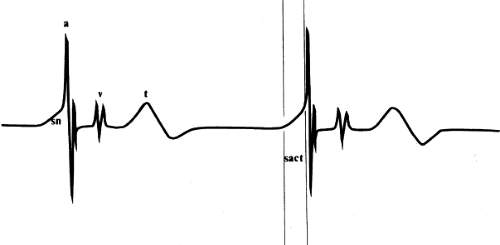 FIGURE 3-10 Schematic illustration showing the direct measurement of sinoatrial conduction time (SACT). A schematic copy of a sinus node electrogram (SNE) is shown. On the SNE, high-right atrial depolarization (a), ventricular depolarization (v), the T wave (t), and the sinus node potential (sn) are identified. In the second beat, reference lines are drawn through the point at which the SN potential first becomes evident and the point at which atrial activation begins. The SACT is the interval between these two reference lines. (From Reiffel JA, Gang E, Gliklich J, et al. The human sinus node electrogram: a transvenous catheter technique and a comparison of directly measured and indirectly estimated sinoatrial conduction time in adults. Circ 1980;62:1324.) |
The SACT is measured as the interval between the pacemaker prepotential on the local electrogram and the onset of the rapid atrial deflection (Fig. 3-10). When SACT is normal, a smooth upstroke slope merges into the atrial electrogram (see Fig. 3-10). When sinoatrial conduction is slowed, an increasing amount of the sinus node potential becomes visible before the rapid atrial deflection is inscribed. Sinoatrial block is said to occur when the entire sinus node electrogram is seen in the absence of a propagated response to the atrium. These patterns are schematized in Figure 3-11. Validation of sinus node electrograms has included (a) the ability to record in only a local area,46,61,62 (b) loss of the upstroke potential during overdrive atrial pacing,46,63 and (c) the persistence of sinus node electrograms (with or without prior prolongation) following CSP, following induced pauses, or during pauses following overdrive suppression.46,64,65 This latter finding in fact both defines and validates the concept of sinoatrial exit block. Another aspect of the sinus node electrogram that has been evaluated is the total time of diastolic depolarization.63
Stay updated, free articles. Join our Telegram channel

Full access? Get Clinical Tree


