Fig. 1
(a) Serum and (b) BALF content of HMGB-1 protein in healthy subjects, and in non-small cell lung cancer (NSCLC) and Besnier-Boeck-Schaumann (BBS) patients

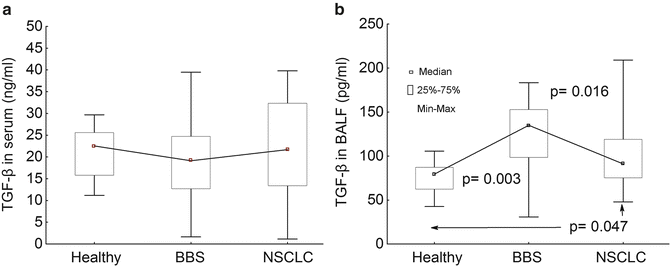
Fig. 2
(a) Serum and (b) BALF content of TGF-β protein in healthy subjects, and in non-small cell lung cancer (NSCLC) and Besnier-Boeck-Schaumann (BBS) patients
3.2 ROC Curve Analysis
The lowest values in the AUC were found for HMGB-1 and TGF-β in sera of both NSCLC and BBS patients (NSCLC 0.597/BBS 0.560 and NSCLC 0.667/BBS 0.580, respectively). Power of the diagnostic determination of HMGB-1 and TGF-β in sera of patients with NSCLC and BBS is rather small; on average, AUC = 0.678 and AUC = 0.694 for HMGB-1 in BALF of NSCLC and BBS patients, respectively. With respect to TGF-β in BALF of NSCLC patients, power of the diagnostic determination was significantly higher than that in healthy subjects (p = 0.012). In contrast, the AUC of TGF-β in BALF of BBS patients was low (0.502). Differences between the AUC for TGF-β in BALF of patients with NSCLC and BBS were significant (p = 0.001) (Fig. 2).
3.3 Correlation of HMGB-1 and TGF-β in Serum and BALF of NSCLC with Clinicopathological Features
In the NSCLC group, a positive correlation was found between the levels of HMGB-1 in BALF and serum (r = 0.339, p = 0.036). In addition, there were positive correlations between HMGB-1 and TGF-β in sera and in BALF of NSCLC patients; r = 0.412, p = 0.002 and r = 0.534, p = 0.04, respectively.
The concentration of HMGB-1 in the NSCLC group was significantly higher in patients younger than 60 years of age (p = 0.047) (Table 1). Higher levels of HMGB-1 in sera and TGF-β in BALF were present in men compared with women. HMGB-1 was significantly higher in BALF of NSCLC patients who had distant metastases. HMGB-1 and TGF-β in sera and BALF of NSCLC patients failed to correlate with any other clinicopathological features. However, HMGB-1 in both sera and BALF were higher in clinical stage IIIB than stage IV of NSCLC. Conversely, TGF-β showed a decreasing trend with increasing clinical stage in these patients.
Table 1
Correlation between HMGB-1 and TGF-β levels in sera and BALF of NSCLC and clinicopathological features
n | HMGB-1 | TGF-β | |||
|---|---|---|---|---|---|
Serum (ng/ml) | BALF (ng/ml) | Serum (ng/ml) | BALF (pg/ml) | ||
r | r | r | r | ||
p | p | p | p | ||
Age | |||||
<60 ys | 21 | −0.303 | 0.078 | −0.031 | 0.055 |
>60 ys | 24 | 0.047 | 0.978 | 0.714 | 0.821 |
Gender | |||||
Male | 38 | −0.233 | −0.273 | 0.088 | 0.715 |
Female | 7 | 0.014 | 0.391 | 0.418 | 0.020 |
Histological type | |||||
SCC | 22 | −0.233 | 0.193 | 0.064 | −0.017 |
Adenocarcinoma | 20 | 0.660 | 0.903 | 0.847 | 0.430 |
Large cell carcinoma | 3 | ||||
Primary tumor site (T) | |||||
1 | 1 | ||||
2 | 15 | −0.165 | −0.077 | −0.232 | −0.253 |
3 | 7 | 0.336 | 0.203 | 0.362 | 0.089 |
4 | 22 | ||||
Lymph node involvement (N) | |||||
0 | 2 | ||||
1 | 3 | 0.302 | −0.003 | −0.198 | −0.010 |
2 | 19 | 0.128 | 0.291 | 0.318 | 0.824 |
3 | 21 | ||||
Distant metastasis (M) | |||||
0 | 16 | −0.088 | 0.583 | −0.023 | −0.043 |
1a | 14 | 0.135 | 0.031 | 0.525 | 0.618 |
1b | 15 | ||||
Distant metastasis | |||||
Opposite lung | 14 | −0.073 | 0.017 | −0.359 | 0.425 |
Liver | 3 | 0.566 | 0.923 | 0.037 | 0.017 |
Other | 12 | ||||
Clinical stage | |||||
IIIB | 13 | 0.131 | 0.035 | −0.320 | 0.039 |
IV | 27 | 0.153 | 0.299 | 0.346 | 0.678 |
There was a downward trend in HMGB-1 levels with decreasing effectiveness of therapy. HMGB-1 was the highest in BALF of NSCLC patients with partial response to chemotherapy, lower in stable disease, and the lowest in progressive disease, although these differences did not achieve statistical significance. In patients with stable disease, TGF-β level was the lowest in sera and the highest in BALF.
3.4 BALF Cells Analysis
There was a positive correlation between HMGB-1 and CD4+ in BALF of BBS patients (r = 0.766, p = 0.027). Furthermore, in healthy controls, HMGB-1 level was inversely related to the number of lymphocytes (r = −0.659, p = 0.05). In the NSCLC group, there was a positive correlation between the concentration of TGF-β and the number of epithelial cells (r = 0.347, p = 0.030), neutrophils (r = 0.530, p = 0.001), and eosinophils (r = 0.420 p = 0.008), and a negative correlation with the number of macrophages (r = −0.415, p = 0.009). These results BALF fluid analysis are summarized in Table 2.
Table 2
Correlation between HMGB-1 and TGF-β in sera and BALF, and cell type in BALF of NSCLC patients
NSCLC (n = 45) | BBS (n = 23) | Healthy controls (n = 15) | ||||
|---|---|---|---|---|---|---|
HMGB-1 (ng/ml) | TGF-β (pg/ml) | HMGB-1 (ng/ml) | TGF-β (pg/ml) | HMGB-1 (ng/ml) | TGF-β (pg/ml) | |
r | r | r | r | r | r | |
p | p | p | p | p | p | |
Cells amount × 104/ml | −0.007 | −0.116 < div class='tao-gold-member'>
Only gold members can continue reading. Log In or Register to continue
Stay updated, free articles. Join our Telegram channel
Full access? Get Clinical Tree
 Get Clinical Tree app for offline access

| ||||