Fig. 1.1
The generic process behind any modern medical imaging system, including MRI
Nuclear Spin in a Magnetic Field
Hydrogen has a nuclear property known as “spin” that results in a magnetic moment, μ. Because of this magnetic moment, when exposed to the static magnetic field (B0) generated by the main magnet of the MRI system, hydrogen nuclei will align parallel or anti-parallel to the field as shown in Fig. 1.2. The energy difference (E) between these two orientations is E = 2μB0. The small preference for the hydrogen nuclei to align toward the parallel, lower energy state, over the anti-parallel orientation, contributes to the development of the net longitudinal magnetization [1]. The net magnetization is the vector sum of magnetic moments from many individual protons.


Fig. 1.2
The alignment of a majority of spins (hydrogen nuclei, i.e., protons) with a strong magnetic field generates a net longitudinal magnetization
Larmor Frequency
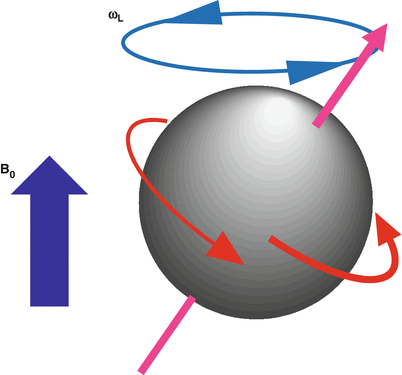
When a hydrogen nucleus is exposed to a magnetic field of strength B0, it precesses at a frequency, ω, due to the interaction of its angular momentum and the field, as illustrated in Fig. 1.3. The frequency, ω, depends on B0 and on the gyromagnetic ratio, γ, of the specific nucleus according to the Larmor Eq. 1.1.


For hydrogen nuclei, γ/2π = 42.58 MHz/T, and ωL is termed the Larmor frequency. Thus, the Larmor frequency of precession is dependent on the applied magnetic field strength; for example, protons will precess at approximately 64 MHz at 1.5T, and 128 MHz at 3.0T.

Fig. 1.3
Spins precess at a frequency, ω, that depends on the externally applied magnetic field, B0, and the gyromagnetic ratio, γ, of the particular nuclei. The gyromagnetic ratio for hydrogen is 42.58 MHz/T

(1.1)
Excitation of Spins
In a three-dimensional (x, y, z) coordinate system, let us assume by convention that the static magnetic field is oriented in the z-direction. As a result, the net longitudinal magnetization vector at equilibrium (M0) will point in the z-direction as shown in Fig. 1.4a; this is due to the alignment of a majority of protons with the applied field.


Fig. 1.4
Schematics showing (a) the direction of the main magnetic field and longitudinal magnetization, (b) nutation of a spin from the longitudinal axis to the transverse plane in response to an applied RF field (B1) (c) the final result of tipping all of the longitudinal magnetization by flip angle α = 90° into the transverse plane
Protons can be excited to the higher energy state by applying a radio frequency (RF) field oscillating at the Larmor frequency; this applied RF field is known as the B1 field. The magnitude of the net longitudinal magnetization in the z-direction is extremely small compared to the magnetic field strength, B0, and is undetectable. In order to measure a detectable signal from protons, the magnetization is tipped out of alignment with B0 and into the transverse plane. When an RF pulse is applied at the Larmor frequency, i.e., a B1 field is switched on briefly as shown in Fig. 1.4b, the net magnetization vector will respond and be tipped away from the z-axis and towards the x-y transverse plane (Fig. 1.4c). The angle that the magnetization vector rotates away from the z-axis is known as flip angle (α), and can be approximated as

where τ represents the length of time the RF pulse is applied with amplitude B1.

(1.2)
When the RF pulse is terminated, the net magnetization will begin to return back to the longitudinal axis as the protons return to equilibrium by releasing energy to the environment, a process known as relaxation as termed by Felix Bloch, one of the discoverers of the nuclear magnetic resonance phenomenon that forms the basis for MRI. Before the protons fully relax back to equilibrium, the signal generated by the transverse component of the precessing magnetization can be detected using an RF receiver coil.
MR Signal and Contrast Characteristics from Spin Relaxation
The MRI signal available from stationary tissue is determined by a combination of factors, including the density of protons and their relaxation rates; depending on the specific pulse sequence parameters, the image contrast will reflect these as well as many other factors such as flow and motion, diffusion, local differences in magnetic susceptibility and field homogeneity. Two types of relaxation take place: longitudinal, spin-lattice or T1 relaxation, and transverse, spin-spin, or T2 relaxation. The extent that T1 and T2-relaxations and proton density contribute to image intensity and contrast is controlled through manipulation of pulse sequence timing and RF pulse flip angles as explained in later chapters.
Longitudinal Relaxation (Spin-Lattice Relaxation)
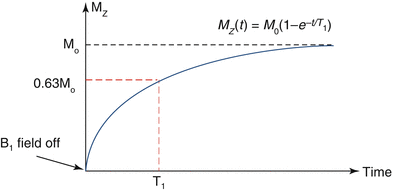
The spin lattice relaxation time, or T1, is the characteristic tissue-specific exponential time constant that governs the regrowth of longitudinal magnetization (Mz) towards its equilibrium value, M0 (Fig. 1.5). T1 is the time required for Mz to regain 63 % of its equilibrium value when starting from zero, e.g., following the application of a 90° excitation pulse that tips the longitudinal magnetization completely into the transverse plane; this can be expressed as:


where t is the time following the excitation pulse.

Fig. 1.5
Schematic illustrating T1 recovery curve. T1 relaxation constant defines the time to regain 63 % of longitudinal magnetization following a 90° excitation pulse

(1.3)
Longitudinal, spin-lattice relaxation is caused by the transfer of thermal energy between excited nuclei and the surrounding atomic lattice [2]. Molecules that have an efficient means of energy transfer will exhibit a shorter T1 relaxation time, while those without effective transfer mechanisms demonstrate a longer T1 time. This is primarily dependent on the mobility of the lattice, and the related vibrational and rotational frequencies. The more closely these frequencies correspond to the energy gap, E, and the Larmor frequency, the more efficient is T1 relaxation. Thus, T1 relaxation is highly dependent on molecular motion, and hence, on the size of the molecules. The motion of very large molecules generally occurs at a frequency too low for efficient energy transfer, and likewise extremely mobile nuclei such as those in free water are moving at frequencies too high to facilitate relaxation; thus the T1 values of fluids are relatively long, while fat tissues demonstrate shorter T1 values [3].
T1 Differences Determine Image Contrast
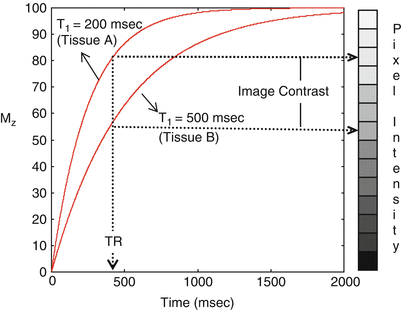
As an example, consider tissues A and B shown in Fig. 1.6; tissue A has a shorter T1 relaxation time than tissue B, i.e., the longitudinal magnetization of tissue A will recover and realign with the main magnetic field more quickly than tissue B following RF excitation. After a 90° RF pulse, the magnetization vectors for both tissues A and B are tipped into the transverse plane and from there the longitudinal magnetization begins to recover. Magnetic resonance imaging typically requires multiple excitation pulses to collect all of the data needed to form an image; if the next excitation pulse is applied before full recovery occurs (which takes approximately five times T1), tissue A will have recovered more longitudinal magnetization than tissue B. Since tissue A has a larger longitudinal component prior to the next RF pulse, it will have a larger transverse component after the RF pulse, and therefore tissue A will have a higher signal than tissue B, and will appear brighter in the image as shown in Fig. 1.6. Thus, in a pulse sequence designed to generate image contrast sensitive to T1, i.e., a T1-weighted image [4], tissues with shorter T1 will have higher signal than tissues with longer T1. Table 1.1 shows the T1 values for various tissues at 1.5T [5].


Fig. 1.6
Difference in T1 relaxation times between example tissues A (T1 = 200 ms) and B (T1 = 500 ms) leads to a difference in longitudinal magnetization at time TR. This difference is used to generate contrast between the tissues in a T1-weighted image
< div class='tao-gold-member'>
Only gold members can continue reading. Log In or Register to continue
Stay updated, free articles. Join our Telegram channel

Full access? Get Clinical Tree


