The aim of this study was to assess whether serial quantitative assessment of right ventricular (RV) function by speckle-based strain imaging is affected by pulmonary hypertension–specific therapies and whether there is a correlation between serial changes in RV strain and clinical status. RV longitudinal systolic function was assessed using speckle-tracking echocardiography in 50 patients with pulmonary arterial hypertension (PAH) before and after the initiation of therapy. The mean interval to follow-up was 6 ± 2 months. Subsequent survival was assessed over 4 years. Patients demonstrated a mean increase in RV systolic strain from −15 ± 5 before to −20 ± 7% (p = 0.0001) after PAH treatment. Persistence of or progression to a severe reduction in free wall systolic strain (<−12.5%) at 6 months was associated with greater disease severity (100% were in functional class III or IV vs 42%, p = 0.005), greater diuretic use (86% vs 40%, p = 0.02), higher mean pulmonary artery pressure (67 ± 20 vs 46 ± 17 mm Hg, p = 0.006), and poorer survival (4-year mortality 43% vs 23%, p = 0.002). After adjusting for age, functional class, and RV strain at baseline, patients with ≥5% improvement in RV free wall systolic strain had a greater than sevenfold lower mortality risk at 4 years (hazard ratio 0.13, 95% confidence interval 0.03 to 0.50, p = 0.003). In conclusion, serial echocardiographic assessment of RV longitudinal systolic function by quantitative strain imaging independently predicts clinical deterioration and mortality in patients with PAH after the institution of medical therapy.
Pulmonary arterial hypertension (PAH) is characterized by progressive pulmonary vascular remodeling and increased right-sided cardiac pressures, leading to right heart failure and death. Symptoms and degree of right heart failure are predictive of mortality. Although a number of measures of right atrial (RA) pressure and right ventricular (RV) dysfunction correlate with clinical status and predict survival, the optimal measure to quantitate RV systolic function is unclear. Right-sided cardiac catheterization provides key pressure- and flow-derived information, but it is invasive and impractical for serial assessment. Assessment of RV size and function using conventional echocardiography is challenging, and measures of transverse and radial motion do not accurately represent RV systolic function, given the complex geometry of the right ventricle and the predominately longitudinal orientation of its myofibrils. Tricuspid annular displacement, a measure of longitudinal RV motion, although prognostically valuable in PAH, is prone to error due to translational motion and represents only annular movement. Speckle-tracking echocardiography is an angle-independent technique for quantifying myocardial motion in PAH. RV longitudinal peak systolic strain has recently been shown to predict right heart failure, clinical deterioration, and mortality in patients with newly diagnosed PAH before treatment. Whether serial strain assessment of the right ventricle in patients with PAH could be used to restage the severity of RV dysfunction and whether such measures remain predictive of mortality in patients receiving PAH-specific therapy is unknown.
Methods
We studied consecutive patients with PAH (age ≥18 years), first seen at Mayo Clinic Rochester, from December 2003 to March 2006, naive to PAH-specific therapy. Patients were included if they fulfilled the contemporary diagnostic criteria for group 1 PAH (mean pulmonary artery [PA] pressure [mPAP] ≥25 mm Hg at rest occurring in the setting of increases in precapillary pulmonary resistance). Patients with congenital systemic-pulmonary shunts were excluded. The patients’ physicians, who were PAH specialists, made decisions on medical therapy. From the 80 patients in the initial study, a substudy was performed on the 50 patients (62%) who were available for inclusion. Patients who underwent follow-up echocardiography between 3 and 12 months were included in the study. Those who did not undergo follow-up echocardiography (n = 10), had inadequate images for strain measurements (n = 8), or died before follow-up (n = 12) were excluded from the study.
Clinical status at follow-up was assessed in 47 of 50 surviving patients on the basis of an in-person clinical evaluation by a member of the PAH staff at 6 ± 2 months. Evidence of right heart failure was defined as the presence of more than trivial edema and/or ascites in the setting of neck vein distension. Survival was censored at 4 years, with vital status available through clinical follow-up in all subjects. The study was approved by the institutional review board, and all patients gave informed consent.
Echocardiographic images were reviewed by a study echocardiologist (A.S., J.-F.H.), blinded to the clinical, laboratory, and hemodynamic information. Two-dimensional and Doppler echocardiography was performed according to standard American Society of Echocardiography guidelines. RA pressure estimation was based on interrogation of the inferior vena cava diameter and distensibility and pulsed-wave Doppler interrogation of hepatic vein flow and scored as 5, 10, 15, or 20 mm Hg. No patient had echocardiographic evidence of pulmonary stenosis or RV outflow tract obstruction, so RV systolic pressure was taken as equivalent to PA systolic pressure. RV systolic pressure was calculated as 4v 2 + RA pressure, where v is the peak tricuspid regurgitant velocity. The mPAP was calculated as the mean transtricuspid valve gradient + estimated RA pressure and the diastolic pressure derived from the equation diastolic PA pressure = 2(mPAP) − systolic PA pressure. The RV index of myocardial performance (Tei index) was calculated as described previously. PA capacitance was calculated as Doppler-derived stroke volume/PA pulse pressure. Pulmonary vascular resistance index was calculated as the mean PA pulse pressure divided by the cardiac index. Follow-up echocardiography was reviewed by the same echocardiologist who performed the initial evaluation, blinded to previous measurements.
A 3-beat 2-dimensional digital clip of an apical 4-chamber view of the right ventricle was transferred to a syngo Vector Velocity Imaging workstation (Siemens Medical Solutions USA, Inc., Mountain View, California) for analysis of systolic strain. The RV endocardium was traced with 10 to 15 points placed starting and ending at the tricuspid valve annulus ( supplementary figure ). Negative strain values indicate tissue contraction. Positive values indicate tissue lengthening. Mean values of the septal and lateral free walls were also calculated. Blinded assessment for variability of RV free wall strain assessment was performed in a randomly selected, representative subgroup of 10 studies: the correlation coefficient for intraobserver variability was 0.91 and for interobserver variability was 0.89.
Statistical analyses were performed using JMP version 8.0 (SAS Institute Inc., Cary, North Carolina). Continuous variables are expressed as mean ± SD or as medians with interquartile ranges and were tested between groups using analysis of variance. Paired analyses were performed to assess individual changes in continuous variables from baseline to follow-up. Categorical variables are presented as number and percentage, with comparisons by Pearson’s chi-square analysis. A severe reduction in RV free wall systolic strain was defined as less negative than −12.5%, as previously reported, corresponding to the level of RV free wall strain that best predicted 1-year survival in untreated patients with PAH. Patients were further classified by whether an improvement in RV free wall systolic strain of ≥5% was demonstrated at follow-up, which represented the SD in baseline RV free wall systolic strain in this and our previous study. The relation of RV free wall strain was assessed either as a continuous or a dichotomous variable, as outlined. Cox proportional-hazards regression models were used to identify correlates of mortality. Results are presented as hazard ratios (HRs) with 95% confidence intervals (CIs). Multivariate models were developed with stepwise inclusion and exclusion techniques at a significance level of 0.10 and by consideration of variables that were clinically relevant (age and choice of therapy). Variables included were RV free wall strain, age, gender, World Health Organization (WHO) functional class, PAH therapy, and cause of PAH. Follow-up of patients is presented on the basis of the Kaplan-Meier product-limit method and was compared between groups using the log-rank test. For all analyses, p values <0.05 were considered to be significant.
Results
The baseline characteristics of the cohort are listed in Table 1 . All patients had WHO group 1 PAH. Most patients were in functional class III (66%) or IV (6%) at baseline, with catheterization showing elevated RA pressure and pulmonary vascular resistance index with significant depression in cardiac index and mixed venous oxygen saturation. Patients on average had moderate to severe or severe enlargement of the right atrium and right ventricle ( Table 2 ). Conventional echocardiographic measures of RV function were significantly reduced.
| Variable | Value |
|---|---|
| Women | 42 (84%) |
| Age (yrs) | 56 ± 12 |
| Body mass index (kg/m 2 ) | 29.9 ± 7 |
| Idiopathic and familial PAH | 21 (42%) |
| PAH with collagen vascular disease | 19 (38%) |
| Portopulmonary hypertension | 7 (14%) |
| Other group 1 PAH | 3 (6%) |
| Glomerular filtration rate (cm 3 /min/1.73 m 2 ) | 63 ± 24 |
| Diffusing capacity of carbon monoxide (%) | 58 ± 20 |
| Mean RA pressure (mm Hg) | 9 ± 5 |
| PA systolic/diastolic pressure (mm Hg) | 77 ± 16/31 ± 8 |
| Mean PA pressure (mm Hg) | 50 ± 10 |
| Mixed venous oxygen saturation (%) | 63 ± 9 |
| Cardiac index (L/min/m 2 ) | 2.8 ± 1.0 |
| Pulmonary vascular resistance index (Wood units · m 2 ) | 16 ± 9 |
| Variable | Baseline | Follow-Up | p Value |
|---|---|---|---|
| WHO class | 0.03 | ||
| I and II | 14 (28%) | 16 (32%) | |
| III, IV | 33 (66%), 3 (6%) | 31 (62%), 3 (6%) | |
| 6-minute walking distance (m) | 331 ± 118 | 369 ± 108 | 0.18 |
| Symptom reduction | N/A | 25 (50%) | — |
| Brain natriuretic peptide (pg/mL) | 287 (157–241) | 309 (132–357) | 0.73 |
| Heart rate (beats/min) | 79 ± 15 | 75 ± 12 | 0.04 |
| Systolic blood pressure (mm Hg) | 116 ± 22 | 112 ± 18 | 0.31 |
| Diastolic blood pressure (mm Hg) | 73 ± 15 | 68 ± 12 | 0.02 |
| RA volume index (cm 3 /m 2 ) | 44 ± 18 | 36 ± 19 | <0.01 |
| RV wall thickness (mm) | 8.3 ± 2.5 | 7.3 ± 1.8 | 0.01 |
| RV end-diastolic length (mm) | 77 ± 9 | 81 ± 11 | 0.049 |
| RV mid-diastolic dimension (mm) | 39 ± 7 | 45 ± 10 | <0.0001 |
| RV diastolic area (cm 2 ) | 29 ± 9 | 31 ± 9 | <0.004 |
| Moderate or greater tricuspid valve regurgitation | 25 (50%) | 22 (44%) | 0.44 |
| Pericardial effusion | 15 (30%) | 14 (28%) | 0.78 |
| RV (Tei) index of myocardial performance | 0.60 ± 0.19 | 0.61 ± 0.19 | 0.58 |
| RV fractional area change (%) | 28 ± 12 | 33 ± 12 | 0.02 |
| RV outflow tract time-velocity integral (cm) | 15.5 ± 5.0 | 17.4 ± 6.0 | 0.04 |
| Doppler-derived cardiac index (ml/min/m 2 ) | 3.1 ± 0.8 | 3.3 ± 0.6 | <0.0001 |
| Left ventricular ejection fraction (%) | 66 ± 8 | 65 ± 6 | 0.51 |
| Estimated RA pressure (mm Hg) | 8 ± 4 | 11 ± 4 | <0.0001 |
| Mean PA pressure (mm Hg) | 49 ± 19 | 48 ± 14 | 0.59 |
| Pulmonary vascular resistance index (Wood units · m 2 ) | 17 ± 7 | 15 ± 6 | 0.09 |
| Pulmonary artery capacitance (ml/mm Hg) | 1.9 ± 1.3 | 2.1 ± 1.8 | 0.28 |
Table 3 categorizes patients by type of PAH therapy received. Those who received prostacyclin analogues had more severe PAH at baseline compared to the other treatment groups, as reflected by clinical and echocardiographic parameters. Conversely, patients who received calcium channel blockers alone were less ill at baseline. The patients returned for follow-up medical evaluation with echocardiography at 6 ± 2 months (see Tables 2 and 3 ). Of these, 25 patients (50%) reported symptom reduction, 13 (26%) were unchanged, and 12 (24%) reported worsening. Repeat echocardiography showed significant improvements on average in Doppler-derived cardiac index and RV fractional area change (RV fractional area change) and reductions in RA volume index and RV wall thickness. Progressive RV dilatation was noted (increased end-diastolic length, mid-diastolic dimension, and diastolic area). An improvement was seen in 6-minute walking distances, with no significant changes in brain natriuretic peptide values, WHO functional class, or RA or PA pressures.
| Variable | Oral Therapy (n = 29) | Prostaglandin Therapy (n = 12) | Calcium Channel Blocker Therapy (n = 8) | ||||||
|---|---|---|---|---|---|---|---|---|---|
| Baseline | Follow-Up | p Value | Baseline | Follow-Up | p Value | Baseline | Follow-Up | p Value | |
| Women | 93 | 75 | 63 | ||||||
| Age (yrs) | 58 ± 11 | 51 ± 10 | 58 ± 16 | ||||||
| Brain natriuretic peptide (pg/mL) | 286 ± 284 | 401 ± 475 | 0.07 | 370 ± 601 | 208 ± 220 | 0.26 | 135 ± 200 | 208 ± 299 | 0.30 |
| 6-minute walking distance (m) | 317 ± 114 | 313 ± 110 | 0.80 | 308 ± 112 | 382 ± 35 | 0.01 | 430 ± 123 | 470 ± 71 | 0.50 |
| Mean functional class | 2.8 ± 0.5 | 2.7 ± 0.8 | 0.68 | 2.8 ± 0.7 | 2.2 ± 0.8 | 0.01 | 2.5 ± 0.9 | 2.0 ± 1.0 | 0.20 |
| Functional class III or IV | 76 | 62% | 0.26 | 83% | 25% | 0.01 | 50% | 33% | 0.60 |
| Symptom reduction | NA | 38% | — | NA | 83% | — | NA | 63% | — |
| RV outflow tract time-velocity integral (cm) | 16.5 ± 5.1 | 17.6 ± 6.3 | 0.48 | 13.4 ± 5.1 | 16.8 ± 7.0 | 0.01 | 14.5 ± 4.4 | 16.7 ± 3.4 | 0.25 |
| Pulmonary vascular resistance index (Wood units · m 2 ) | 16 ± 6 | 15 ± 7 | 0.55 | 21 ± 8 | 16 ± 4 | 0.07 | 11 ± 7 | 10 ± 4 | 0.69 |
| Mean PA pressure (mm Hg) | 52.1 ± 9.5 | 53.2 ± 21.4 | 0.51 | 56 ± 10 | 49.7 ± 11.5 | 0.89 | 40.0 ± 11.9 | 32.5 ± 13.6 | 0.62 |
| RA pressure (mm Hg) | 7.4 ± 4.1 | 11.5 ± 3.8 | 0.0007 | 9.1 ± 4.7 | 11.8 ± 3.7 | 0.12 | 7.5 ± 5.3 | 9.9 ± 3.6 | 0.29 |
| Mid-RV diameter (mm) | 37.5 ± 5.0 | 45.3 ± 10.5 | <.0001 | 42.0 ± 8.5 | 49.5 ± 4.9 | 0.002 | 37.6 ± 8.2 | 39.6 ± 8.9 | 0.61 |
| RV fractional area change (%) | 24.8 ± 10.1 | 30.4 ± 11.2 | 0.03 | 26.0 ± 8.7 | 30.6 ± 9.9 | 0.26 | 40.2 ± 10.4 | 40.3 ± 13.9 | 0.99 |
| Mean RV free wall longitudinal systolic strain | −15.8 ± 5.8 | −19.5 ± 6.4 | 0.03 | −14.0 ± 5.2 | −19.3 ± 4.6 | 0.006 | −17.3 ± 3.5 | −23.5 ± 8.6 | 0.11 |
| Mean change in strain | NA | −3.7 ± 8.4 | 0.03 | NA | −5.3 ± 5.3 | 0.006 | NA | −6.2 ± 9.7 | 0.11 |
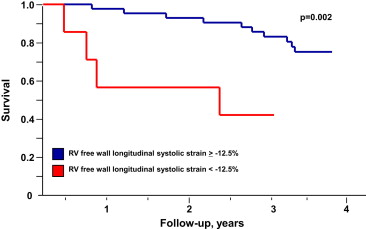
RV free wall systolic strain at follow-up was on average −20 ± 7%, an improvement from baseline (−15 ± 5%, p = 0.0001). A cut-off value of RV free wall strain <−12.5% was associated with greater disease severity (100% were in functional class III or IV vs 42%, p = 0.005), greater diuretic requirements (86% vs 40%, p = 0.02), higher mPAP (67 ± 20 vs 46 ± 17 mm Hg, p = 0.006), and poorer RV systolic function (RV fractional area change 22 ± 10 vs 34 ± 12, p = 0.01). As was demonstrated before treatment, these strain classifications at follow-up after PAH treatment were predictive of 4-year survival (p = 0.002; Figure 1 ).