Chapter 41 Risk Assessment and Quality Improvement
Despite continued advances in perioperative care, cardiac surgery carries an appreciable risk for serious morbidity and for mortality. At the same time, there is a strong demand by the public, regulatory bodies, professional organizations, and the legal system for evidence that healthcare is being delivered to a high standard. In some jurisdictions, this demand has led to the reporting of mortality figures for individual institutions and surgeons.1 However, the likelihood of adverse outcomes for patients is highly dependent on their preoperative risk profiles. For example, the mortality risk provided in Chapter 10 for isolated mitral valve surgery is 6%. However, an otherwise well 50-year-old male undergoing mitral valve repair for severe mitral regurgitation has a mortality risk (predicted using the logistic EuroSCORE; see subsequent material) of 1.5%.
RISK-SCORING SYSTEMS IN CARDIAC SURGERY
General Versus Specific Risk-Scoring Systems
Risk-scoring systems may be classified as either general or specific. General scoring systems are widely used in ICU practice. Examples include the Acute Physiology and Chronic Health Evaluation (APACHE), which has undergone four iterations (I through IV); Mortality Probability Models (MPM) II; and the Simplified Acute Physiology Score (SAPS) II. With APACHE IV, mortality risk is calculated on the basis of multiple factors, including (1) acute derangements of 17 physiologic variables measured within 24 hours of ICU admission; (2) the patient’s age; (3) the presence of chronic, severe organ failure involving the heart, lungs, kidneys, liver, or immune system; (4) the admission diagnosis; (5) the pre-ICU length of hospital stay. (Downloadable risk calculators for APACHE IV are available from www.criticaloutcomes.cerner.com.) Although useful for most ICU patients, these general scoring systems are of limited value for cardiac surgery patients because many of the acute physiologic changes that occur in the first 24 hours are related to the effects of surgery and cardiopulmonary bypass and do not reflect patients’ risk for dying or suffering morbid events. Although APACHE IV has a mortality-prediction algorithm for use in patients who have had coronary artery bypass graft (CABG) surgery using postoperative day 1 variables, it may not be valid outside the United States and is not designed for use in patients undergoing other cardiac operations.2 General scoring systems are not discussed further.
Principles of Cardiac Risk-Scoring Systems
To appreciate the strengths and weaknesses of risk-scoring systems, it is important to consider how they are developed and validated.3–5
Development of Risk-Scoring Systems
The most widely used statistical tool for developing risk models is logistic regression.6 First, univariate regression analysis is used to identify statistical associations between predictor variables and the outcome variable. From these variables, a multivariate logistic regression model is developed in which independent predictor variables are identified and included in a regression equation of the following general form:
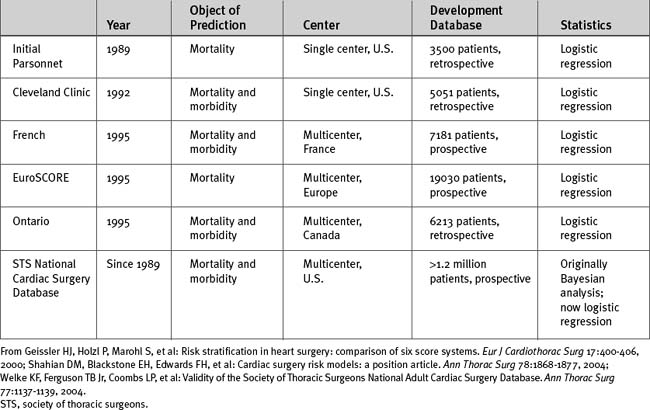
Other than database size, additional important issues are the time the data were collected, the geographic location of the patients in the database, whether the database is single-center or multicenter, and whether the data were collected prospectively or retrospectively (Table 41-1). For instance, the Parsonnet score—the first widely used cardiac risk-scoring system—was originally developed from a retrospective database of 3500 patients operated on between 1982 and 1987 in the United States. Given the changes in patient populations and surgical management since then, outcome predictions based on this patient population may no longer be valid, particularly outside the United States.
Validating Risk-Scoring Systems
Calibration refers to how well the model assigns appropriate risk. It is evaluated by dividing patients into groups (usually deciles) according to expected risk and then comparing expected to observed risk within those groups. A well-calibrated model shows a close agreement between the observed and expected mortality rates, both overall and within each decile of risk. Most cardiac risk models are well calibrated in the midrange but less so for patients at the extremes of risk, both high and low.7
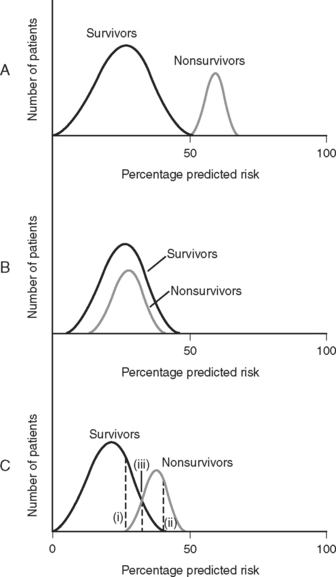
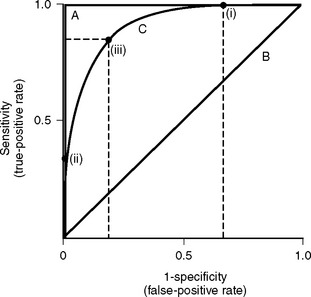
Discrimination refers to how well the model distinguishes patients who survive from those who die (Fig. 41-1). It is evaluated by analyzing receiver operating characteristic (ROC) curves.8 ROC curves are plots of sensitivity (true positive rate) against 1− specificity (false positive rate) at various levels of predicted risk (cutoffs). They graphically display the tradeoff between sensitivity and specificity as shown in Figure 41-2. For randomly selected pairs of patients with different outcomes (survival or death), a model should predict a higher mortality risk for the patient who dies than for the patient who survives. The area under the ROC curve (c-statistic) varies between 0.5 and 1.0 and indicates the probability that a randomly chosen patient who dies has a higher risk than a randomly chosen survivor. A model with no discrimination has an area under the ROC curve of 0.5 (see Fig. 41-2, graph B), meaning that the chance of correctly predicting the death in a randomly chosen pair is 50%, which is no better than the toss of a coin. By contrast, a model with an area under the ROC curve of 1 (see Fig. 41-2, graph A) implies perfect discrimination, meaning that the model always assigns a higher risk to a randomly chosen death than to a randomly chosen survival. In such a situation, there is no tradeoff between sensitivity and specificity; they are always 100% at every percentage risk prediction. A good explanation of ROC curves with applets allowing graphic manipulation of the threshold and sample population separation is given at http://www.anaesthetist.com/mnm/stats/roc/index.htm.

Figure 41.1 Discrimination of risk models. A, A risk model with perfect discrimination. In this example, all of the patients with a predicted mortality risk of 50% or less survive, and all of the patients with a predicted mortality risk of 50% or greater die. B, A risk model with no discrimination. C. Although an oversimplification, model C is more typical of a real-world cardiac risk model. Nonsurvivors tend to have a higher predicted mortality rate than survivors, but there is some overlap. No cutoff separates all survivors from all nonsurvivors. Line (i) represents the cutoff point corresponding to 100% sensitivity for predicting death. That is, 100% of nonsurvivors have a mortality prediction greater than line (i). Line (ii) represents the cutoff point corresponding to 100% specificity for predicting death. That is, there are no survivors beyond line (ii). Line (iii) represents the optimal tradeoff between sensitivity and specificity. Most of the patients who die have a risk score above this cutoff point, and most of the patients who survive have a risk score below this cutoff point. Sensitivity and specificity are further discussed in Appendix 2.

Figure 41.2 Receiver operating characteristic (ROC) curves for mortality prediction. ROC curves are constructed by plotting sensitivity (true-positive fraction) against 1-specificity (false-positive fraction) for all levels (cutoffs) of predicted risk from 0% to 100%. Three curves are shown; they correspond to A, B, and C in Fig. 41-1. For curve A, as sensitivity rises there is no loss of specificity (and as specificity rises, there is no loss of sensitivity). This model has perfect discrimination, and the area under the ROC curve is 1.0 (see text). For curve B, as sensitivity rises there is loss of specificity by an exactly equal amount, and vice versa. This model has no discrimination, and the area under the ROC curve is 0.5 (see text). Curve C is more typical of cardiac risk scores. A sensitivity of 100% is associated with a specificity of about 30% (i.e., 1-specificity of 0.7). This is shown as point (i) on curve C. A specificity of 100% (i.e., 1-specificity of 0) is associated with a sensitivity of about 30%. This is shown as point (ii) on curve C. Point (iii) represents the risk score at which sensitivity and specificity are both optimal, in this case about 80% for each. The area under curve C is about 0.85, which represents a high degree of discrimination—most risk models in medicine and surgery perform well below this. Sensitivity and specificity are defined formally in Appendix 2.
Choice of Risk Models
The two most important cardiac surgery risk-scoring systems currently in use are the EuroSCORE and the system developed from the STS National Cardiac Surgery Database. The STS database was established in 1989 and is the largest cardiac surgery database in the world. In 2004 there were 638 contributing hospitals, and it contained information from more than 2 million surgical procedures.5,9 Participating hospitals submit their data to the STS on a biannual basis and receive detailed reports after analysis of the data from all participants. Reports contain risk-adjusted measures of mortality rates, which allow participating hospitals to benchmark their results against regional and national standards. The reports also provide data for research projects. Risk scoring is based on 24 patient-, cardiac-, and operation-related predictor variables. An online risk calculator is available from the STS website (www.sts.org) at http://66.89.112.110/STSWebRiskCalc/. The web calculator provides mortality predictions for five main operations: CABG surgery, aortic valve replacement, mitral valve replacement, CABG surgery plus aortic valve replacement, and CABG surgery plus mitral valve replacement. In addition, outcome predictions for five morbidities in CABG surgery are also provided: reoperation, permanent stroke, renal failure, deep sternal wound infection, and prolonged ventilation. Unlike other risk-scoring systems, the STS system has not released into the public domain the logistic regression equations it uses.
The EuroSCORE was developed from a prospective database of more than 19,000 patients involving 132 centers in eight European countries.10 Data were collected over a 3-month period in 1995. Two forms of the EuroSCORE have been developed—the additive score and the logistic score. Both are based on the same 17 predictor variables. The additive score is shown in Table 41-2. The EuroSCORE website (www.EuroSCORE.org) provides the β coefficients for the logistic regression equation and makes available online and downloadable risk calculators for the logistic score. In head-to-head comparisons, the EuroSCORE has been shown to have better discrimination than other scoring systems (i.e., a higher area under the ROC curve).11–13 However, some investigators have found that the EuroSCORE (both additive and logistic) tends to overestimate observed mortality risk across a range of risk profiles (i.e., limited calibration).12,14,15 This may indicate that the EuroSCORE should be recalibrated to account for changes in patients and practices since it was developed in the 1990s. By contrast, other investigators have found that the additive EuroSCORE tends to underestimate observed risk in high-risk patients16,17 and in patients undergoing combined valve and CABG surgery.18
Table 41-2 The Additive EuroSCORE
| Patient-Related Factors | Score | |
|---|---|---|
| Age | Per 5 years or part thereof over 60 years | 1 |
| Sex | Female | 1 |
| Chronic pulmonary disease | Long-term use of bronchodilators or steroids for lung disease | 1 |
| Extracardiac arteriopathy | Any one or more of the following: claudication, carotid occlusion or >50% stenosis, previous or planned intervention in the abdominal aorta, limb arteries, or carotids | 2 |
| Neurologic dysfunction disease | Severely affecting ambulation or day-to-day functioning | 2 |
| Previous cardiac surgery | Requiring opening of the pericardium | 3 |
| Serum creatinine | Greater than 200 m μ/l preoperatively | 2 |
| Active endocarditis | Patient still under antibiotic treatment for endocarditis at the time of surgery | 3 |
| Critical preoperative state | Any one or more of the following: ventricular tachycardia or fibrillation or aborted sudden death, preoperative cardiac massage, preoperative ventilation before arrival in the anesthetic room, preoperative inotropic support, intraaortic balloon counterpulsation or preoperative acute renal failure (anuria or oliguria <10 ml/hour) | 3 |
| Cardiac-Related Factors | Score | |
| Unstable angina | Rest angina requiring IV nitrates until arrival in the anesthetic room | 2 |
| LV dysfunction | Moderate or LVEF 30% to 50% | 1 |
| Poor or LVEF <30 | 3 | |
| Recent myocardial infarction | Within 90 days | 2 |
| Pulmonary hypertension | Systolic PA pressure >60 mmHg | 2 |
| Operation-Related Factors | Score | |
| Emergency | Carried out on referral before the beginning of the next working day | 2 |
| Other than isolated CABG | Major cardiac procedure other than or in addition to CABG | 2 |
| Surgery on thoracic aorta | For disorder of ascending, arch, or descending aorta | 3 |
| Post myocardial infarction septal rupture | 4 |
CABG, coronary artery bypass graft; LV, left ventricular; LVEF, left ventricular ejection fraction; PA, pulmonary arterial.
Note: If a risk factor is present in a patient, a score is assigned. The weights are added to give an approximate percent predicted mortality.
Applications of Risk Scores
It is important to appreciate an essential limitation in applying risk scores to individuals. For a dichotomous variable such as mortality, the observed outcome (died or survived) never matches the predicted outcome (e.g., 10% mortality risk) on an individual level (i.e., individuals cannot be 10% dead!). Thus, a risk model may correctly identify that 10 out of 100 patients with a given set of risk factors may die, but not which 10. Also, because mortality predictions are risk estimates, some authors have suggested that mortality-risk predictions for individual patients should be accompanied by confidence limits, indicating their uncertainty.5,19 However, currently used risk models do not routinely provide these confidence limits. Furthermore, other authors have questioned the benefit of confidence limits because by not correcting for random or systematic errors, they do not cover the total uncertainty of the measurement.20
Stay updated, free articles. Join our Telegram channel

Full access? Get Clinical Tree


