Our study investigated the abnormal right ventricular systolic pressure response (RVPR) in young patients with isolated atrial septal defect (ASD) or ventricular septal defect (VSD). An abnormal RVPR >50 mm Hg during exercise has been identified as a precursor of pulmonary artery hypertension. The present study included a population-based selection of 44 patients (age 13 to 25 years) with either isolated VSD (n = 27) or ASD (n = 17) and without right ventricular outflow tract obstruction. Of the 44 defects, 28 had been surgically closed (17 ASDs and 11 VSDs); 16 minor VSDs were untreated. Cardiovascular exercise testing and echocardiography at rest and during exercise were performed for all patients and 88 healthy controls. The aerobic capacity was significantly reduced in all patient groups (open VSD, closed VSD, closed ASD). The measurements of right ventricular performance were significantly lower in patients with closed ASD or closed VSD compared to those of the controls and patients with open VSD. Finally, 5% of the controls, no patient with ASD, and 9 patients with VSD (33%), regardless of defect closure, had an abnormal RVPR during exercise. In conclusion, 1/3 of young patients with isolated VSD had an abnormal RVPR during exercise.
In the present study, a population-based group of young patients with isolated atrial septal defect (ASD) or ventricular septal defect (VSD) were examined. Our aim was to investigate the right ventricular pressure response (RVPR) to exercise and its interrelation to aerobic capacity and right ventricular (RV) performance.
Methods
In the Norwegian regions of Vestfold, Asker, and Bærum, 69 children were born from 1982 to 1993 with isolated VSD or ASD and without RV outflow tract obstruction. This did not include patients with a spontaneously closed foramen ovale or VSD during follow-up or patients with complicating conditions preventing appropriate exercise testing (ie, trisomy 21). Two patients with device-closed ASD were excluded to prevent device-related confounding. The 67 eligible patients had either an open defect or had undergone defect closure at inclusion in the present study. Of the 67 patients, 23 were lost to follow-up or refused participation.
The patient group (44 patients, 66% of the eligible patients) was matched 2:1 individually to 88 healthy control subjects of the same age (±12 months) and gender. The healthy control subjects were recruited from the hospital employees and their relatives, college students, and other local citizens volunteering in response to newspaper articles. The volunteers had no known heart or lung disease; however, mild bronchial asthma was accepted.
All patients and control subjects underwent cardiovascular exercise testing on a treadmill ergometer with gas exchange analysis and electrocardiography according to the Oslo protocol (Jaeger Oxycon Delta, Viasys Healthcare GmbH, Höchberg, Germany). The peak oxygen uptake was corrected for body weight and expressed as ml/kg −0.67 /min. The individual results were compared to the reference values from healthy Norwegian adolescents and are expressed by the Z score related to the age-specific mean in the reference material. Before including the matched controls, highly endurance-trained volunteers with a Z score of >2 were disqualified as not eligible because of the known phenomenon of elevated pulmonary arterial pressure levels during exercise in athletes. One patient’s treadmill exercise was considered submaximal and was consequently excluded from additional analysis.
Echocardiographic recordings were obtained using a Vivid 7 scanner (GE Vingmed Ultrasound, Horten, Norway). All echocardiographic studies were both videotaped and saved digitally (still frame and loops). The right atrial pressure at rest was estimated using the vena cava inferior index. RV performance was measured by M-mode registration of the tricuspid annular plane systolic excursion, and the peak tricuspid annular plane systolic motion velocity was measured using color tissue Doppler. One hour after treadmill testing, exercise echocardiography was performed during supine cycling with about 30° elevation and a left-sided tilt (Ergoselect 1200 EL, Ergoline GmbH, Bitz, Germany). A stepwise exercise protocol was used with a starting load of 25 W and an increase of 25 W every second minute until the target heart rate of 160 beats/min was reached. Above that level, echocardiographic recordings become futile because of upper body movement and the interposition of the lungs. The systemic blood pressure was measured at every exercise level, as was the maximal velocity of the tricuspid regurgitation jet. The right ventricular systolic pressure (RVSP) was calculated from each recording using the modified Bernoulli equation, adding the right atrial pressure at rest to the calculated pressure gradient between the right ventricle and the right atrium.
To detect dynamic RV outflow tract obstruction that could interfere with the RVSP measurements, the RV outflow tract velocity was measured at the 100-W level. Patients with outflow tract velocities greater than 2 m/s were not included in the present study.
The Regional Committee for Medical Research Ethics approved the study, and all participating subjects gave informed consent. All authors had full access to the data, take full responsibility for its integrity, and have read and agreed to the report as written.
Pressure measurements were made off-line by analysis of all digitally stored still frames of tricuspid regurgitation velocity. Every frame was classified into good, reasonable, or poor/impossible measurement. For every minute of exercise, the measurements were summarized into a conclusive pressure value (maximum of 2 values per workload level) according to the best accessible Doppler measurements. Obvious outlier measurements with major deviation from both previous and subsequent measurements were rejected. For approval of the entire exercise study, at least the second last passed workload level had to be evaluable.
Statistical analysis was done using Statistical Package for Social Sciences, version 16.0 (SPSS, Chicago, Illinois). Off-line analysis of ultrasound studies was performed on EchoPac PC, version 5.x (GE Vingmed Ultrasound).
For the analysis of interobserver variability a second analyzer, who was unaware of the treatment groups, evaluated 35 exercise echocardiography recordings (18 patients and 17 controls). The second analyzer was experienced in the exercise echocardiographic technique.
The Student t test or one-way analysis of variance was performed to compare the different subgroups, if a normal distribution was assumed. Nonparametric tests were used for continuous variables. The chi-square test or Fisher’s exact test was used as appropriate for the categorical variables. Pearson’s correlation was used to determine the relations between different independent variables. A multivariate linear regression model (stepwise backward elimination procedure) was used to model the relation between independent variables (eg, age, age at defect closure, gender, body mass index, Z score of peak oxygen uptake, tricuspid annular plane systolic excursion) and the outcome variable, maximum RVSP during exercise. The interobserver variability for continuous variables was calculated using the intraclass correlation coefficient. For categorical variables, the interobserver agreement was calculated using κ statistics. The parametric data are presented as the mean ± SD and the nonparametric data as the median and range. p Values <0.05 were considered statistically significant.
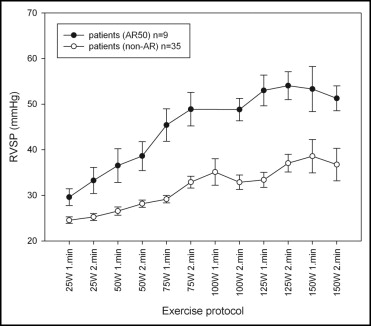
The linear trend in the graphs shown in Figures 1 through 3 (25 W first minute until 75 W second minute) were analyzed using the linear mixed model. The interval, control subject, or patient and the interaction between the interval and control subject and patient were fixed effects, and patient and the interaction between patient and interval were random effects in the model shown in Figure 1 . We assumed a variance component matrix for random effects, and first-order autoregressive structure (AR1) was assumed for the residual matrix. The interval, absence of an abnormal RVSP, and the interaction between the interval and the absence of an abnormal RVSP were fixed effects, and patient and the interaction between patient/control subject and interval were random effects in the model shown in Figure 2 . In Figure 3 , the independent variable was the systolic blood pressure. The interval, absence of an abnormal RVSP, and the interaction between the interval and the absence of an abnormal RVSP were fixed effects, and patient and the interaction between patient and interval were random effects in the model shown in Figure 3 . The slope in Figure 2 was also analyzed by dividing the graph into 2 parts, with the first part (25 W first minute until 75 W second minute) and the last part (100 W first minute until 150 W second minute) compared.


Results
The present study included 44 patients and 88 healthy volunteers ( Table 1 ). All patients with ASD had a surgically closed defect, 3 by patch closure and 14 by direct suture. Of the 27 patients with VSD, 11 had their VSD closed surgically, 7 by direct suture and 4 by patch closure. Of these 11 patients, 2 (18%) had minor residual shunts. No patient received specific treatment of pulmonary artery hypertension before or after surgery; however, preoperative catheterization data were available only for a few patients. The velocity measurements across the ventricular septum in 16 patients with untreated small muscular or small perimembraneous VSD (4.5 ± 0.51 m/s) indicated a normal RV pressure at rest. Two defects were identified by color Doppler mapping but were too small for velocity assessment.
| Age Group (years) | Subjects (n) | Gender (Male/Female) | Age (years) | Height (cm) | Weight (kg) | Body Mass Index (kg/m 2 ) | ||||||
|---|---|---|---|---|---|---|---|---|---|---|---|---|
| Patients | Controls | Patients | Controls | Patients | Controls | Patients | Controls | Patients | Controls | Patients | Controls | |
| 13–15 | 14 | 22 | 8/6 | 13/9 | 13.9 ± 1.1 | 14.0 ± 0.7 | 162.4 ± 7.0 | 166.1 ± 10.0 | 52.2 ± 11.1 | 56.2 ± 12.2 | 19.8 ± 3.9 | 20.2 ± 2.6 |
| 16–18 | 14 | 29 | 5/9 | 15/14 | 16.9 ± 0.9 | 17.0 ± 0.8 | 170.9 ± 9.7 | 175.4 ± 9.0 | 59.6 ± 8.1 | 67.0 ± 9.9 | 20.4 ± 1.6 | 21.8 ± 2.8 |
| 19–21 | 11 | 18 | 4/8 | 4/14 | 20.2 ± 0.9 | 20.1 ± 0.9 | 170.7 ± 6.8 | 169.8 ± 9.3 | 68.6 ± 9.8 | 64.0 ± 11.4 | 23.6 ± 3.7 | 22.1 ± 2.1 |
| 22–25 | 5 | 19 | 2/2 | 7/12 | 23.2 ± 0.8 | 23.5 ± 1.1 | 164.6 ± 8.9 | 172.2 ± 10.8 | 61.5 ± 4.8 | 69.4 ± 16.1 | 22.8 ± 2.6 | 23.3 ± 4.2 |
| Overall | 44 | 88 | 19/25 | 39/49 | 17.5 ± 3.3 | 18.3 ± 3.5 | 167.4 ± 8.8 | 171.2 ± 10.2 | 59.7 ± 11.0 | 64.2 ± 13.1 | 21.3 ± 3.5 | 21.8 ± 3.1 |
The Z score of the peak oxygen uptake was normally distributed for the patient group (−1.48 ± 1.54). Because of the upper Z-score limit (≤2.0) of a control subject’s peak oxygen uptake, the distribution in the control group was not gaussian. The Z score of the peak oxygen uptake in the patient group and subgroups was significantly lower than that in the control group ( Figure 4 and Table 2 ). No difference was found in aerobic capacity among any of the patient groups (ASD, all VSD, open VSD, closed VSD). The Z score of peak oxygen uptake correlated inversely with patient age at defect closure for VSD but not for ASD.
| Study Group | Age at Defect Closure (mo) | Interval Since Defect Closure (mo) | Z Score for Peak Oxygen Uptake | FS (%) | TAPSE (mm) | TASM (cm/s) | RVSP at Rest (mm Hg) | Maximum RVSP (mm Hg) |
|---|---|---|---|---|---|---|---|---|
| All patients (n = 44) | — | — | −1.3 (−5.2–1.3), p <0.001 (n = 43) | 30.5 ± 5.7, p = 0.025 | 18.8 ± 5.1, p <0.001 | 8.7 ± 2.6, p <0.001 | 20.7 ± 5.3, p = NS | 37 (24–76), p = NS |
| All controls (n = 88) | — | — | 0.3 (−4.5–2.0) | 32.4 ± 4.1 | 22.8 ± 3.0 | 10.5 ± 1.6 | 21.8 ± 3.6 | 39 (17–63) (n = 85) |
| Open VSD (n = 16) | — | — | −1.4 (−4.6–0.8), p = 0.034 | 29.3 ± 4.3, p = 0.008 | 23.9 ± 3.2, p = NS | 10.8 ± 2.4, p = NS | 20.6 ± 6.2, p = NS | 40 (24–73), p = NS |
| Controls (n = 32) | — | — | 0.3 (−3.6–2.0) | 32.7 ± 4.0 | 23.3 ± 3.5 | 10.6 ± 1.7 | 21.3 ± 3.1 | 35 (17–63) (n = 31) |
| Closed VSD (n = 11) | 61 (1–159) | 133 (101–249) | −1.3 (−5.1–0.2), p = 0.04 | 32.9 ± 7.0, p = NS | 17.4 ± 3.9, p = 0.001 | 8.3 ± 2.2, p = 0.003 | 21.8 ± 6.2, p = NS | 46 (24–76), p = 0.015 |
| Controls (n = 22) | — | — | 0.2 (−4.5–1.6) | 32.6 ± 4.1 | 21.6 ± 2.4 | 10.4 ± 1.5 | 21.2 ± 3.2 | 34 (26–46) (n = 21) |
| Closed ASD (n = 17) | 53 (12–133) | 165 (73–229) | −1.5 (−5.2–1.3), p <0.001 (n = 16) | 30.0 ± 5.8, p = NS | 14.9 ± 2.8, p <0.001 | 7.0 ± 1.3, p <0.001 | 20.0 ± 3.8, p = 0.035 | 36 (24–49), p = NS |
| Controls (n = 34) | — | — | 0.3 (−3.6–1.9) | 31.9 ± 4.4 | 23.2 ± 2.6 | 10.7 ± 1.5 | 22.9 ± 3.8 | 37 (26–51) (n = 33) |
Stay updated, free articles. Join our Telegram channel

Full access? Get Clinical Tree


