Right Heart Failure
Marvin A. Konstam
Sunny Srivastava
James E. Udelson
Right heart failure may result from dysfunctional right ventricular (RV) myocardium, excessive load imposed on the right ventricle during systole and/or diastole, or obstruction to RV inflow. The clinical expression of right heart failure is similar regardless of cause and is mediated via a combination of elevated systemic venous pressure and depressed cardiac output, with resulting sodium and water retention. The primary manifestations are edema, fatigue, and breathlessness. In addition, the failed right ventricle may adversely influence left ventricular (LV) performance through ventricular interaction and thus may promote signs and symptoms of left heart failure.
In this chapter, we review (a) the pathophysiology and clinical manifestations of right heart failure; (b) assessment of RV function; (c) the various specific causes of right heart failure; (d) the physiology and clinical implications of ventricular interdependence; (e) the manner in which RV performance may relate to the clinical expression of left heart failure; and (f) therapy for right heart failure.
Pathogenesis and Clinical Manifestations of Right Heart Failure
Right heart failure may be separated into diastolic failure, defined as abnormal elevation in right heart filling pressure, and systolic failure, defined as abnormally low RV forward output. In the absence of a perturbation in the serial nature of left and right heart output (as with intracardiac shunt), depression of right heart forward flow is a necessary accompaniment of a primary reduction in left heart output. This interaction is mediated through an increase in RV afterload and/or relative reduction in right heart inflow.
Load Dependence of Right Ventricular Function
Right ventricle volume and systolic function are exquisitely sensitive to changes in load. The thin RV free wall, normally no more than 4 mm in thickness (1), renders the right ventricle more compliant during both diastole and systole than is the left ventricle (Fig. 21-1) (2,3,4,5,6). That is, increases in diastolic pressure or in systolic pressure are accompanied by relatively large increments in diastolic volume and in end-systolic volume, respectively. The relation between RV afterload and systolic function may be expressed quantitatively through the RV end-systolic pressure-volume relation (Fig. 21-2) (5,6,7,8). The slope of this relation represents RV chamber elastance or the ability to sustain contractile performance in response to changes in systolic load. It has been found to increase in response to inotropic stimulation (5). The ventricular systolic pressure-volume slope is shallower for the right ventricle than for the left ventricle because, for the thin-walled right ventricle, a given change in pressure translates into a greater change in wall stress than for the thick-walled left ventricle (6).
A clinically relevant corollary of these observations is that, relative to the left ventricle, the right ventricle is less suited to accommodate to pressure overload but is more suited to accommodate to volume overload. The sensitivity of RV volume to changes in pressure during diastole is responsible for the ability of the RV to accommodate to substantial increases in preload with relatively small increases in systemic venous pressure. However, the
sensitivity of RV end-systolic volume to changes in end-systolic pressure is responsible for the fact that reduction in RV ejection fraction (RVEF) and clinical findings of right heart failure are more commonly manifestations of abnormal afterload, caused by left heart failure or pulmonary vascular pathology, than of intrinsic pathology of the RV myocardium (9,10,11,12,13,14) (Fig. 21-3). Conversely, RVEF may be maintained in the normal range despite moderate myocardial derangement as Jong as it is ejecting into a low-resistance circulation. Canine studies indicate that in the setting of acute pulmonary hypertension, inadequacy of RV coronary flow to meet the increased metabolic demand contributes to reduction in RV systolic performance (15).
sensitivity of RV end-systolic volume to changes in end-systolic pressure is responsible for the fact that reduction in RV ejection fraction (RVEF) and clinical findings of right heart failure are more commonly manifestations of abnormal afterload, caused by left heart failure or pulmonary vascular pathology, than of intrinsic pathology of the RV myocardium (9,10,11,12,13,14) (Fig. 21-3). Conversely, RVEF may be maintained in the normal range despite moderate myocardial derangement as Jong as it is ejecting into a low-resistance circulation. Canine studies indicate that in the setting of acute pulmonary hypertension, inadequacy of RV coronary flow to meet the increased metabolic demand contributes to reduction in RV systolic performance (15).
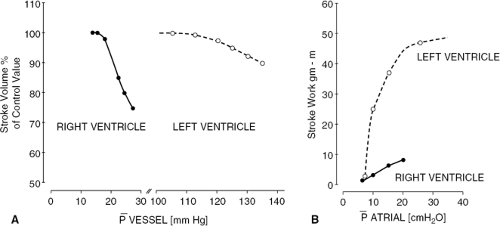 Figure 21-1 (A) Effects of increasing afterload and preload on right and left ventricular function. Data were obtained by constricting the main pulmonary artery or aorta in dogs. B demonstrates the effect of increasing preload. (Reprinted from McFadden ER Jr., Braunwald E. Cor pulmonale. In: Braunwald E, ed. Heart Disease. A Textbook of Cardiovascular Medicine. Philadelphia: WB Saunders; 1988 .) |
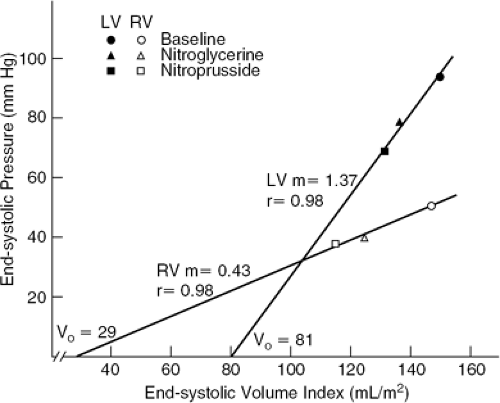 Figure 21-2 Comparison of left and right ventricular end-systolic pressure-volume relations (group mean data with linear regression lines) derived from 10 patients with biventricular failure secondary to heated myocardial infarction or dilated cardiomyopathy. Pulmonary or systemic arterial end-systolic (dicrotic notch) pressures are plotted against radionuclide-derived right or left ventricular end-systolic volumes, respectively, at baseline and during infusion of nitroglycerin and nitroprusside. The shallower slope of the right ventricular relationship indicates less right ventricular systolic stiffness compared with the left ventricle. That is, identical changes in systolic pressure effect greater changes in systolic performance for the right ventricle than for the left ventricle. (Reprinted from Konstam MA, Levine HJ. Effects of afterload and preload on right ventricular systolic performance. In: Konstam MA, Isner JM, eds. The Right Ventricle. Boston: Kluwer; 1988 .) |
The development of RV hypertrophy in response to chronic pressure overload results in reduction in wall stress for any given intracavitary pressure. As hypertrophy progresses, the mechanical characteristics of the right ventricle become more similar to those of the left ventricle, retaining systolic function in the face of heightened pulmonary artery (PA) pressure but requiring higher filling pressure to maintain preload and forward flow. In patients with pulmonary
hypertension, the degree to which RV hypertrophy develops and serves to maintain systolic function depends, in part, on the rapidity and age of onset of the hemodynamic stimulus. With progressive hypertrophy, RV systolic function may deteriorate, possibly because of intrinsic myocardial contractile dysfunction associated with cardiac hypertrophy. This occurrence is controversial, with some but not all studies of experimentally induced RV hypertrophy showing reduction of intrinsic contractility (16,17,18,19,20). These studies have documented intrinsic contractile derangement during the early stages of pressure-overload hypertrophy, as indicated by reduction in the maximum unloaded velocity and in the maximum rate of tension development of isolated myocardium. However in time, these abnormalities have generally been observed to revert toward normal. Alternatively, a limitation in coronary flow reserve has been documented in animal models and in patients with RV myocardial hypertrophy, and may result in ischemic contractile dysfunction (21,22).
hypertension, the degree to which RV hypertrophy develops and serves to maintain systolic function depends, in part, on the rapidity and age of onset of the hemodynamic stimulus. With progressive hypertrophy, RV systolic function may deteriorate, possibly because of intrinsic myocardial contractile dysfunction associated with cardiac hypertrophy. This occurrence is controversial, with some but not all studies of experimentally induced RV hypertrophy showing reduction of intrinsic contractility (16,17,18,19,20). These studies have documented intrinsic contractile derangement during the early stages of pressure-overload hypertrophy, as indicated by reduction in the maximum unloaded velocity and in the maximum rate of tension development of isolated myocardium. However in time, these abnormalities have generally been observed to revert toward normal. Alternatively, a limitation in coronary flow reserve has been documented in animal models and in patients with RV myocardial hypertrophy, and may result in ischemic contractile dysfunction (21,22).
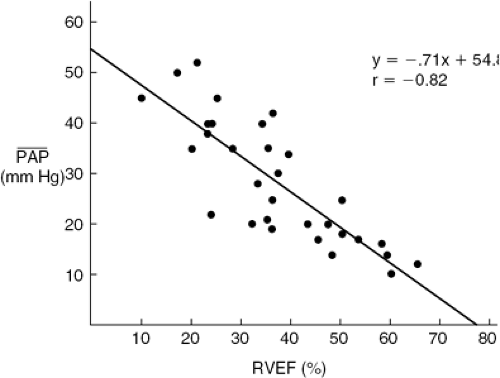 Figure 21-3 Relation between RVEF and mean pulmonary artery pressure (PAP) in patients with diagnoses of coronary artery disease or valvular heart disease. (Reprinted from Korr KS, Gandsman EJ, Winkler ML, et al. Hemodynamic correlates of right ventricular ejection fraction measured with gated radionuclide angiography. Am J Cardiol. 1982;49:71–77 .) |
Depending on the rate and extent of progression of RV pressure overload (of any etiology), RV hypertrophy may be inadequate to maintain a normal level of systolic stress. As RV systolic stress becomes excessive (perhaps compounded by intrinsic RV myocardial contractile dysfunction), ejection performance declines. Under these conditions, the right ventricle generally distends during diastole, in part representing a compensatory mechanism by which preload is recruited to maintain stroke volume. The RV distension is accelerated by the advent of tricuspid regurgitation (TR), which tends to thwart the compensatory Starling mechanism. Thus, in a variety of circumstances, RV pressure overload and volume overload coexist.
Clinical Findings in Right Heart Failure
In clinical practice, systolic and diastolic right heart failure, regardless of cause, often coincide. The clinical expression of right heart failure depends on a combination of elevated systemic venous pressure and depressed cardiac output. Clinical findings depend on the chronicity of hemodynamic derangement. Acute right heart failure, as caused by RV infarction, is characterized by signs and symptoms of depressed cardiac output and elevated jugular venous pressure, often with prominent v-wave and y-descent. Other findings that may be present include RV S3 gallop, a murmur of TR, and the Kussmaul sign (23,24,25,26). Edema has not had time to develop. Acute severe pulmonary embolism presents a similar picture (27,28,29). Additional signs of chronic pulmonary hypertension with RV hypertrophy— RV heave, RV S4 gallop, prominent jugular venous A-wave—may or may not be present because hypertrophy has not had time to develop, and the normal thin-walled right ventricle is limited in the level of PA pressure that it can generate (30,31).
With chronic right heart failure of any cause, edema becomes a prominent feature (32). In addition to peripheral edema and ascites, edema of the visceral organs contributes to alteration in hepatic, renal, and intestinal function. Pleural effusions develop as a result of impediment to parietal pleural drainage. Other clinical signs depend on the etiology of right heart failure. For example, pulmonary vascular disease or recurrent pulmonary emboli are associated with signs of pulmonary hypertension and RV hypertrophy: RV heave, loud pulmonic component of the second heart sound, and RV S4 gallop (27,28,29).
Systemic Neurohormonal Responses
Systemic neurohormonal activation plays an important role in mediating the clinical manifestations of right heart failure. The development of edema (discussed later) is supported by renal sodium retention provoked by reduced forward cardiac output and perturbation of neuroendooine activity (33). These mechanisms are described in detail elsewhere in this volume. In brief, reduction in cardiac output directly reduces glomerular filtration rate, diminishing tubular sodium delivery. Activation of the reninangiotensin-aldosterone axis stimulates sodium-potassium exchange (34,35). In the setting of right heart failure, increased renin secretion, leading to enhanced vasocon-striction and sodium retention, is accentuated by augmented adrenergic activity (35). The latter is supported by impairment of baroreceptor function (36).
An increase in right atrial (RA) pressure stimulates release of atrial natriuretic peptide (ANP), and patients with heart failure have been found to have a two- to tenfold increase in circulating levels of ANP compared with normals (37,38,39,40). However, in patients with heart failure, end-organ responsiveness to ANP is severely reduced (41). This feature accounts for further reduction in glomerular filtration rate through glomerular afferent arteriolar constriction and may accelerate tubular sodium resorption.
Differential Neurohormonal Responses in the Left and Right Ventricles
Cardiac neurohormonal stimulation and response are differentially regulated across the two ventricles in a manner that appears to be linked to the nature of the hemodynamic derangement. In a rat model of LV infarction and failure, regional sympathetic activity, as assessed by ventricular norepinephrine turnover, is increased within the left ventricle but not the right ventricle (42). Increased regional sympathetic activity may be responsible for the finding of differentially reduced β-receptor density and diminished adenylyl cyclase activity within the left but not the right ventricle within the same animal model (43). On the other hand, in this model of left heart failure, RV myocardial concentrations of both norepinephrine and epinephrine are increased, whereas similar increases have not been observed in other organs (42). These observations may imply a specific increase in RV uptake of circulating catecholamines in the setting of left heart failure. In contrast to the rat myocardial infarction (MI) model, heart failure in the spontaneously hypertensive rat has been found to be associated with preferential down regulation in RV β-receptor density (44).
Experimentally induced right heart failure has been found to diminish RV norepinephrine uptake-1 carrier density and norepinephrine uptake activity (Fig. 21-4) (45). This abnormality appears to be directly related to a
regional perturbation of cardiac function, perhaps because of altered myocardial stress, as it was not evident within the LV myocardium in a model with isolated right heart failure (45). Reduced norepinephrine uptake may, in part, be responsible for excess exposure of myocardial β receptors to circulating and neuronally released norepinephrine, thereby yielding reduced norepinephrine sensitivity.
regional perturbation of cardiac function, perhaps because of altered myocardial stress, as it was not evident within the LV myocardium in a model with isolated right heart failure (45). Reduced norepinephrine uptake may, in part, be responsible for excess exposure of myocardial β receptors to circulating and neuronally released norepinephrine, thereby yielding reduced norepinephrine sensitivity.
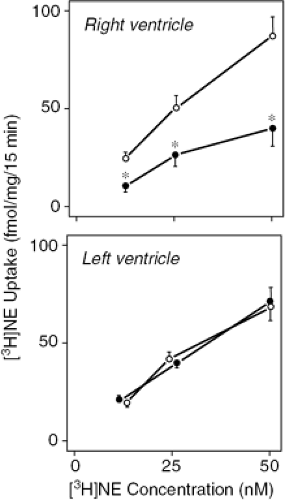 Figure 21-4 Specific 3H uptake activity (representing tissue 3H-norepinephrine [NE] uptake), at three concentrations of 3H-NE, using fresh tissue slices taken from the right and left ventricular free walls of sham-operated dogs (open circles) and dogs with experimentally induced right heart failure (closed circles). In dogs with right heart failure, there is reduction in NE uptake within right ventricular, but not left ventricular, myocardium. (Reprinted from Liang CS, Fan TH, Sullebarger JT, et al. Decreased adrenergic neuronal uptake activity in experimental right heart failure. A chamber specific contributor to beta-adrenoceptor downregulation. J Clin Invest. 1989;84:1267–1275 .)*Significant difference from sham-operated group. |
Thus, regulation of RV sympathetic activity and of signal transduction pathways is complex, is influenced by differences in the hemodynamic state, and is distinct from regulatory mechanisms occurring in the left ventricle.
Pathogensis of Edema
Edema of peripheral tissues and systemic organs, a prominent feature of chronic right heart failure (32), generally requires both elevation of central venous pressure and a stimulus for renal sodium and water retention. Because detectable edema requires an increase of approximately 5 L of extracellular fluid in an adult human (46), hemodynamic derangement must be prolonged before edema becomes apparent. Additional factors may accelerate the development of edema. Normally, competent venous valves and muscular activity in anatomically dependent zones tend to mitigate against transudation of intravascular fluid to the extravascular compartment. Potential factors that may provoke or accentuate tissue edema include incompetence of peripheral venous valves, muscular inactivity, and reduced plasma oncotic pressure.
Manifestations of right heart failure are not merely the direct effect of altered RV hemodynamics. Rather, the right heart interfaces with, and contributes to, a perturbed neurohormonal milieu. A vicious cycle is established, with altered RV systolic and diastolic performance leading to vascular, renal, and neuroendocrine abnormalities, leading to further right heart dysfunction as a result of progressively abnormal RV loading conditions.
In patients with heart failure, excess pleural fluid is most common when elevations of pulmonary venous pressure and central venous pressure coincide. Pleural fluid is drained (a) by parietal pleural lymphatic vessels that empty into the systemic veins, as well as (b) via visceral pleural communication to the pulmonary venous system (47,48,49). Therefore, in the presence of left heart failure or right heart failure in isolation, one drainage route is likely to compensate for failure of the alternate route. In studies of patients with chronic cor pulmonale and elevated RA pressure, in the absence of left heart failure, pleural effusions have not been frequently observed (50). However, pleural effusion has been ascribed to systemic venous hypertension without pulmonary venous hypertension in the setting of acute RV MI (25,51). It is likely that in patients with chronic right heart failure, without left heart failure, alternative pleural drainage routes, which are not operative acutely, are ultimately recruited.
Clinical findings published in the 1940s tended to support the view that pleural effusions secondary to heart failure occurred predominantly on the right (52,53,54). However, more recent postmortem and clinical studies have indicated that between 70% and 90% of patients with heart failure and pleural effusions manifest bilateral pleural fluid (55,56). In the small number of patients with unilateral effusions, the ratio of right-sided to left-sided effusions is approximately 2 to 1. Differences between the findings of older versus newer literature have been attributed to implementation of potent diuretics (56). In patients in whom pleural effusions occur in association with primary pericardial disease, the pleural fluid has been observed to be predominantly left-sided (57). It has been speculated that this finding may be directly related to the presence of pericardial inflammation (57). Pleural effusions caused by heart failure are predominantly transudative, being primarily the product of abnormal hydrostatic forces. In some studies, diuresis has been observed to transform the chemical composition of pleural fluid to that of a “pseudoexudate” (58), although others have found this occurrence to be unusual (59).
In patients with heart failure, failure of systemic organs predominantly results from a combination of increased venous pressure and reduced arterial perfusion. Tissue ischemia tends to accelerate formation of interstitial edema through capillary membrane injury. In turn, edema contributes to tissue ischemia through an increase in interstitial pressure, thus impeding blood flow. A vicious cycle is established that may be acutely exacerbated by an abrupt increase in venous pressure and/or an abrupt reduction in perfusion pressure. These events may lead to chronic renal dysfunction, sometimes with superimposed acute tubular necrosis. Similarly, severe right heart failure is frequently
associated with chronic hepatic dysfunction as a result of the combination of edema, ischemia, and impediment to venous drainage, with chronic elevation in serum transaminase as well as alkaline phosphatase and bilirubin. The latter is often predominantly indirect, indicating a deficiency in conjugation. Acute severe liver injury is common and may or may not be preceded by abrupt oven elevation in systemic venous pressure. Severe elevation in serum transaminase may occur and may be associated-with a cholestatic picture it is not uncommon that these findings are confused with acute viral hepatitis or chronic primary liver disease until it is appreciated that central venous pressure is elevated. Furthermore, because venous pressure may fluctuate and because abrupt reduction of hepatic arterial perfusion, rather than abrupt increase in hepatic venous pressure, may be the direct stimulus to liver necrosis, systemic venous pressure may not be severely elevated at the time when hepatic injury is clinically recognized.
associated with chronic hepatic dysfunction as a result of the combination of edema, ischemia, and impediment to venous drainage, with chronic elevation in serum transaminase as well as alkaline phosphatase and bilirubin. The latter is often predominantly indirect, indicating a deficiency in conjugation. Acute severe liver injury is common and may or may not be preceded by abrupt oven elevation in systemic venous pressure. Severe elevation in serum transaminase may occur and may be associated-with a cholestatic picture it is not uncommon that these findings are confused with acute viral hepatitis or chronic primary liver disease until it is appreciated that central venous pressure is elevated. Furthermore, because venous pressure may fluctuate and because abrupt reduction of hepatic arterial perfusion, rather than abrupt increase in hepatic venous pressure, may be the direct stimulus to liver necrosis, systemic venous pressure may not be severely elevated at the time when hepatic injury is clinically recognized.
Anorexia, malabsorption, and reduced responsiveness to oral medications have been attributed to intestinal edema in patients with right heart failure. However, cachexia in heart failure is likely to be multifactorial, resulting from a combination of anorexia, malabsorption, relatively increased metabolic demand, and possibly humoral factors (60,61,62,63,64). Recently, patients with heart failure and cachexia have been found to have increased circulating levels of tumor necrosis factor, which may play a causative role in this syndrome (65).
Assessment of Right Ventricular Function
In the past the importance of the right ventricle in cardiac disease had been largely underestimated. It is now well known that right ventricular volume, mass, and function influence outcomes of many cardiac disease syndromes, such as MI, chronic heart failure, and a variety of congenital malformations.
Quantification of ventricular function is technically more difficult and less exact for the right ventricle than for the left ventricle. While the elliptical left ventricle resembles a more convenient volumetric model, the RV has a complex, crescentic shape that defies a conventional geometric description. This is compounded by coarse trabeculations, a separate infundibulum, a thinner myocardium, geometric complexity with discrete inflow and outflow portions, as well as variations in right ventricular shape which occur with altered loading conditions (66).
The RV chamber is bounded by a free wall and a thick-walled septum that occupies most of the posterior and medial surfaces of the chamber. The RV body, or inflow region, is normally concave around the intrerventricular septum. Contraction resembles the movement of a rounded bellow, the walls of which approach each other in a parallel manner during systole. Across the base of these bellow is the crista supraventricularis, which is a thick muscle bundle that closes the bellows during normal systolic contraction. The other walls are thin and their trabeculae act as chords to assist in bellows closure during systole. Therefore, unlike what is seen in the left ventricle, wall motion observed in one region of the RV may in fact be due to muscle contraction occurring at a distance from that wall (67).
As mentioned previously, the RV often changes its shape and its motion patterns substantially in the setting of pressure and/or volume overload. Paradoxical septal motion seen with prolonged pressure overload consists of septal endocardial and epicardial movement toward the RV during systole, rather than its normal pattern toward the center of the LV cavity (though wall thickening is preserved). In patients with volume overload, the curvature of the inter-ventricular septum is displaced toward the left ventricle at end-diastole, concave toward the right ventricle because of the increased diastolic load. At end-systole, the ventricles return toward a more normal configuration, resulting in motion of the septum toward the RV (68,69,70,71,72,73,74,75,76).
For all of these reasons, the RV is poorly amenable to geometric modeling for the purpose of volume measurement. Despite these difficulties, numerous studies have examined imaging modalities to estimate relative change in RV volume through the cardiac cycle and thus to measure RVEF.
Most studies investigating RV function have found the range of normal ejection fractions to be lower than that of the left ventricle. The lower limit of RVEF has generally been found to be in the range of 40% to 45%. This finding indicates that normal end-diastolic and end-systolic volumes are larger for the right ventricle than for the left ventricle, with the upper limit of normal for RV end-diastolic volume estimated as 120 mL/m2 (77).
Right ventricular function may be assessed by the use of any modality with the capability of estimating relative changes in RV volume; this is a field that has changed rapidly over the past 5 to 10 years. Several modalities have been investigated, including contrast ventriculography, radionuclide ventriculography, echocardiography, magnetic resonance imaging, and cine computerized tomography.
Contrast Ventriculography
Contrast ventriculography, performed by the catheter administration of radiocontrast media, was the first method employed for visualization of the right ventricle. This technique had long been the gold standard for assessment of RV volumes and functional measurements. In order to estimate ventricular volumes, this method typically requires an assumption of a geometric model for approximating the overall ventricular shape. Additionally, Simpson’s rule can be used, where the ventricle is divided into a series of segments and the volume of each segment is derived after approximating its shape. There are several factors that diminish the accuracy of these methods, however. First, it is more difficult to accurately delineate the borders of the ventricular cavity at end-systole as a result of the heavy trabeculations. Secondly, the previously mentioned tendency for the RV shape to be significantly changed as a result of various pathological states and their resulting altered loading conditions render any geometric models to essentially be rough estimates of cavity shape. Finally, as opposed to the LV which retains its elliptical shape during systole, the RV cavity contour may be significantly different at end-systole when compared to end-diastole (78,79,80).
There are other pitfalls of contrast ventriculography to consider, as well. Even though right heart catheterization carries less of a risk than left heart catheterization, the test is still an invasive procedure. Furthermore, injection of contrast media into the right ventricle is not without risk, especially in those with RV disease or elevated pulmonary pressures. The procedure is time-consuming and often requires the employment of rigorous methodology. As a result of all of these factors, it cannot be routinely utilized for repeated measurements in a serial manner when following patients who would otherwise not need a right heart catheterization (79).
Radionuclide Ventriculography
Radionuclide ventriculography (RVG) is a method that was first introduced in the early 1970s. It uses intravascutar agents that emit gamma radiation subsequently detected by an external device to visualize the cardiac chambers. Two applications of RVG have generally been used to assess RV volume and function. These include first-pass radionuclide ventriculography and equilibrium radionuclide angiography (ERNA).
The first-pass method is well-suited for visualization of the right heart because it precedes pulmonary and systemic tracer circulation and, as a result, there is an absence of background or chamber overlap. Even though there is a lack of dependence on geometric assumptions, there are still significant problems with the first-pass method. Only several cardiac cycles can be incorporated into the study and, as a result, accuracy may be diminished in the setting of motion or arrhythmia. In addition, the advantage of minimal background activity is lost when repeated studies are needed in the setting of acute interventions (78). Although widely used in the past for calculations of intracardiac shunting, most laboratories have little experience with this technique in the contemporary era.
ERNA is a method with several advantages to first-pass imaging. It is a technique that allows image acquisition to occur over several minutes. Numerous cardiac cycles are incorporated into the study by electrocardiographic gating, thus increasing the temporal resolution as well as reducing the likelihood that the presence of a transient arrhythmia will diminish the accuracy of the study. It should also be noted that there is a high degree of correlation with first-pass scintigraphy for RVEF as well as minimal intraobserver variation (81), but there still exists the problem of overlap between the RV and its surrounding chambers. The overlap between the right and left ventricle is minimized in the left anterior oblique (LAO) view and a modified LAO view helps to minimize the overlap between the RA and RV. Furthermore, overlap may be exacerbated in conditions where the RA or RV is enlarged (78,82). RVG is noninvasive, easy to perform, not time-consuming, and has a fairly high level of accuracy and reproducibility that is not subject to a patient’s body habitus, as is often the case with echocardiography, for example.
There are some disadvantages to RVG that must be considered when contemplating the ideal imaging modality for the RV. While it is suitable to evaluate the size and performance of the RV, it lacks the ability to evaluate wall thickness and RV mass. In addition, there is exposure to ionizing radiation, especially when applied in a serial manner for follow-up studies. This technique also suffers from attenuation artifacts as well as difficulty in minimizing the overlap of the RA and RV. As a result, there is an underestimation of EF when compared with values obtained via contrast ventriculography (67,83). Nonetheless, although absolute volumes and EF may be systematically overestimated and underestimated, respectively, changes in those parameters in serial studies over time, as in a clinical trial examining the effect of a therapy on the RV in heart failure, for example, may be robust.
Echocardiography
In the past, M-mode, two dimensional, and Doppler echocardiography were the only ultrasound-guided approaches available to clinicians for visualization of cardiac structures. These techniques have been useful in the evaluation of the size and function of the left ventricle but their use has been somewhat limited in assessing the right ventricle. More recently, however, three-dimensional echocardiography has become an increasingly available and promising tool, more applicable to the unusual structure of the right ventricle.
Because of the complex geometry and the peculiar changes seen with volume or pressure overload for the right ventricle that have been outlined earlier, it is difficult to derive any quantitative indices of RV function by two-dimensional echocardiography (78). This technique has been able to provide information regarding RV volume and can reliably differentiate RV volume overload from a normal right ventricle. Assessment of RV function has been limited by difficulties in defining the endocardium properly, as well as the complex RV geometry that has been previously outlined. As a result, routine two-dimensional echocardiographic assessment of the right ventricle has been somewhat limited and has largely been qualitative (84,85).
Doppler echocardiography has provided the ability to accurately assess RV systolic pressures, as RV pressure overload is generally associated with functional tricuspid regurgitation. The systolic pressure gradient between the RV and the RA may be estimated by the modified Bernoulli formula, 4V2, where V is the peak velocity of the regurgitant tricuspid jet. Addition of an estimated RA pressure yields an accurate assessment of RV systolic pressure (86).
Three-dimensional echocardiography is a relatively new and promising technique that permits noninvasive imaging of the RV in real time. It overcomes some of the limitations of two-dimensional echo by reconstructing the ventricle without the need for geometric assumptions or standardized imaging planes. It combines multiple intersecting planes, thereby improving the consistency of border detection (87,88). Studies have shown that three-dimensional echo is a reliable method to assess end-diastolic volumes of normal and diseased right ventricles and it has the ability to take into account variations of RV anatomy (89). End-systolic volumes are less accurate, and this is probably due to the fact that RV trabeculations are more pronounced in systole than in diastole and, as a
result, may influence identification of the endocardial borders. RV mass measurements are thought to be less accurate as well, likely due to the difficulties encountered in obtaining two-dimensional transthoracit datasets which include the entire epicardium, especially at the apex and the apical free wall of the RV (90).
result, may influence identification of the endocardial borders. RV mass measurements are thought to be less accurate as well, likely due to the difficulties encountered in obtaining two-dimensional transthoracit datasets which include the entire epicardium, especially at the apex and the apical free wall of the RV (90).
In addition to the difficulties in assessing end-systolic volumes and RV mass, there remain technical challenges to wider use of three-dimensional echocardiography. Data acquisition and image reconstruction are still time-consuming and burdensome. One improvement may take the form of improved automatic border detection software; however, cost is still somewhat prohibitive. An advantage of three-dimensional echocardiography, however, is that volumetric data may be assessed without cardiac or respiratory gating in real time and the technique is completely noninvasive, theoretically allowing image acquisition with a handheld transducer and a portable machine.
Computed Tomography
The improvement seen in spatial and temporal resolution with multidetector row CT (MDCT) compared to spiral and electron beam CT has opened up many new possibilities in cardiac imaging. With multidetector scanning, it is possible to acquire high-resolution, three-dimensional images of the heart and great vessels. Cardiac CT is especially useful in evaluating the myocardium, coronary arteries, pulmonary veins, thoracic aorta, pericardium, and cardiac masses. In addition, studies have shown that assessment of global right ventricular function with cardiac 16-detector-row CT is possible and reproducible (91); however, much of the research has been focused on MDCT and its ability to detect coronary artery disease. Nonetheless, studies have now shown that CT assessment of RV volume is reasonably precise and reproducible, as is assessment of RV mass (Fig. 21-5) (92,93).
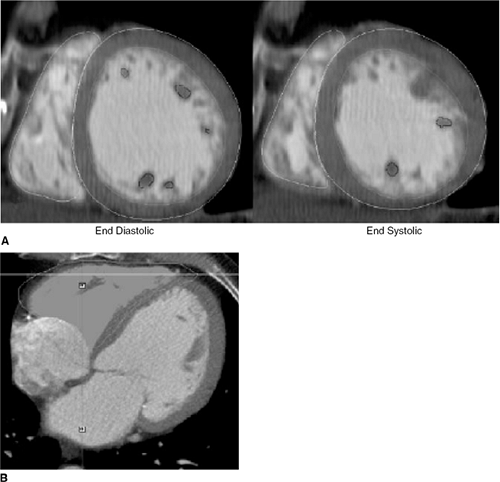 Figure 21-5 (A) Representative short axis view of the right and left ventricles by multidetector computed tomography (MDCT) at end diastole and end systole with the endocardial borders outlined. (B) Axial MDCT image with the right ventricle as the region of interest, shaded gray. (Reprinted from Koch K, Oellig F, Oberholzer K, et al. Assessment of right ventricular function by 16-detector-row CT: comparison with magnetic resonance imaging. Eur Radiol. 2005;15:312–318 .) |
With regard to RV function, there is good correlation with magnetic resonance imaging (MRI) for RV stroke volume and RVEF. End-systolic and end-diastotic RV volumes have also shown fairly good correlation with MRI studies, but there appears to be a slight overestimation of these volumes with MDCT. This is likely due to the limited temporal resolution of MDCT compared with MR imaging (91). This latter limitation may be attenuated as more advanced CT technology with 32- and 64-detector-row CT scanners becomes more widely available; however, there is a paucity of data at this time focusing on the assessment of RV function with this more advanced technology.
MDCT is clearly an evolving technology, but it does not represent the test of choice when assessing RV volume and mass at this time. The presence of a regular cardiac rhythm is essential for optimum acquisition and, with 16-slice equipment the necessary breath-hold of 20 to 25 seconds and the contrast load can be too burdensome for some patients. As 64-slice technology becomes more widespread, requiring only 5 seconds of breath-hold, research into this area will likely advance, as it will facilitate the study of patients with heart failure. Moreover, as more implantabie cardiac defibrillators are placed and such patients become ineligible for MRI examination, the role of cardiac CT will likely grow substantially in the near future for evaluation of ventricular volumes and function.
Magnetic Resonance Imaging
Cardiac magnetic resonance (CMR) imaging has become a sophisticated diagnostic technique for cardiovascular imaging that utilizes high intensity magnetic fields and radiofrequency to generate three-dimensional/tomographic images, resulting in studies with high resolution and excellent contrast. There are several available techniques within the MRI system, but two are the mainstay of clinical CMR: spin echo imaging and cine MRI. Spin echo imaging depicts tissue structures of the heart as bright and the blood pool as dark; it is largely employed for the evaluation of anatomy and structure, assessing myocardtal mass or regions of infarction, as well as identifying the fatty infiltration seen in arrhythmogenic RV dysplasia, for instance (94). The other technique, cine MRI, generates images in which the blood pool is bright and the cardiac structures are dark; it is used primarily to evaluate ventricular function and volumes, valvular lesions, and to detect intracardiac masses. This stark contrast between blood and tissue allows accurate assessment of the ventricular wall, function, and size of the chamber.
CMR has demonstrated substantial accuracy and reproducibility in assessing LV volumes, function, and mass. Because of the aforementioned geometric difficulties in assessing the RV, CMR is an ideal modality to examine the RV because of the three-dimensional volume acquisition of the chamber (83), and the complete tomographic interrogation of the three-dimensional structure in the absence of overlap (Fig. 21-6). CMR of RV volumes has shown excellent correlation with other techniques such as contrast ventriculography and RVG (95). It has also shown good interstudy reproducibility for RV function, which is key when monitoring a patient’s response to a therapeutic intervention over a long period of time or for use in clinical trials (83).
One distinct advantage of CMR is that RV volume measurements can be performed irrespective of the ventricular shape and, as a result, CMR is now considered to be the gold standard of RV volume assessment (89). In addition, CMR can provide any desired imaging plane without the need for contrast or ionizing radiation. It is a noninvasive, safe, and repeatable technique. Furthermore, there is no problem with the poor acoustic windows that can be encountered in echocardiography. Despite the need for expensive nonportable equipment, as well as a long and complicated examination, CMR can now be considered the preferred noninvasive modality for determining RV volume, mass, and function.
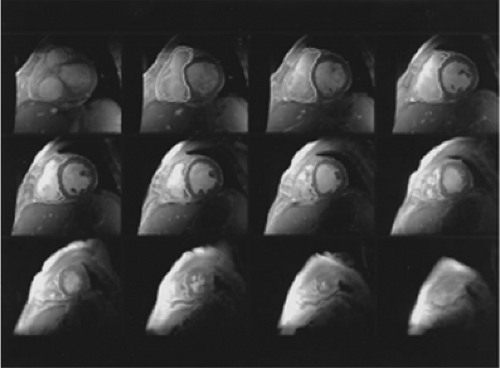 Figure 21-6 Representative cardiac magnetic resonance (CMR) images: contiguous end-diastolic short axis images covering both ventricles from base to apex in a patient with a dilated cardiomyopathy. The epicardial and endocardial boundaries are easily traced for mass and end-diastolic volume calculations. End-systolic volumes, end-diastolic volumes, and ejection fraction can be calculated once the full coverage images are obtained. (Reprinted from Grothues F, Moon J, Bellenger N, et al. Interstudy reproducibility of right ventricular volumes, function, and mass with cardiovascular magnetic resonance. Am Heart J. 2004;147(2):218–223 , with permission.) |
Etiologies of Right Ventricular Failure
Table 21-1 presents a differential diagnosis of right heart failure, broadly subdivided into primary myocardial dysfunction, pressure overload, and volume overload. As previously mentioned, these pathophysiological states often coexist. The most common cause of RV pressure overload, left heart failure, is further discussed in a later section. In addition, RV failure may be simulated by disorders that impede inflow into the right ventricle. These disorders include tricuspid stenosis, cardiac tamponade, pericardial constriction, and restrictive myopathy. Although this category is not discussed here in detail, restrictive myopathies are covered in the Cardiomyopathy section.
Right Ventricular Myocardial Dysfunction
Right Ventricular Myocardial Infarction
The clinical syndrome of RV MI was first described in the 1970s as a syndrome involving diminished cardiac output with dear lungs and jugular venous distension (23,25,96). Since those initial descriptions, the described clinical spectrum of RV involvement in myocardial infarction has broadened considerably (97,98,99). Pathologically, infarction involving the right ventricle most often is an accompaniment of infarction involving the posterior free wall of the left ventricle and the posterior portion of the ventricular septum (96). The extent of involvement of the RV
free wall is variable and does not necessarily correlate with the degree of hernodynamic perturbation. Profoundly abnormal hemodynamics may be observed in the presence of an anatomically small extent of RV involvement with infarction. Less common pathologically is involvement of the anterolateral RV free wall with anterior infarctions (99). These infarctions tend to be anteroseptal, extensive, and associated with moderate to severe reduction in LV ejection fraction (99). Hemodynamically relevant RV infarction almost always signifies evidence of right coronary occlusion proximal to the RV free wall branches (100).
free wall is variable and does not necessarily correlate with the degree of hernodynamic perturbation. Profoundly abnormal hemodynamics may be observed in the presence of an anatomically small extent of RV involvement with infarction. Less common pathologically is involvement of the anterolateral RV free wall with anterior infarctions (99). These infarctions tend to be anteroseptal, extensive, and associated with moderate to severe reduction in LV ejection fraction (99). Hemodynamically relevant RV infarction almost always signifies evidence of right coronary occlusion proximal to the RV free wall branches (100).
Table 21-1 Differential Diagnosis of Right Heart Failure | ||
|---|---|---|
|
Elevation of jugular venous pressure in a patient with an electrocardiographic inferior infarction usually indicates RV infarction. Right precordial leads often document RV infarction, with ST elevation in leads V3R and V4R (98). RVG or echocardiography may demonstrate RV dilation with regional and global RV functional abnormalities (101). Hemodynamic measurements in the setting of acute RV infarction most commonly reveal elevation of RA and RV diastolic pressure, which are often equilibrated with PA diastolic and PA wedge pressures, a pattern similar to pericardial constriction (23,34,96). The RA pressure wave form often resembles an M or a W, with y descent deeper than x descent. In some patients, however, these findings are not seen, and low pressures may be observed in both the right atrium and the pulmonary wedge position. In such patients, the hemodynamic abnormalities may be brought out by volume loading (102). The constellation of hemodynamic findings seen in RV infarction appears to require the presence of an intact pericardium, in animal models of RV infarction, the hemodynamic abnormalities improve markedly following pericardiotomy (103).
Stay updated, free articles. Join our Telegram channel

Full access? Get Clinical Tree


