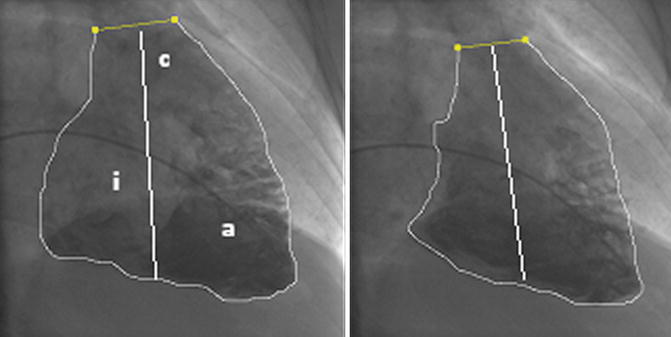
Fig. 6.1
End-diastolic and end-systolic right ventricle (RV) angiogram in the RAO 30° projection in a patient evaluated for LVAD (left ventricular assist device) implantation. The letters correspond to anatomical parts of the RV (i inflow, a apical, c conus). The area and the length required for volume calculation, with the method of Ferlniz, are demonstrated. The RV ejection fraction is reduced, but the generated pulmonary artery pressure was high 81/32 (mean 53 mmHg) with a calculated RVWI (RV work index) of 10.2 g.m/m2/beat. This means that the high afterload was responsible to a great extent for the RV dysfunction. The patient had an uneventfull LVAD implantation (see sect. 6.17)
The conductance catheter is a multielectrode catheter that reads between pairs of electrodes the differences in voltage; this reflects the local conductance and regional blood volume. When combined with a pressure measuring micromanometer, pressure–volume loops can be recorded that give detailed insight into the pump function and performance of the heart. The catheter has to be deployed along the length of the ventricle, and for the RV, this means from the jugular vein. The use of conductance catheters has limitations due to the absence of a homogenous electrical field (multiple trabeculations) and the crescent shape of the RV, becoming more accurate when the RV becomes overloaded and spherical with less longitudinal motion. Right ventricular stroke volume is calculated as the difference between the end-diastolic and end-systolic volume. It is obvious that the angiographic and conductance catheter stroke volume includes the forward and backward ejected volume. In the absence of shunt physiology and valve regurgitation, the ejected volume of the RV and the LV should be equal, but due to the higher end-diastolic volume of the RV, the calculated ejection fraction of the RV is normally lower.
6.6 RV Wall Motion and Tricuspid Regurgitation by Contrast Angiography
Severe RV dilation and dysfunction are easy to recognize by almost any imaging modality, but angiography provides excellent delineation of the ventricular contour throughout the cardiac cycle, which cannot be reliably obtained by other imaging modalities. Identification of subtle abnormalities can be aided by quantitative wall motion analysis, but the complex structure of the RV may lead to overinterpretation of alleged abnormalities. A compelling reason to use RV angiography is the evaluation of patients with arrhythmias [13, 14].
Tricuspid regurgitation can be demonstrated by RV angiography. The angiographic grading system of the degree of tricuspid regurgitation is similar to the grading system used for the evaluation of mitral regurgitation. It has the same limitations that are related to the size of the right atrium and heart rate, which affect the degree of retrograde opacification and the same requirement for the absence of ventricular extrasystoles. A scale of 1+ to 4+ has been described with 1+: minimal regurgitant jet in systole, which clears rapidly; 2+: regurgitant jet with persistent partial opacification of the right atrium; 3+: dense opacification of the entire right atrium; and 4+: dense opacification of the entire right atrium and both venae cavae [15].
6.7 Cardiac Output
Measuring the cardiac output (CO) and effective stroke volume in absolute terms is important in the evaluation of the systolic function of the ventricle and the calculation of vascular resistance; based on these measurements, important decisions are made concerning the management of patients with PAH and heart failure. The significance of estimating the true value of CO is obvious, and the method used to measure the CO, the accuracy, and the precision of the method and the factors that may affect them should be stated. The more accurate the method, the closer the mean value of measurements to the “true” value and the more precise the smaller the standard deviation of repeated measurements.
Cardiac output is measured with techniques based on the Fick principle [16]. The principle states that the total uptake or release of any substance by any organ is the product of the blood flow to the organ and the arteriovenous concentration difference of the substance. In the Fick oxygen method, we calculate the blood flow (CO) by dividing the oxygen consumption (ml/min) by the difference of arterial and mixed venous oxygen content in ml of oxygen/L of blood. The oxygen content, without considering the dissolved O2, is calculated by multiplying the theoretical maximal oxygen-carrying capacity of hemoglobin with the percent O2 saturation and converting hemoglobin concentration per dL to L by multiplying by the factor 10: [(hemoglobin in g/dL) × (1.36 ml O2/g Hb) × 10 × (% saturation)]. In the absence of shunts, the most reliable site for obtaining mixed venous blood is the pulmonary artery and, for arterial blood, any arterial site. A small amount of venous blood coming from bronchial and Thebesian venous drainage is admixed with the pulmonary venous blood lowering the arterial blood oxygen saturation. An arterial saturation of >95 % is considered as physiological in patients with normal respiratory function. In case the saturation is lower, a right-to-left shunt has to be excluded before accepting the arterial saturation value for the calculation of the cardiac output. In case pulmonary arterial blood cannot be obtained or an atrial septal defect is present, the value of mixed venous blood oxygen saturation (SvO2) at rest can be approximated by the Flamm formula with sampling of blood from the superior vena cava (SVC) and inferior vena cava (IVC): SvO2 = [(3× S svcO2 + 1× S ivcO2)/4].
A practical problem with the Fick oxygen method is the need for the measurement of oxygen consumption, which requires special equipment, mostly used in cardiopulmonary laboratories. This has led to the development of formulas to predict the oxygen consumption based on the body surface area (BSA) (125 ml/min x BSA, Dehmer formula) or in addition to BSA based on age and sex (Bergstra formula) and additionally based on heart rate (LaFarge formula) [17]. Unfortunately, all the proposed formulas give values that are frequently very different from the values found with the direct measurement of oxygen consumption.
The thermodilution method is a specific application of the Fick principle. The indicator is heat, provided by bolus injection of a certain volume of cold solute in the right atrium or by a heating element spanning the RV. The latter eliminates the error associated with hand bolus injections. The rapid change in temperature is measured with a thermistor close to the tip of the pulmonary artery catheter. The temperature curves obtained depend on the flow of blood, with an early temperature peak and a small area under the curve, when the flow is high, or a delayed peak with a large area under the curve, when the flow is low (Fig. 6.2). The pulmonary artery catheter with the heating element provides intermittent information averaged over 3–6 min, which makes it slower to display any acute changes but less prone to variations of heart rate and respiration.


Fig. 6.2
Thermodilution curves obtained by hand injection of cold saline through the proximal port of the thermodilution catheter. Visual examination of the tracings is important for the best interpretation of the cardiac output values. See text for details
The calculation of CO by thermodilution has been well validated compared with the calculation of CO using the direct Fick oxygen method. A standard deviation of up to 8 % of the mean value of repeated measurements is expected [18] which introduces a significant error when the CO is low. In addition, underestimation of CO can occur in patients with tricuspid regurgitation due to reflux and recirculation of the injectate (late peak with prolonged washout) (Fig. 6.2). In the presence of shunts, right to left or left to right, the CO may be overestimated by thermodilution. In contradistinction, the calculation of CO by the Fick oxygen method is not affected by tricuspid regurgitation and is more precise at a lower CO, because the high value of arterial–venous difference, when the flow is slow, is less affected by small errors in saturation values.
6.8 Principles of Pressure Recording and Measurement
It is important to reiterate crucial points in obtaining pressure measurements which are related to the zero reference level, the frequency response and damping of the pressure recording system, and the timing of pressure measurements [19].
6.8.1 Zero Reference Level
The reference point for pressure measurements is very important especially for low pressure values. For example, a 5 mmHg difference in pulmonary capillary wedge pressure (PCWP) due to a 7 cm height difference in the leveling of the pressure transducer is much more important in diagnosis and treatment than a 5 mmHg difference in the systolic aortic pressure. Traditionally, the zero reference level at midchest level is used (half of the anteroposterior thoracic diameter measured at the level of the angle of Louis), because on fluoroscopy in a lateral projection with the patient supine, the heart and aorta are located midway between the sternum and the table top. If we want to obviate the confounding factor of hydrostatic pressure, the transducer should be positioned at the top of the vessel or chamber being measured [20] (Fig. 6.3). This can be done by measuring with echo the distance from the anterior chest wall to the top of the chamber, which for the LV and RA is approximately 5 cm at the fourth intercostal space. It cannot be overemphasized that precision of the pressure measurements is dependent on consistent zero reference leveling of the transducer, as long as calibration is not required with the newer single-use transducers.
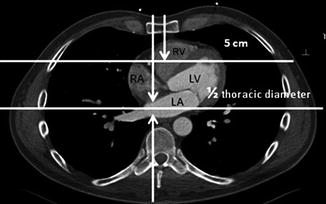

Fig. 6.3
Computed tomography of the chest at the level of the heart demonstrating the possible hydrostatic effects when different reference levels are used (LA left atrium, LV left ventricle, RA right atrium, RV right ventricle)
6.8.2 Frequency Response and Damping of the Pressure Recording System
The pressure wave is a complex periodic wave with a fundamental frequency that can be analyzed further into a series of superimposed sine waves, with differing amplitudes and frequencies (Fourier analysis). The fundamental frequency of 1 Hz corresponds to a period of one cycle per second or 60 beats per min, and the essential physiologic information is contained within the series of the first ten multiples of the fundamental frequency (harmonics). This means that if the pressure system responds to a certain frequency excessively, the pressure waveform gets distorted, something that is difficult to totally eliminate. To ensure a wide response range and move the natural frequency to higher frequencies, a shorter, wide-bore stiff tubing, filled with a low-density fluid without air bubbles, is required, but such a system will be grossly underdamped. Damping introduces friction in the system, and, if optimal, it maintains a nearly flat output/input frequency curve even as the frequency of the input signal approaches the natural frequency of the pressure measurement system. A way this can be achieved is by filling the tubing with a viscous fluid such as radiographic contrast.
It is obvious that measurements which depend on frequency analysis of the pressure waveforms, or simply measuring the diastolic or systolic pressures with fluid-filled catheters, are critically dependent on the natural frequency and damping of the system. In addition, artifacts can appear due to excessive motion of the catheter and fluid acceleration, especially in recordings in the pulmonary arteries (catheter whip) (Fig. 6.4).
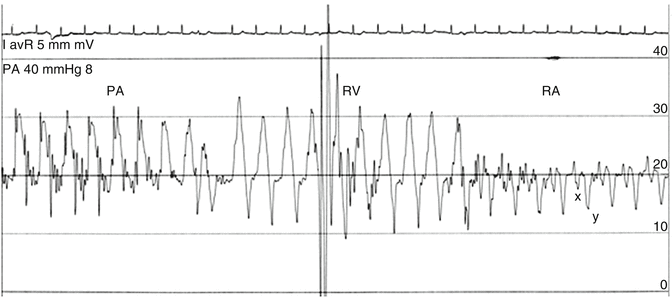

Fig. 6.4
Pullback of a Swan–Ganz catheter from the pulmonary artery (PA), through the right ventricle (RV) to the right atrium (RA) in a patient with acute right ventricular infarction. The constrictive type of physiology is demonstrated by the almost equal diastolic pressures and the presence of a deep “y” descent which coincides with the rapid filling of the right ventricle. The PA tracing demonstrates the excessive movement of the catheter that may make digital measurements inaccurate
6.8.3 Timing of Pressure Measurements
The pressures we measure are the intravascular pressures, but the physiologically effective pressure is the transmural pressure which is the net difference between the intravascular and the extravascular pressure. Because the end-expiratory intrathoracic pressure most closely correlates with atmospheric pressure, it is important that all pressures obtained during the right and left heart catheterization be measured at end expiration [21, 22]. This is especially true in patients in whom there can be significant variation between inspiratory and end-expiratory vascular pressures (obese patients and patients with intrinsic lung disease) (see Fig. 6.13).
6.9 Interpretation of Pressure Waveforms
6.9.1 Right Atrial Pressure
The right atrial pressure (RAP) waveform may present different characteristics in heart failure patients. A waveform consistent with constriction can be seen in patients with cardiomyopathy and anasarca, in RV infarction, in acute mitral regurgitation, and in acute pulmonary embolism with secondary RV dilatation. The underlying mechanism is volume overloading and pericardial constraint. This means that the elevated RAP does not necessarily imply RV dysfunction. This noncompliant RA waveform may be defined by an elevation in mean RAP, a deep “y” decent which typically deepens with inspiration, and absent inspiratory decrease or increase in the post-y plateau (Kussmaul’s sign) (Fig. 6.4). Diastolic equalization of right- and left-sided pressure may be seen in deep inspiration. If we consider the RAP to represent the pericardial pressure, then the transmural pressure of the left ventricle will be very low, which means low preload and low cardiac output despite the elevated PCWP [23]. A similar pattern with an additional large systolic wave (ventricularization of RA waveform) can be seen in severe tricuspid regurgitation (Fig. 6.5).
In restrictive cardiomyopathy, the pattern of the noncompliant RA can be seen, but frequently, a difference between the right diastolic and left diastolic pressures is present, due to the usually heavier involvement of the LV (Fig. 6.6). In the early heart posttransplant period, a similar pattern due to RV systolic and diastolic dysfunction combined with tricuspid regurgitation can be seen.
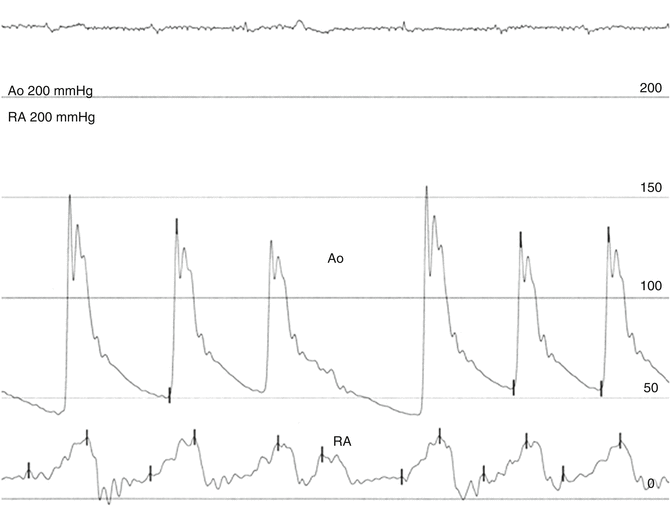
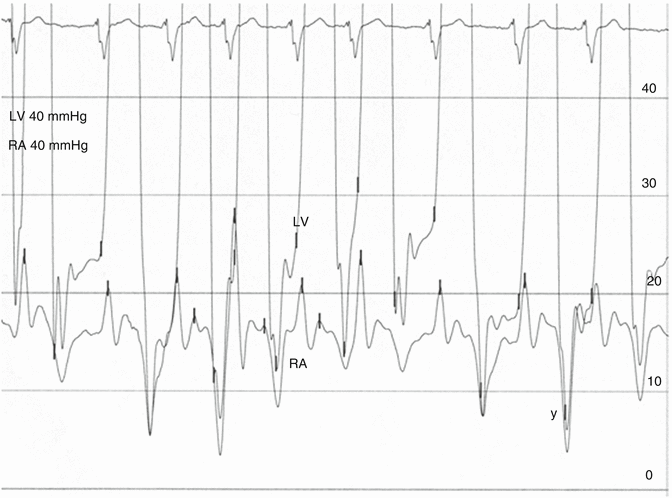

Fig. 6.5
Massive tricuspid regurgitation and atrial fibrillation in a patient with ascites who had mitral valve replacement for mitral regurgitation 7 years earlier. The recorded pressures are in the ascending aorta (Ao) and right atrium (RA). The height of the systolic wave of tricuspid regurgitation depends also on the size and compliance of the right atrium

Fig. 6.6
Pressures recorded in the left ventricle and right atrium in a patient with advanced left heart failure 10 years after a Dor ventriculoplasty procedure and postoperative development of restriction due to the size reduction of the left ventricle. The pressure waveforms are similar to the waveforms in Fig. 6.4 but there is significant difference in diastolic pressures between the LV and RA, consistent with restrictive physiology. For constriction to be considered, diastolic equalization and an out-of-phase respiratory variation of systolic RV and LV pressures are required [24]
6.9.2 Relationship of Right- to Left-Sided Ventricular Filling Pressures in Advanced Heart Failure
The majority of patients with advanced heart failure show elevated RAP and PCWP during right heart catheterization. The PCWP correlates well with the systolic pulmonary artery pressure (SPAP) with the relation SPAP = 2× PCWP but does not correlate very well with the RAP, due to the interposition of the RV. In a sizable minority, the RAP and PCWP do not match, implying a discordance in the function and loading of the ventricles. In patients with advanced heart failure, a RAP ≥10 mmHg can be associated with worsening right heart function as a result of increased left-sided filling pressures (PCWP ≥22 mmHg) or can be the result of intrinsic RV dysfunction suggested by PCWP <22 mmHg [25]. By using the ratio of RAP to PCWP, Drazner et al. defined three tertiles of correlations of increasing steepness, (1) 0.28–0.4, (2) 0.41–0.6, and (3) 0.61–1.2, which were associated with worsening RV function and, in a way, better separated the mechanism of RAP elevation [25]. A RAP/PCWP ratio of >0.63 has been associated with RV dysfunction after left ventricular assist device (LVAD) implantation [26] (Fig. 6.7).
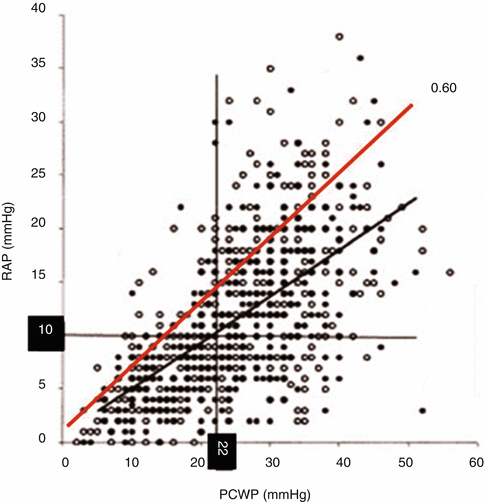

Fig. 6.7
The relationship between right- and left-sided filling pressures in 1,000 patients with advanced heart failure (As adapted from Drazner et al. [27]). A superimposed line at the 0.60 ratio of RAP/PCWP spans three quadrants of the four, indicating potential differences in the subpopulations defined by category or by the RAP/PCWP ratio [25]. In advanced heart failure, high RAP is considered ≥10 mmHg and high PCWP ≥22 mmHg
6.9.3 Intra-abdominal Pressure
An elevated intra-abdominal pressure has significant cardiovascular effects and can be part of a vicious cycle in advanced heart failure. The IVC pressure reflects the intra-abdominal pressure (IAP) but the RAP may not [28]. An elevated IAP is considered, when the pressure is >8 mmHg, and intra-abdominal hypertension, when IAP it is >12 mmHg. Measurement of IAP in patients with advanced heart failure should be considered in order to assist in the management of these patients [29].
6.9.4 Pulmonary Capillary Wedge Pressure (PCWP) and Left Ventricular End-Diastolic Pressure (LVEDP)
The pressure that is transmitted backward to the lungs is the left atrial pressure (LAP), assuming that there is no pulmonary vein stenosis. This pressure cannot be easily obtained directly and is estimated indirectly by the PCWP or LV end-diastolic pressure (LVEDP). The selection of the PCWP or LVEDP for the evaluation of PAH is an important issue because the two measurements do not always correlate [30]. This means that the PAH may be misclassified as being arterial rather than due to left heart dysfunction, when a low PCWP is found and a high LVEDP is present. However, the LVEDP measurement requires a left heart catheterization with the increased risks and inconvenience for the patient and associated cost.
The PCWP is measured after balloon occlusion of a branch of the pulmonary artery which creates a no-flow area in the lung. The pressure measured at the tip of the catheter is the pressure at the other end of a stagnant column of blood. The pressure obtained, when an uninterrupted column of blood is formed, approximates the LAP, but it should not necessarily be equated with the lung capillary pressure which in the presence of flow may be higher; this can be appreciated with the time-related exponential fall in the vascular pressure distal to the balloon occlusion [31]. This means that the PCWP may not explain clinical and imaging findings of increased lung water, which is related to increased capillary pressure. The rapid or delayed decay of pressure may hint on the pathology of the pulmonary vascular tree, with a delayed decay suggesting the presence of arteriolar or postcapillary venular constriction [32] (Fig. 6.8).
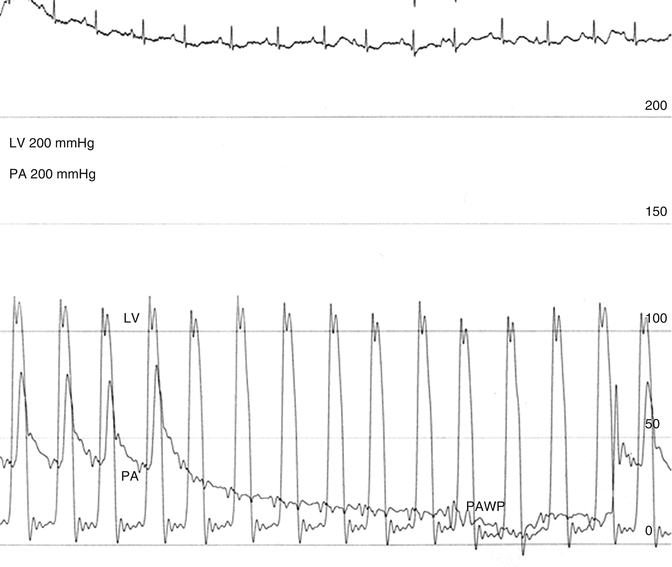

Fig. 6.8
Pulmonary artery (PA) and left ventricular (LV) pressure tracings followed by the pressure decay curve as the blood flows through the arterioles, capillaries, and venules, measured distal to the balloon occlusion catheter, until it stabilizes at the pulmonary artery wedge pressure (PAWP). The pulmonary capillary pressure (pcp) is estimated when blood is flowing, by projection of an exponential fitting curve to the beginning of the decay curve and is higher than the PAWP when there is no blood flow. In this case, the pressure decay is prolonged, and the pressure has not stabilized. This 78-year-old patient had recently diagnosed pulmonary hypertension with no evidence of chronic thromboembolic pulmonary hypertension (CTEPH). The term PAWP is equivalent to the time honored term PCWP and is used here to differentiate it from the estimated pressure at the the capillary level
The accuracy of this technique depends largely on complete occlusion of the pulmonary artery branch, as incomplete occlusion may give falsely elevated values. Complete occlusion can be verified by examining the O2 saturation of blood distal to the occlusion, after removing enough blood to reach the capillary blood (>95 % saturation), or in the cath lab by distal injection of contrast (Fig. 6.9).
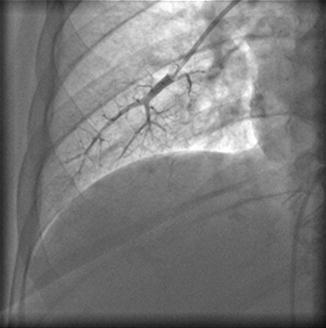

Fig. 6.9
Injection of contrast in the pulmonary artery through the Swan–Ganz catheter with the balloon inflated. The complete occlusion of the pulmonary artery and absence of flow can be verified
In case the pulmonary alveolar pressure is higher than the capillary pressure, the column of blood is interrupted, due to compression of the capillaries, and the pressure obtained is the alveolar pressure and not the left-sided venous/atrial pressure. Due to the fact that hydrostatic pressure in a supine subject is adequate to keep the capillaries open at the lower lung fields, fluoroscopy in a lateral projection can demonstrate the position of the pulmonary catheter.
The end-diastolic pressure of the ventricles is measured at the onset of ventricular systole, when the atrioventricular valves close. This point closely corresponds to the first peak or nadir of the QRS complex for the LV and the ensuing downstroke or upstroke of the QRS for the RV. The point of end diastole is well defined when a long PR interval permits the fall in LV or RV pressure during atrial relaxation. The mean PCWP or LAP may not be appreciated fully by measurement of the LVEDP, because the mean PCWP or LAP can be significantly raised by the presence of “v” waves due to increased flow and/or increased stiffness of the left atrium during ventricular systole. On the other hand, in many patients with LV noncompliance, the mean PCWP may be lower than the LVEDP due to a high “a” wave that raises the LVEDP (Fig. 6.10). Although one may assume that the pressure the lungs see is the mean LAP measured at rest, this may not be true during the activity of the subject when the diastolic period shortens. In that sense, the higher LVEDP may be more representative of the pressure the lungs see. It is obvious that the issue of defining the presence of PAH with measurements of PCWP close to the cutoff values is not resolved [30].
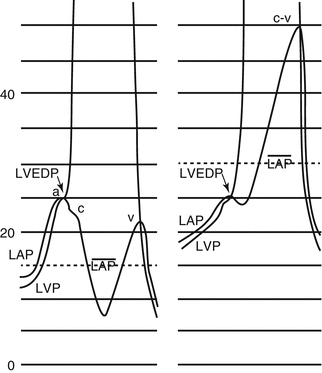

Fig. 6.10
Definition of the point of measurement of the left ventricular end-diastolic pressure (LVEDP), where the left atrial pressure (LAP) crosses the left ventricular pressure (LVP). The mean LAP is lower than the LVEDP on the left recording and higher on the right recording due to a high systolic wave
6.10 Pulmonary Artery Pressure
The pulmonary artery pressure waveform analyzed with fluid-filled catheters presents the problem of overshooting, due to whip artifacts related to excessive movement of the catheter, resulting in digitally recorded lower diastolic and higher systolic pressure (Fig. 6.4). This has a significant impact on the evaluation of PAH.
The pulmonary artery waveform hides important information on the compliance and distribution of compliance in the pulmonary tree and on wave reflections. A simple analysis of the pressure waveform can demonstrate the contribution of reflected waves and compliance by measuring the augmentation index and timing of the reflected wave and the relation of the pulse pressure to the mean pulmonary artery pressure (PAP) (Fig. 6.11). Characteristics of the compliance and resistance of the pulmonary tree can be revealed by analysis of the diastolic pressure decay of the pulmonary pressure waveform (Fig. 6.19).
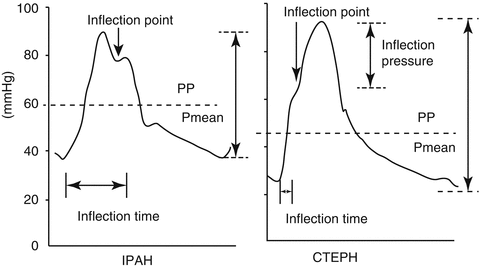

Fig. 6.11
Pulmonary artery pulse pressure (PP) is higher in chronic thromboembolic pulmonary hypertension (CTEPH) patients relative to the mean pressure (Pmean) as compared to patients with idiopathic arterial pulmonary hypertension (IAPH), probably due to increased stiffness of the proximal pulmonary vessels. The difference in waveforms is related in part to early reflection of waves, and this is revealed by the short time to first inflection and the increased augmentation index (inflection pressure/PP). A similar pattern to CTEPH can be seen in PAH related to scleroderma (Adapted from Nakayama et al. [33, 34])
6.11 Pulmonary Vascular Resistance (PVR)
The resistive properties of the vascular system of the lungs are conveniently described in the “steady-flow” hemodynamic approach, by dividing the difference of mean pulmonary blood pressure and PCWP with the mean CO. For measuring the PVR, two type of units are used: mmHg/L min (Wood units) or SI units, dynes . sec . cm−5, the latter easily obtained by multiplying the Wood units by a factor of 80. It is important to remember that for indexing to BSA, the resistance value has to be multiplied and not divided by the BSA.
The law that governs laminar flow of Newtonian fluids through nondistensible circular tubes states that the resistance to flow depends on the product of length and viscosity and the inverse of the internal radius of the tubes to the fourth power. This explains why the calculated resistance is mainly located in the smallest vessels and how seemingly insignificant changes in the radius, e.g., 2 %, may change the calculated resistance by 20 %.
The inherent assumption of the PVR calculation is that the relation is linear, but in reality, the relation of pressure to flow is concave toward the flow axis, due to vessel recruitment and vessel distensibility at higher flows. That means that with increasing flow, the calculated resistance (the tangent to this curve) may fall, and this may be misinterpreted as a direct effect on the pulmonary vasculature (Fig. 6.12).
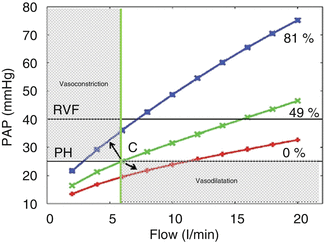

Fig. 6.12
Relationship between flow into the pulmonary circuit and resultant mean pulmonary arterial pressure (PAP) at baseline (0 % obstruction) and two levels of vascular obstruction (~49 and ~80 % vascular obstruction using emboli of size 7 mm in radius). At the standard flow used in this study (5 l/min), PAH (defined as meanPAP >25 mmHg) is not present with ~48 % of vascular bed occluded. If we assume we made a measurement at point C, any intervention or a follow-up measurement will be indicative of definitive vasoconstriction or vasodilatation when the pressure and flow change in opposite directions, confined in the grey areas, in the direction of the arrows (Adapted from Burrowes [35])
The resistive properties of the pulmonary circulation are best defined by the measurement of pulmonary vascular pressures at several levels of flow so that resistance curves are constructed (Fig. 6.12). The problem is to increase or to decrease flow with interventions that do not affect the pulmonary vascular tone. An option may be to increase flow by an infusion of low-dose dobutamine. There is experimental evidence that dobutamine has no effect on pulmonary vascular tone at doses below 10 μg/kg per min [36]. Considering these observations, the effect of vasodilators on the pulmonary vasculature may be misinterpreted, and strict criteria should apply when a change in PVR is measured. The criteria for positive vasoreactivity, in patients with idiopathic arterial hypertension, are a reduction of mean PAP >10 mmHg to reach an absolute value of mean PAP <40 mmHg with an increased or unchanged cardiac output. These criteria are based on the observation of the good long-tem prognosis on calcium channel blockers of patients with this response [37]. The PVR is not adequate by itself to describe the complete effect of vasodilators on the RV load, and more complicated measurements which include vessel compliance and wave reflections need to be implemented (vide infra).
Stay updated, free articles. Join our Telegram channel

Full access? Get Clinical Tree


