Chapter 3 Rhythms and Management
Upon completion of this chapter, you will be able to:
Section 1 Anatomy Review and Basic Electrophysiology
Coronary Arteries
The right coronary artery (RCA) originates from the right side of the aorta. It travels along the groove between the right atrium and right ventricle (Figure 3-1). Blockage of the RCA can result in inferior wall myocardial infarction (MI), disturbances in atrioventricular (AV) nodal conduction, or both.
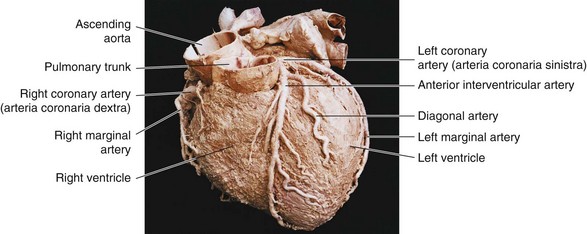
Figure 3-1 Anterior view of the heart with the right and left coronary arteries and some of their branches.
The Cx coronary artery circles around the left side of the heart. Blockage of the Cx artery can result in a lateral wall MI. In some patients, the Cx artery may also supply the inferior portion of the left ventricle. A posterior wall MI may occur because of blockage of the right coronary artery or the Cx. A summary of the coronary arteries is shown in Table 3-1.
| Coronary Artery and Its Branches | Portion of Myocardium Supplied | Portion of Conduction System Supplied |
|---|---|---|
AV, Atrioventricular; SA, sinoatrial.
Basic Electrophysiology
Cardiac Action Potential
Polarization
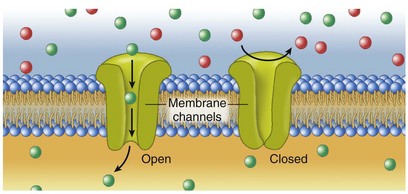
Cell membranes contain pores or channels through which specific electrolytes and other small, water-soluble molecules can cross the cell membrane from the outside to the inside (Figure 3-2). When a cell is at rest, K+ leaks out of it. Large molecules such as proteins and phosphates remain inside the cell because they are too big to pass easily through the cell membrane. These large molecules carry a negative charge. This results in more negatively charged ions on the inside of the cell.
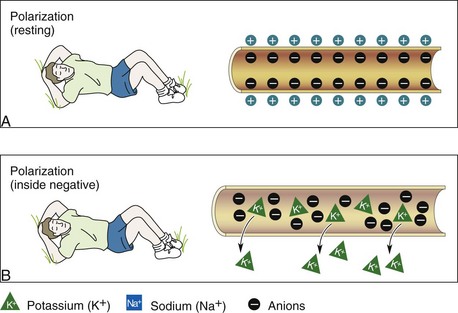
When the inside of a cell is more negative than the outside, it is said to be in a polarized state (Figure 3-3). The voltage (difference in electrical charges) across the cell membrane is the membrane potential. Electrolytes are quickly moved from one side of the cell membrane to the other by means of pumps. These pumps require energy in the form of adenosine triphosphate (ATP) when movement occurs against a concentration gradient. The energy expended by the cells to move electrolytes across the cell membrane creates a flow of current. This flow of current is expressed in volts. Voltage appears on an ECG as spikes or waveforms. Thus an ECG is actually a sophisticated voltmeter.
Depolarization
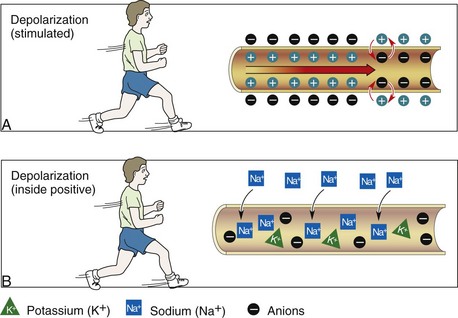
When opposite charges come together, energy is released. When the movement of electrolytes changes the electrical charge of the inside of the cell from negative to positive, an impulse is generated. The impulse causes channels to open in the next cell membrane and then the next. The movement of charged particles across a cell membrane causing the inside of the cell to become positive is called depolarization (Figure 3-4). Depolarization must take place before the heart can mechanically contract and pump blood. Depolarization occurs because of the movement of Na+ into the cell. Depolarization proceeds from the innermost layer of the heart (endocardium) to the outermost layer (epicardium).
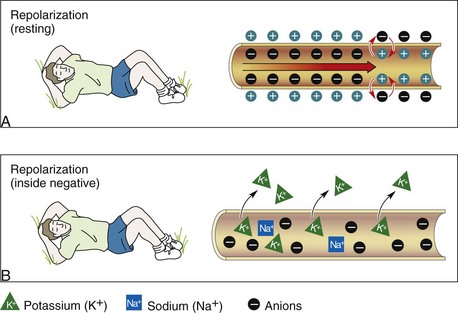
Repolarization
After the cell depolarizes, it quickly begins to recover and restore its electrical charges to normal. The movement of charged particles across a cell membrane in which the inside of the cell is restored to its negative charge is called repolarization. The cell membrane stops the flow of Na+ into the cell and allows K+ to leave it. Negatively charged particles are left inside the cell. Thus the cell is returned to its resting state (Figure 3-5). This causes contractile proteins in the working myocardial cells to separate (relax). The cell can be stimulated again if another electrical impulse arrives at the cell membrane. Repolarization proceeds from the epicardium to the endocardium. On the ECG, the ST segment and T wave represent ventricular repolarization.
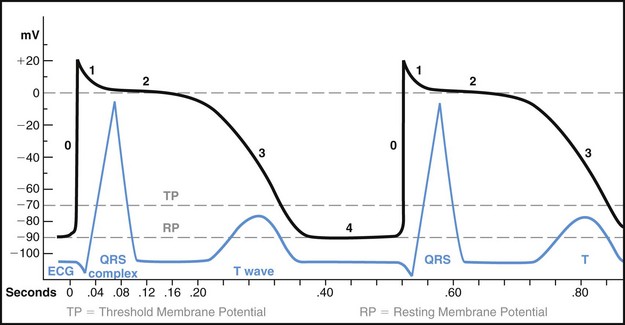
The action potential of a ventricular myocardial cell consists of five phases labeled 0 to 4. These phases reflect the rapid sequence of voltage changes that occur across the cell membrane during the electrical cardiac cycle. Phases 1, 2, and 3 have been referred to as electrical systole. Phase 4 has been referred to as electrical diastole. Figure 3-6 shows the action potential of a normal ventricular muscle cell.
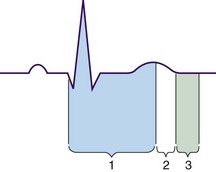
Refractory Periods
During the relative refractory period, which is also known as the vulnerable period, some cardiac cells have repolarized to their threshold potential and thus can be stimulated to respond (i.e., depolarize) to a stronge-than-normal stimulus (Figure 3-7). This period corresponds with the downslope of the T wave on the ECG.
Conduction System
Sinoatrial Node
The normal heartbeat is the result of an electrical impulse that begins in the SA node. The heart’s pacemaker cells have a built-in (intrinsic) rate that becomes slower and slower from the SA node down to the end of the His-Purkinje system. The intrinsic rate of the SA node is 60 to 100 beats/min. The SA node is normally the primary pacemaker because it depolarizes more quickly than other pacemaker sites in the heart (Figure 3-8). Other areas of the heart can assume pacemaker responsibility if:
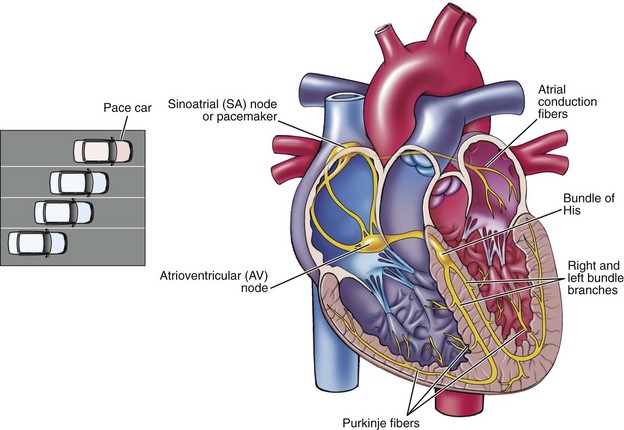
Atrioventricular Junction
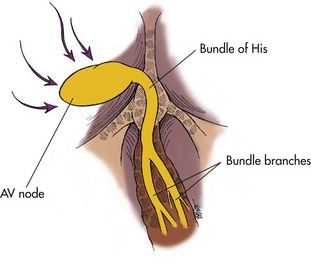
The internodal pathways merge gradually with the cells of the AV node. Depolarization and repolarization are slow in the AV node, making this area vulnerable to blocks in conduction (AV blocks). The AV junction is made up of the AV node and the nonbranching portion of the bundle of His (Figure 3-9). This area consists of specialized conduction tissue that provides the electrical links between the atria and the ventricles. When the AV junction is bypassed by an abnormal pathway, the abnormal route is called an accessory pathway. An accessory pathway is an extra bundle of working myocardial tissue that forms a connection between the atria and the ventricles outside of the normal conduction system.
Purkinje Fibers
The right and left bundle branches divide into smaller and smaller branches and then into a special network of fibers called the Purkinje fibers. These fibers spread from the interventricular septum into the papillary muscles. They continue downward to the apex of the heart, making up an elaborate web that penetrates about one third of the way into the ventricular muscle mass. The fibers then become continuous with the muscle cells of the right and left ventricles. The Purkinje fibers have pacemaker cells that have an intrinsic rate of 20 to 40 beats/min (Table 3-2). The electrical impulse spreads rapidly through the right and left bundle branches and the Purkinje fibers to reach the ventricular muscle. The electrical impulse spreads from the endocardium to the myocardium, finally reaching the epicardial surface. The ventricular walls are stimulated to contract in a twisting motion that wrings blood out of the ventricular chambers and forces it into arteries.
TABLE 3-2 Normal Pacemaker Sites
| Pacemaker | Beats/Minute |
|---|---|
| Sinoatrial (SA) node (primary pacemaker) | 60 to 100 |
| Atrioventricular (AV) junction | 40 to 60 |
| Purkinje fibers | 20 to 40 |
The Electrocardiogram
ECG monitoring may be used for the following purposes:
Electrodes
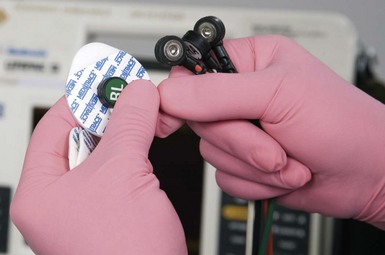
An electrode is an adhesive pad containing a conductive substance in the center and that is applied to the patient’s skin. Electrodes are applied at specific locations on the patient’s chest wall and extremities to view the heart’s electrical activity from different angles and planes. The conductive media of the electrode conducts skin surface voltage changes through wires to a cardiac monitor. One end of a monitoring cable, which is also called a lead wire, is attached to the electrode and the other end to an ECG machine (Figure 3-10).
Leads
Frontal Plane Leads
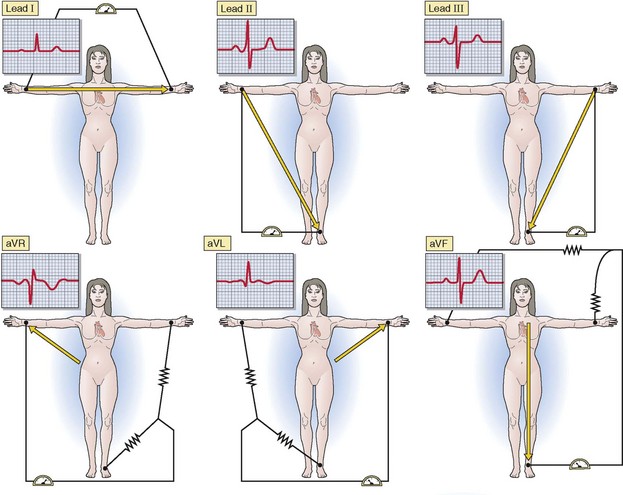
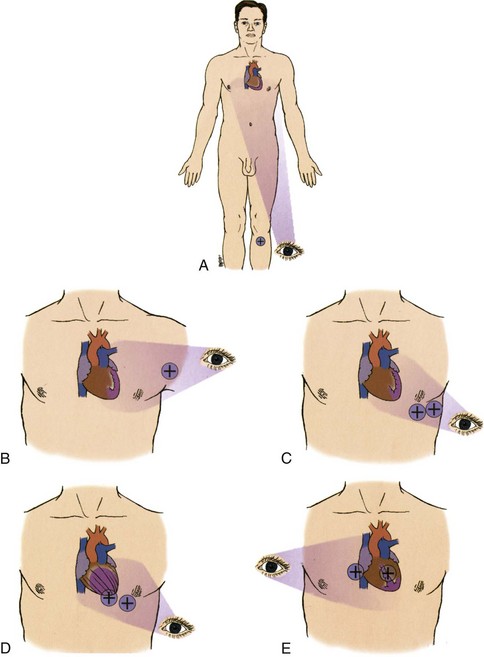
Frontal plane leads view the heart from the front of the body as if it were flat. Directions in the frontal plane are superior, inferior, right, and left (Figure 3-11). Six leads view the heart in the frontal plane. Leads I, II, and III are called standard limb leads. Leads aVR, aVL, and aVF are called augmented limb leads.
Standard Limb Leads
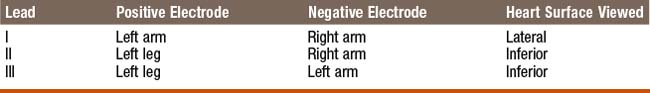
Lead I records the difference in electrical potential between the left arm (+) and right arm (−) electrodes. The positive electrode is placed on the left arm and the negative electrode is placed on the right arm. The third electrode is a ground that minimizes electrical activity from other sources (Figure 3-12A). Lead I views the lateral surface of the left ventricle.
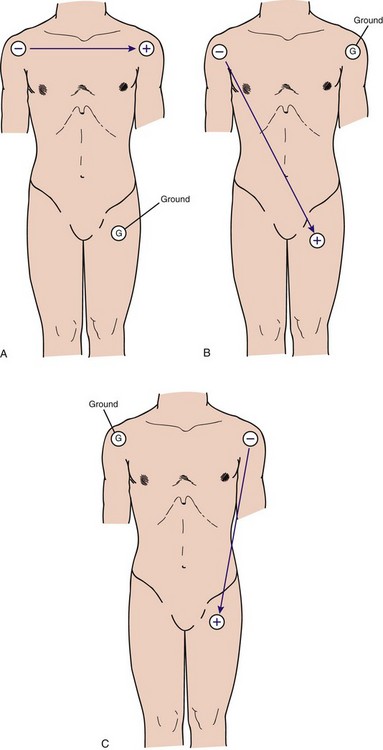
Figure 3-12 Electrode placement on the patient’s limbs for (A) lead I, (B) lead II, and (C) lead III.
Lead II records the difference in electrical potential between the left leg (+) and right arm (−) electrodes. The positive electrode is placed on the left leg and the negative electrode is placed on the right arm (Figure 3-12B). Lead II views the inferior surface of the left ventricle. This lead is commonly used for cardiac monitoring because positioning of the positive and negative electrodes in this lead most closely resembles the normal pathway of current flow in the heart.
Lead III records the difference in electrical potential between the left leg (+) and left arm (−) electrodes. In lead III the positive electrode is placed on the left leg and the negative electrode is placed on the left arm (Figure 3-12C). Lead III views the inferior surface of the left ventricle. A summary of the standard limb leads can be found in Table 3-3.
Augmented Limb Leads
Leads aVR, aVL, and aVF are augmented limb leads that record measurements at a specific electrode with respect to a reference electrode. The electrical potential produced by the augmented leads is normally relatively small. The ECG machine augments (i.e., magnifies) the amplitude of the electrical potentials detected at each extremity by about 50% over those recorded at the standard limb leads. The “a” in aVR, aVL, and aVF refers to augmented. The “V” refers to voltage and the last letter refers to the position of the positive electrode. The “R” refers to the right arm, the “L” to left arm, and the “F” to left foot (leg). Therefore, the positive electrode in aVR is located on the right arm, aVL has a positive electrode at the left arm, and aVF has a positive electrode positioned on the left leg (Figure 3-13).
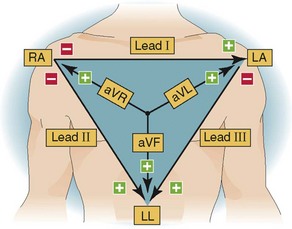
Lead aVR views the heart from the right shoulder (the positive electrode) and views the base of the heart (primarily the atria and the great vessels). This lead does not view any wall of the heart. Lead aVL combines views from the right arm and left leg, with the view being from the left arm and oriented to the lateral wall of the left ventricle. Lead aVF combines views from the right arm and the left arm toward the left leg; it views the inferior surface of the left ventricle from the left leg. A summary of augmented leads can be found in Table 3-4.
TABLE 3-4 Augmented Limb Leads
| Lead | Positive Electrode | Heart Surface Viewed |
|---|---|---|
| aVR | Right arm | None |
| aVL | Left arm | Lateral |
| aVF | Left leg | Inferior |
Horizontal Plane Leads
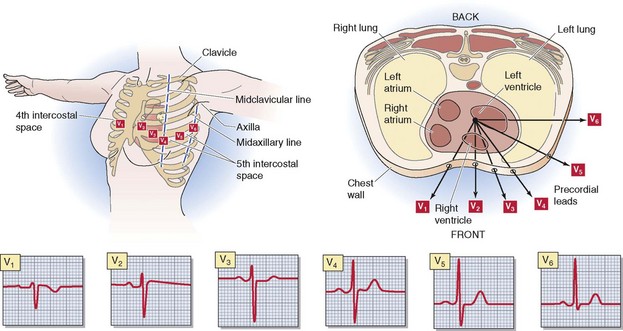
Horizontal plane leads view the heart as if the body were sliced in half horizontally. Directions in the horizontal plane are anterior, posterior, right, and left. Six chest (precordial or “V”) leads view the heart in the horizontal plane (Figure 3-14). This allows a view of the front and left side of the heart.
Chest Leads
The chest leads are identified as V1, V2, V3, V4, V5, and V6. Each electrode placed in a “V” position is a positive electrode. Lead V1 is recorded with the positive electrode in the fourth intercostal space, just to the right of the sternum. Lead V2 is recorded with the positive electrode in the fourth intercostal space, just to the left of the sternum. Lead V3 is recorded with the positive electrode on a line midway between V2 and V4. Lead V4 is recorded with the positive electrode in the left midclavicular line in the fifth intercostal space. To evaluate the right ventricle, lead V4 may be moved to the same anatomic location but on the right side of the chest. The lead is then called V4R and it is viewed for ECG changes consistent with acute MI. Lead V5 is recorded with the positive electrode in the left anterior axillary line at the same level as V4. Lead V6 is recorded with the positive electrode in the left midaxillary line at the same level as V4. A summary of the chest leads can be found in Table 3-5.
| Lead | Positive Electrode Position | Heart Surface Viewed |
|---|---|---|
| V1 | Right side of sternum, fourth intercostal space | Septum |
| V2 | Left side of sternum, fourth intercostal space | Septum |
| V3 | Midway between V2 and V4 | Anterior |
| V4 | Left midclavicular line, fifth intercostal space | Anterior |
| V5 | Left anterior axillary line; same level as V4 | Lateral |
| V6 | Left midaxillary line; same level as V4 | Lateral |
Right Chest Leads
Other chest leads that are not part of a standard 12-lead ECG may be used to view specific surfaces of the heart. Right chest leads are used to evaluate the right ventricle (Figure 3-15). The placement of right chest leads is identical to the placement of the standard chest leads except that it is done on the right side of the chest. If time does not permit obtaining all of the right chest leads, the lead of choice is V4R. A summary of the right chest leads can be found in Table 3-6.
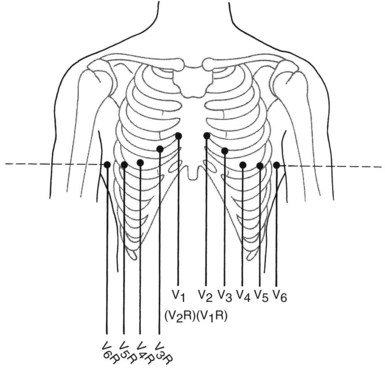
TABLE 3-6 Right Chest Leads and Their Placement
| Lead | Placement |
|---|---|
| V1R | Lead V2 |
| V2R | Lead V1 |
| V3R | Midway between V2R and V4R |
| V4R | Right midclavicular line, fifth intercostal space |
| V5R | Right anterior axillary line; same level as V4R |
| V6R | Right midaxillary line; same level as V4R |
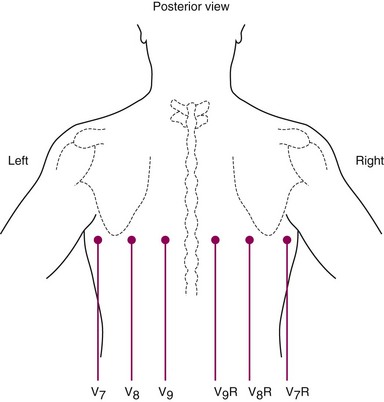
Posterior Chest Leads
On a standard 12-lead ECG, no leads look directly at the posterior surface of the heart. Additional chest leads may be used for this purpose. These leads are placed farther left and toward the back (Figure 3-16). All of the leads are placed on the same horizontal line as V4 to V6. Lead V7 is placed at the posterior axillary line. Lead V8 is placed at the angle of the scapula (i.e., the posterior scapular line) and lead V9 is placed over the left border of the spine.
What Each Lead “Sees”1
The second factor, position of the positive electrode on the body, determines which portion of the left ventricle is seen by each lead. You can commit the view of each lead to memory, or you can easily reason it by remembering where the positive electrode is located. The view of each lead is listed in Table 3-7, while Figure 3-17 demonstrates the portion of the left ventricle that each lead views. Please note that aVR is not included in Table 3-7 or Figure 3-17.
TABLE 3-7 What Each Lead “Sees”
| Leads | Heart Surface Viewed |
|---|---|
| II, III, aVF | Inferior |
| V1, V2 | Septal |
| V3, V4 | Anterior |
| I, aVL, V5, V6 | Lateral |
Electrocardiogram Paper
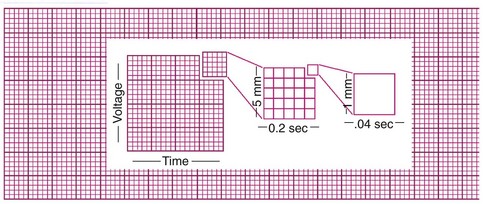
ECG paper is graph paper made up of small and large boxes measured in millimeters. The smallest boxes are 1 mm wide and 1 mm high (Figure 3-18). The horizontal axis of the paper corresponds with time. Time is used to measure the interval between or duration of specific cardiac events, which is stated in seconds. ECG paper normally records at a constant speed of 25 mm/second. Thus, each horizontal unit (i.e., each 1-mm box) represents 0.04 second (25 mm/sec × 0.04 second = 1 mm). The lines after every five small boxes on the paper are heavier. The heavier lines indicate one large box. Because each large box is the width of five small boxes, a large box represents 0.20 second.
< div class='tao-gold-member'>
Stay updated, free articles. Join our Telegram channel

Full access? Get Clinical Tree


