Several studies have investigated the frequency of familial dilated cardiomyopathy (FDC). However, no systematic review and meta-analysis on this topic are available. Therefore, using the PubMed, MEDLINE, Cochrane, and the ISI Web of Science databases, relevant reports published through December 2010 were identified. For the summation of prevalence findings, prevalence point estimates and 95% confidence intervals were computed using the logit transformation formula. An aggregate estimate of clinically confirmed FDC of 23% (95% confidence interval 0.17 to 0.31) was found. However, the prevalence rates reported across these studies varied widely, ranging from 2% to 65%, and the analysis showed very high heterogeneity (Q = 295, p <0.001, I 2 = 93%). Meta–regression analysis between logit event rate and year of publication explained 23% of between-study variance (p <0.05). Cumulative meta-analysis confirmed the influence of year of publication on the reported prevalence of FDC among the different studies. However, most of the observed heterogeneity may be explained by the fact that the various studies used different preselected criteria for the diagnosis of FDC. In conclusion, data obtained from trials performed using standardized criteria are needed to better define the true prevalence of FDC.
Idiopathic dilated cardiomyopathy (IDC) is a syndrome characterized by cardiac enlargement and impaired systolic function of 1 or both ventricles, in the absence of abnormal load conditions (such as hypertension, valve disease, or congenital heart disease) or coronary artery disease of sufficient severity to cause global impairment of ventricular function. The importance of genetic factors in IDC has often been underestimated. Studies carried out from 1981 to 1985 showed a very low frequency (2%) of familial dilated cardiomyopathy (FDC). Subsequent prospective studies clearly showed familial clustering in more patients. However, the results of these latter studies were different on account of the populations enrolled and the study methods used. To our knowledge, no systematic review and meta-analysis of the frequency of FDC are actually available. In this study, our aim was to estimate the prevalence of FDC and to assess the extent of the heterogeneity in reported prevalence estimates.
Methods
This study was designed according to the Quality of Reporting of Meta-Analyses statement. We performed a search of the published research in the PubMed, MEDLINE, Cochrane, and ISI Web of Science databases. Two of the investigators (F.P. and L.S.) independently identified relevant reports published from January 1980 through December 2010. Primary key words included “FDC,” “IDC,” and “inherited dilated cardiomyopathy.” To be included, studies were required to have used samples composed exclusively of patients diagnosed with IDC or to have reported data for subgroups of patients with IDC. Criteria for selection were reporting (1) the number of patients with IDC and (2) the proportion of these patients in whom FDC was diagnosed according to the predefined criteria.
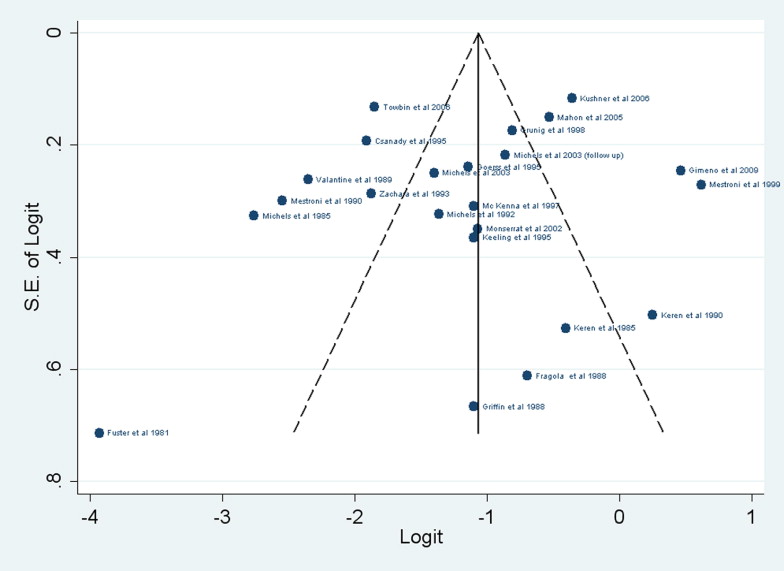
R version 2.12.0 (R Foundation for Statistical Computing, Vienna, Austria) and Stata version 11.1 (StataCorp LP, College Station, Texas) served as the statistical platforms for completing all statistical tests and associated graphic results. For the summation of prevalence findings, we computed prevalence point estimates and 95% confidence intervals using the logit transformation formula: logit event rate = ln[event rate/(1 − event rate)]; the SE of logit event rate is calculated as √1/(event rate × num tot) + 1/(1 − event rate) × num tot], and 95% confidence interval as lower limit = [logit event rate − (1.96 × logit event rate SE)] and upper limit = [logit event rate + (1.96 × logit event rate SE)]. Inverse variance weighting was used to calculate pooled estimates. To report results in untransformed units, back-transformation of the estimated average and of the lower and upper confidence limits was performed, computing event rate = 1/[1 + exp(−logit event rate)]. The assumption of homogeneity of prevalence among the different trials was preliminarily tested with the Q and I 2 statistics. Because the assumption of homogeneity was rejected (p <0.05), a random-effects model was chosen to calculate prevalence rate and the corresponding p values, and τ 2 and I 2 values are reported. In addition to the overall random-effects model, meta–regression analysis was performed to assess the evidence of prevalence modifiers. Cumulative meta-analysis, in which the cumulative evidence at the time each study was published is calculated, was also performed. The presence of publication bias was graphically assessed using a funnel plot, a simple graphical display of a measure of study size against logit event rate. the interpretation of funnel plots is facilitated by the inclusion of diagonal lines representing the 95% confidence limits around the summary treatment effect. These show the expected distribution of studies in the absence of heterogeneity or of selection biases. Because these diagonal lines are not strict 95% limits but rather a region in which 95% of the observed effects are expected to fall if the true effects are homogenous, they are referred to as “pseudo 95% confidence limits.” To evaluate potential publication bias, we also performed a test proposed by Egger et al on the basis of a linear regression approach and a test proposed by Begg and Mazumdar on the basis of a rank correlation method.
Results
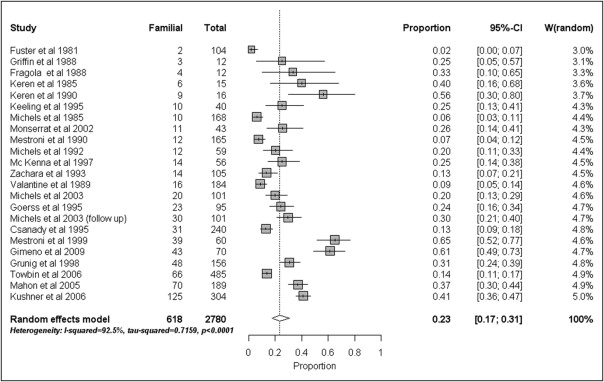
Of the initial 2,320 studies identified, 1,750 were excluded on the basis of title, 502 on the basis of abstract, and 45 on the basis of text. These latter studies were excluded because of a lack of data on the percentages of patients with FDC in the populations examined. Thus, a total of 23 studies evaluating the prevalence of FDC were selected according to the aforementioned criteria. For each study, demographic characteristics and the echocardiographic criteria used to define the presence of FDC are listed in Table 1 . These data were not available in all studies; in particular, age and gender in some studies were reported for the probands and in some studies for the entire study population. The criteria used to define the presence of FDC are listed in Table 2 . The prevalence rates of clinically confirmed FDC patients for each of the 23 studies are reported in Figure 1 . As shown, we found an aggregated estimate of 23% (95% confidence interval 0.17 to 0.31). The prevalence rates reported across these studies varied widely, ranging from 2% to 65%. Moreover, the analysis showed very high heterogeneity (Q = 295, p <0.0001, I 2 = 93%).
| Study | Male/Female | Mean Age (Years) | LVEDD | LVEF | FS | LV Hypokinesia |
|---|---|---|---|---|---|---|
| Fuster et al (1981) | 64/40 | 49 | >55 mm | + | ||
| Keren et al (1985) | NA | 30 | >10%–15% above normal corrected range | |||
| Michels et al (1985) | 119/49 | NA | + | |||
| Fragola et al (1988) | 11/1 | 50 | >57 mm or >95th percentile | + | ||
| Griffin et al (1988) | 6/6 | 10 | >55 mm | + | ||
| Valantine et al (1989) ⁎ | 9/7 | NA | >55 mm | + | ||
| Keren et al (1990) | 5/11 | 37 | >10%–15% above normal corrected range | <30% | ||
| Mestroni et al (1990) ⁎ | 8/4 | 36 | <50% | |||
| Michels et al (1992) | 28/31 | 53 | >95th percentile | <50% | ||
| Zachara et al (1993) ⁎ | 12/2 | 42 | >2 SDs above the mean | <26% | ||
| Csanàdy et al (1995) | NA | 36 | >55 mm | <52% | ||
| Goerss et al (1995) | 47/48 | 55 | ≥95th percentile | <50% | ||
| Keeling et al (1995) | 28/12 | 40 | ≥112% | ≤25% | ||
| McKenna et al (1997) | NA | NA | >2 SDs above the mean | <50% | ||
| Grunig et al (1998) | NA | 52 | >2.7 cm/m 2 | <40% | <25% | |
| Mestroni et al (1999) | NA | 45 | >117% of predicted value | <45% | <25% | |
| Monserrat et al (2002) | NA | NA | >55 mm | + | ||
| Michels et al (2003) | 51/50 | 52 | >95th percentile | <50% | ||
| Michels et al (2003) | 51/50 | 52 | >95th percentile | <50% | ||
| Mahon et al (2005) | 132/57 | 39 | ≥112% of predicted value | <25% | ||
| Kushner et al (2006) | 173/131 | 47 | ≥97.5th percentile | ≤50% | ≤25% | |
| Towbin et al (2006) ⁎ | 36/30 | 4 | >55 mm | + | ||
| Gimeno et al (2009) | NA | 40 | ≥112% of predicted value | ≤25% |
| Study | Criteria |
|---|---|
| Fuster et al (1981) | DC in ≥1 first-degree relative |
| Keren et al (1985) | Family history of congestive heart failure |
| Michels et al (1985) | DC in ≥1 relative at physicians statement or medical records |
| Fragola et al (1988) | DC in ≥1 relative according to echocardiographic criteria |
| Griffin et al (1988) | Family history |
| Valantine et al (1989) | Family history |
| Keren et al (1990) | Family history of congestive heart failure |
| Mestroni et al (1990) | DC in ≥1 relative |
| Michels et al (1992) | DC in ≥1 relative |
| Zachara et al (1993) | DC in ≥1 relative and confirmed at biopsy |
| Csanàdy et al (1995) | DC in ≥2 relatives with frankly abnormal left ventricular function |
| Goerss et al (1995) | DC symptomatic or asymptomatic in ≥1 relative |
| Keeling et al (1995) | DC in ≥1 relative |
| McKenna et al (1997) | DC in ≥1 first-degree relative |
| Grunig et al (1998) | DC in ≥1 first- or second-degree relative confirmed at biopsy or catheterization |
| Mestroni et al (1999) | DC in ≥2 relatives |
| Monserrat et al (2002) | DC in ≥1 relative |
| Michels et al (2003) | DC in ≥1 relative |
| Michels et al (2003) | DC in ≥1 relative |
| Mahon et al (2005) | DC in ≥1 relative or sudden death <30 years |
| Kushner et al (2006) | Medical records in ≥2 relatives |
| Towbin et al (2006) | NA |
| Gimeno et al (2009) | DC in ≥2 relatives or in 1 relative with sudden death |
The funnel plot appears symmetrical ( Figure 2 ) , without evidence of bias using the Egger (weighted regression) as well as the Begg (rank correlation) methods for small-study effects (p = 0.42 and p = 0.67, respectively). Meta-regression analysis between logit event rate and year of publication explained 23% of between-study variance (p <0.05), with a logit event rate increase of 0.06 for each year ( Figure 3 ) . The Q test for moderator was 6.15 (p <0.05), and the estimate of the residual amount of heterogeneity (τ 2 ) was 0.69 ± 0.25 (Q test for residual heterogeneity 222, p <0.001). Cumulative meta-analysis confirmed the influence of year of publication on the reported prevalence of FDC among the different studies ( Figure 4 ) .