-axis were initiated in a two-dimensional medium of  size, using the smooth Fenton-Karma model with parameter set FK2 (see Table A.2, p. 184), isotropic diffusion of
  and periodic boundary conditions. Due to the periodic boundary conditions, the plane wave does not die out at the medium boundary but continuously reenters the domain from the opposite side. For the parameters used here, a stable periodic activation pattern develops, such that
  is expected for all
  , meaning that no perturbation should grow with time. In Fig. 3.1, a snapshot of the system is plotted along with the perturbations belonging to the leading Lyapunov exponents. As indicated in the figure, there is one neutrally stable direction with
  and all other
  ,
,  . This is entirely consistent with the Lyapunov spectrum of a periodic orbit in an autonomous low-dimensional system, where the neutrally stable direction corresponds to a shift along the trajectory, indicating time invariance of the dynamical system. However, in this case, the Lyapunov vectors have a spatial structure: They are concentrated at the wave front and back and show a characteristic vertical oscillation in space. The first vector (second column) indeed corresponds to a shift along the trajectory, accelerating the plane wave towards a future state. A cut along the
  -axis of the first 15 Lyapunov vectors, shown in Fig. 3.2, indicates that the decay rate (cf. figure legend) of the perturbations increases with the spatial frequency. The harmonic spatial shape of the perturbations suggests to attribute their existence to the diffusive spatial coupling of the excitable medium. The emergence of the observed spectrum will be explained in the following.
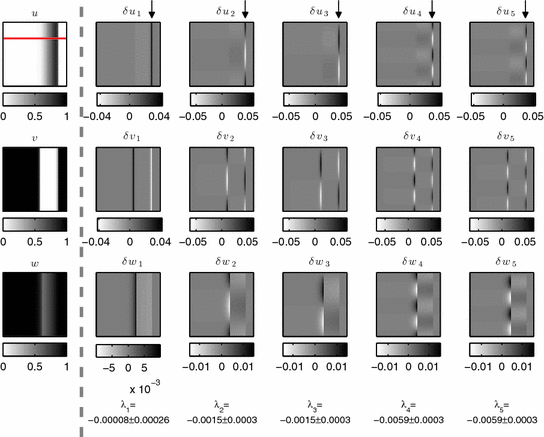
 , since the plane wave is a periodic orbit in an autonomous system. The higher-index perturbations have negative growth rates, indicated below each column (see Fig. 3.2 for details). The red line in the upper left plot indicates the domain of a one-dimensional cable which, if considered separately, would exhibit identical dynamics. Simulations done in a
  domain with the smooth Fenton-Karma model using parameter set FK2 (see Table A.2, p. 184), isotropic diffusion of
  and periodic boundary conditions. The space step is
  , the time step
  . Lyapunov vectors were allowed to align for
  before calculating the spectrum according to Sect. 2.2.6 for another
  (roughly 13 periods)
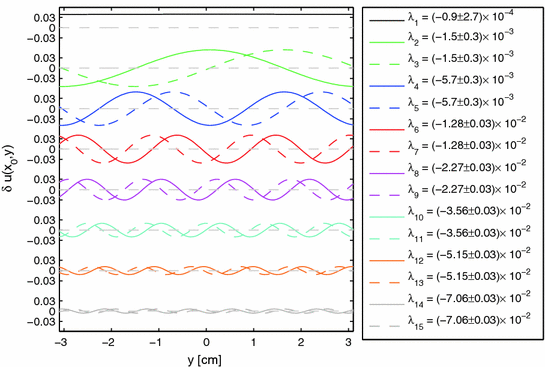
 -direction, the two-dimensional version of Eq. (2.72), which describes the actual dynamics, reduces to a one-dimensional problem:
 uncoupled copies of such a cable would consist of
  copies of the spectrum of a single cable. However, the diffusion operator
  which couples the cables in
  -direction stabilizes the trajectory where
  is identical for all
  and thus shifts some Lyapunov exponents in the negative direction.
 degrees of freedom are the values of the three dynamic variables in every of the
  computational points.
  of these oscillators (where
  is the number of computational points in
  -direction in the two-dimensional simulation) exhibiting the periodic dynamics of a traveling wave are diffusively coupled in
  -direction. Assume for a moment that all degrees of freedom of neighboring oscillators are coupled in the same way via diffusion, corresponding to the following system of equations for the Fenton-Karma model [(replacing Eq. (2.40)]:


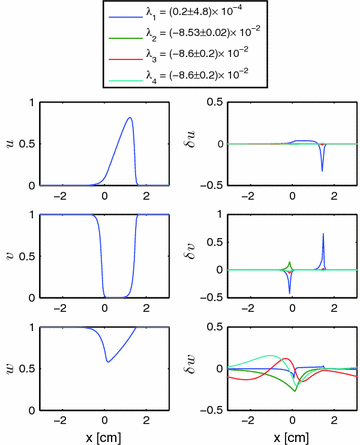
 ,
,  and
and  . In the second column, the first four Lyapunov vectors are plotted. Corresponding Lyapunov exponents are indicated in the legend. Numerical parameters are identical to Fig. 3.1 except for a vanishing spatial extent of the domain in
  -direction
 and
and  denote the original right hand side for
  and
and  of Eq. (2.40). A snapshot of the dynamics in one cable together with the leading Lyapunov spectrum is shown in Fig. 3.3. With this modified system of equations, the transverse Lyapunov exponents of the numerically discretized system viewed as a collection of coupled cables can be calculated analytically, following Heagy et al. [6]: They derived an expression for a system of coupled oscillators with an additive coupling term for the
  th oscillator of the form
 ![$$c[\mathbf {z}_{j-1}-2\mathbf {z}_j+\mathbf {z}_{j+1}]$$](/wp-content/uploads/2016/11/A328193_1_En_3_Chapter_IEq42.gif) , where
, where  is the state vector of the
  th oscillator with its
  degrees of freedom. This corresponds exactly to one possible discretization of a second derivative such as the
  -component of the Laplacian. Equations (2.86) and (2.87) state that the coupling strength in this context is
  . The result of Heagy et al. now is that the transverse Lyapunov exponents can be calculated as follows:
 is the index denoting the spatial mode, and
  with
with  are the Lyapunov exponents for a single cable without coupling, which were illustrated in Fig. 3.3, such that
  . In the continuum limit
  , the origin of this shift becomes immediately clear, because for


 . The fact that the shift of the transverse Lyapunov exponents is given by the eigenvalues of the
  -component of the Laplace operator is, of course, not a coincidence: Let
 ![$$\delta \mathbf {U}^\text {1d}(x)=[\delta u^\text {1d}(x), \delta v^\text {1d}(x), \delta w^\text {1d}(x)]$$](/wp-content/uploads/2016/11/A328193_1_En_3_Chapter_IEq56.gif) be a Lyapunov vector of the one-dimensional cable associated with a Lyapunov exponent of
be a Lyapunov vector of the one-dimensional cable associated with a Lyapunov exponent of  in the co-moving frame of reference (hence the time independence). Let
  denote the linearized dynamics of the cable in the co-moving frame (i.e. the linearization around the fixed point) and
  that of the two-dimensional system with complete coupling as in Eq. (3.2a).1 Then, it is known that
  is an eigenvector of
  with eigenvalue
  . It is seen immediately that with an eigenfunction
  of the Laplace operator with eigenvalue
  , the definition
 of
of  with eigenvalue
  . Thus, each choice of
  yields a different copy of the spectrum of the one dimensional system in the two-dimensional medium, shifted by
  , which is exactly the result of Eq. (3.4).
 for a single cable, a number of Lyapunov exponents equal to the second term of Eq. (3.3) are expected to appear in between
  and
and  (if there is a large enough gap between them). To verify this conjecture, simulations of the full two-dimensional system with the modified Eq. (3.2a) were carried out. As shown in Table 3.1, the Lyapunov spectrum of the two-dimensional system corresponds exactly (within numerical errors) to that expected from Eq. (3.3) for a system of coupled one-dimensional cables: “Copies” of both
  and
and  can be found in the spectrum with their values shifted by the second term of Eq. (3.3).
 |  |  | i | k |
|---|---|---|---|---|
 |  | 1 | 0 | |
 |  | 1 | 1 | |
 |  | 1 | 1 | |
 |  | 1 | 2 | |
 |  | 1 | 2 | |
 |  | 1 | 3 | |
 |  | 1 | 3 | |
 |  | 1 | 4 | |
 |  | 1 | 4 | |
 |  | 1 | 5 | |
 |  | 1 | 5 | |
 |  | 1 | 6 | |
 |  | 1 | 6 | |
 |  | 1 | 7 | |
 |  | 1 | 7 | |
 |  | 1 | 8 | |
 |  | 1 | 8 | |
 |  | 1 | 9 | |
 |  | 1 | 9 | |
 |  | 2 | 0 | |
 |  | 2 | 1 | |
 |  | 2 | 1 | |
 |  | 3 | 0 | |
 |  | 4 | 0 |
 variables of neighboring cables are coupled. However, even in this situation, the Lyapunov spectra of the plane wave and of the traveling wave in a cable are still closely connected by the spectrum of the Laplace operator: The third column in Table 3.2 indicates that all additional Lyapunov exponents between
  and
and  differ from those expected from Eq. (3.3) only by an approximately constant factor. Also, the two-fold degeneracy of the Lyapunov exponents is preserved. Indeed, even the spatial structure of Lyapunov vectors depicted in Figs. 3.1 and 3.2 resembles that expected from Eq. (3.6), namely different oscillatory modulations of the first Lyapunov vector. The similarity of the two scenarios (complete coupling and
  -coupling) indicates the dominant role of the activation variable
  for the formation of wave patterns in excitable media. After all, activation (or, in the Fenton-Karma model: action potentials) can only be initiated from the resting state by a perturbation to
  , but not via any other variable.
 |  |  | i | k |
|---|---|---|---|---|
 |  | 1 | 0 | |
 |  | 1 | 1 | |
 |  | 1 | 1 | |
 |  | 1 | 2 | |
 |  | 1 | 2 | |
 |  | 1 | 3 | |
 |  | 1 | 3 | |
 |  | 1 | 4 | |
 |  | 1 | 4 | |
 |  | 1 | 5 | |
 |  | 1 | 5 | |
 |  | 1 | 6 | |
 |  | 1 | 6 | |
 |  | 1 | 7 | |
 |  | 1 | 7 | |
 |  | 2 | 0 | |
 |  | 3 | 0 | |
 |  | 4 | 0 | |
 |  | 5 | 0 | |
 |  | 6 | 0 | |
 |  | 7 | 0 | |
 |  | 8 | 0 | |
 |  | 9 | 0 | |
 |  | 10 | 0 |
3.1.2 Rigidly Rotating Spiral Waves
 for a spiral wave in the Barkley model is illustrated with three meaningful directions in tangent space. Due to the degeneracy, Lyapunov stability analysis yields three arbitrary Lyapunov vectors in this subspace. In Fig. 3.4, three orthonormalized linear combinations of these arbitrary Lyapunov vectors are depicted, indicating that the two additional zero exponents are a result of the translational symmetry in the system: If the boundary is far away from the rotational center of the spiral—i.e. the two are electrotonically decoupled—a shift of the wave in either of the two available directions will not decay but represents a neutrally stable perturbation that is picked up by the linear stability analysis. The first Lyapunov vector plotted in Fig. 3.4 (second column) corresponds to a perturbation along the trajectory of the system, i.e. parallel to
  . This is the neutrally stable direction in tangent space expected for a periodic orbit in every autonomous dynamical system, in this case accelerating the dynamics towards a future state. Consequently, the other two linearly-independent directions indeed correspond to a shift of the spiral wave in two different directions. For example, the perturbation in the third column of Fig. 3.4 accelerates wave parts moving (roughly) to upper left of the medium and decelerates those parts moving to the lower right, effectively shifting the whole spiral towards the upper left.
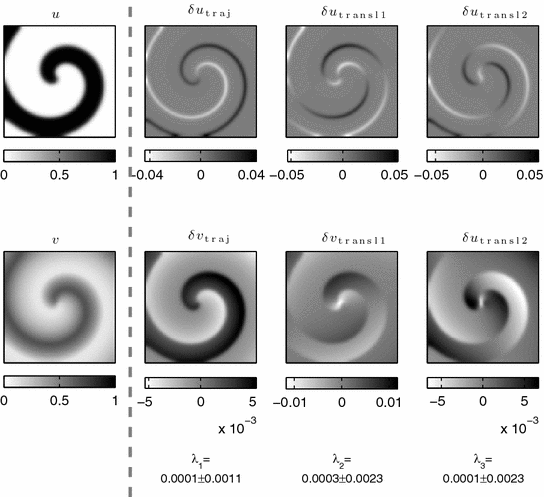
 (values obtained in the simulation indicated below each column). Linear combinations were chosen such that the second column represents a shift along the trajectory of the system. The third and fourth column correspond to translational Lyapunov vectors that are perpendicular both to each other and to the second column. Simulations done using parameter set B2, see p. 184. The numerical space step is
  , the domain size
  and the time step
  . Lyapunov vectors were allowed to align for a time span of
  time units, before the Lyapunov spectrum was calculated for
  time units (roughly 100 spiral periods) according to Sect. 2.2.6
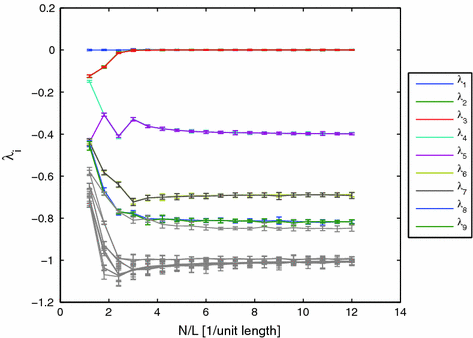
 (good numerical resolution). Note the initially stable translational perturbations (
 and
and  ) which become marginally stable as the resolution increases. Thus, at sufficiently high resolutions, the translational invariance of the PDE is preserved in the discretized system, whereas pinning of the spiral to the numerical grid is observed at low resolutions. Simulations done using parameter set B2, see p. 184. The numerical space step is indicated in the plot, the domain size is
  , the time step
  . Lyapunov vectors were allowed to align for
  time units, before the Lyapunov spectrum was calculated for
  time units (roughly 100 spiral periods) according to Sect. 2.2.6
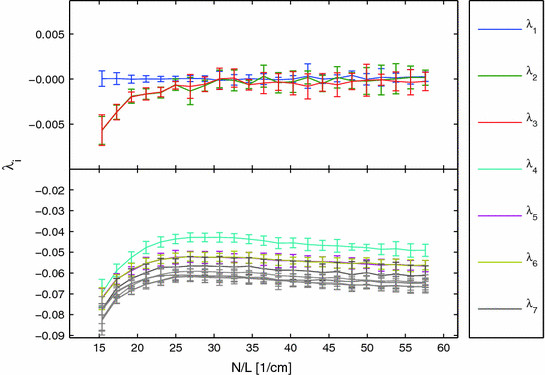
 ,
,  . The numerical space step is indicated in the plot, the domain size is
  , the time step
  . Lyapunov vectors were allowed to align for
  , before the Lyapunov spectrum was calculated for
  (roughly 22 spiral periods) according to Sect. 2.2.6
  and
and  , higher-index Lyapunov exponents increase towards lower resolutions, meaning that the corresponding perturbations become less stable. This effect is, however, not universal: Fig. 3.6 indicates that for specific parameters in the Fenton-Karma model, a low numerical resolution has a stabilizing effect on
  ,
, 3.1.3 Multiple Spiral Waves
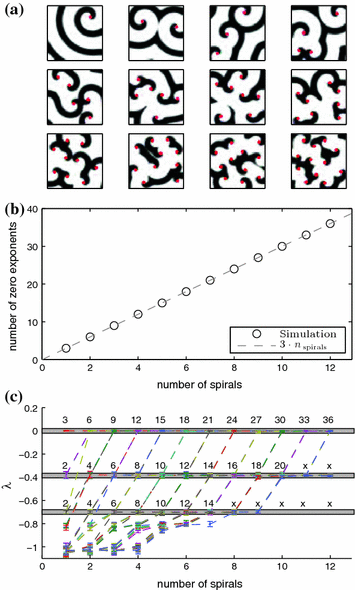
 of the Barkley model from simulations with one to twelve spirals exhibiting periodic dynamics. Black color indicates activation. Positions of phase singularities are marked by red dots. b Number of zero Lyapunov exponents for the above simulations. Every spiral contributes three such exponents, indicating the waves’ mutual independence in terms of angle and position (all symmetries are preserved individually). c Lyapunov spectrum of 50 leading exponents plotted against the number of spirals. Dashed lines indicate change of Lyapunov exponents for each additional spiral, Lyapunov exponents are colored randomly by their index. Numbers above gray bands indicate, how many Lyapunov exponents have a value within the corresponding interval of growth rates. Counts that are affected by the limited number of Lyapunov exponents (50) have been replaced by “x”. Simulation done using parameters B2, see p. 184. The numerical space step is
  , the domain size
  and the time step
  . Lyapunov vectors were allowed to align for a time span of
  time units, before the Lyapunov spectrum was calculated for another
  time units (roughly 100 spiral periods) according to Sect. 2.2.6
  -variable of the Barkley model for one to twelve spiral waves. The images correspond the state of the medium after an initial transient phase of spiral movement and possible disappearance of phase singularities from the medium. From the plot in Fig. 3.7b, it can be concluded that the specific signature of three zero Lyapunov exponents for a spiral wave must be carried by a relatively small region around the phase singularity. For one to twelve spiral waves, the number of zero Lyapunov exponents corresponds exactly to three times the number of spirals in the domain. This means that all the symmetries are preserved for each spiral individually. More specifically, this rules out the possibility that any of the spiral waves are phase-synchronized or that the position of one phase singularity is constrained by interaction with the surrounding ones (in which case some zero Lyapunov exponents should become negative). As indicated in Fig. 3.7c, this additive behavior of the Lyapunov spectrum does in fact extend to the next (more negative) two pairs of Lyapunov exponents. For the number of spirals and parameters considered here, the entire leading Lyapunov spectrum for
  spirals is therefore identical to that one expected for
  copies of a system with one spiral wave. This is remarkable, since different
  actually represent coexisting attractors in the same system. On the one hand, the behavior of the Lyapunov spectrum reveals that these attractors have a very specific structure. On the other hand, it confirms the intuitive interpretation of spiral waves in excitable media as objects.
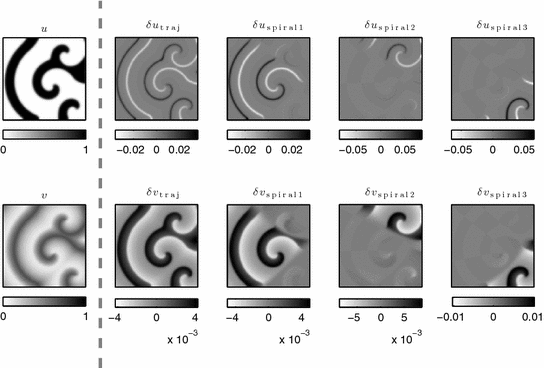
 is the perturbation along the trajectory of the complete system.
  are perturbations advancing each spiral individually in time, thereby separating the areas controlled by different spiral waves. Numerical and model parameters are identical to those used in Fig. 3.7
 3.1.4 Transition to Meandering
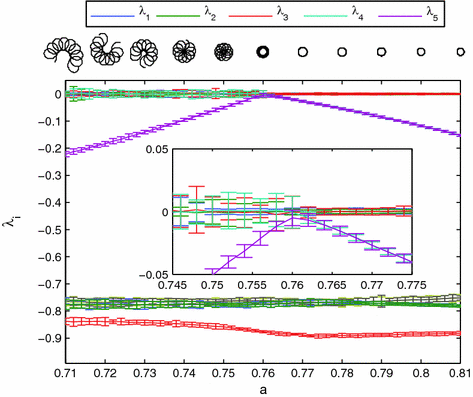
 ) to a meandering spiral (
 ) for parameter set B3, see p. 184. Spiral tip paths detected by the method outlined in Sect. 2.2.5 with
  are shown above the plot centered at the corresponding values of
  . The bifurcation point can be clearly detected from the spectrum of Lyapunov exponents. For meandering, the degenerate subspace of growth rate zero becomes four- instead of three-dimensional, as expected from the Hopf nature of the bifurcation. Inset plot enlarged around the bifurcation point. The numerical space step is
  , the domain size
  and the time step
  . Lyapunov vectors were allowed to align for a time span of
  time units, before the Lyapunov spectrum was calculated for
  time units (roughly 200 spiral periods independent of
  ) according to Sect. 2.2.6
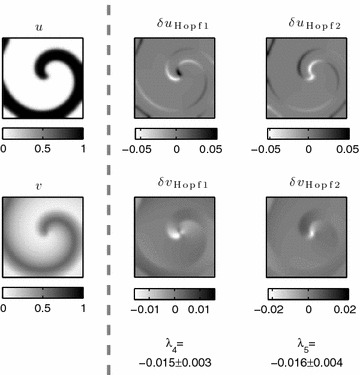
 , i.e. before the meandering bifurcation (c.f. Fig. 3.9). Shown is the medium state (leftmost column) and are two arbitrary perpendicular vectors in the degenerated subspace belonging to the fourth and fifth Lyapunov exponent (values indicated below each column)
 and is identical to the one considered in a publication by Barkley [14]. Towards the bifurcation point (from the right), two Lyapunov exponents approach zero, corresponding to the two-dimensional eigenspace for the fixed-point problem considered by Barkley. At the bifurcation, the rigid rotation of the spiral becomes unstable via the above-mentioned Hopf bifurcation. Since Lyapunov spectra only characterize the attractor the system is currently exploring, the two Lyapunov exponents do not become positive (as the real parts of the eigenvalues for the fixed-point analysis do). Instead, after the bifurcation (towards the left), there are now four zero Lyapunov exponents: two for the periodic or quasi-periodic dynamics on a torus and two—as before—as a result of the Euclidean symmetry (see Sects. 3.1.2 and 3.1.3). The Lyapunov vectors belonging to the two exponents approaching zero towards the critical parameter value correspond to the bifurcating directions in tangent space. Thus, the two vectors shown in Fig. 3.10 span the two-dimensional bifurcating subspace. As the Lyapunov vectors depicted in Fig. 3.4, which represent the Euclidian symmetry, the Lyapunov vectors for the meandering modes are concentrated at the wave front and back. However, while the symmetry modes have an angular periodicity of the wave front modulation of approximately
  (because of its action as a spatial shift), the meandering modes exhibit a higher spatial frequency. Note that this is similar to the increasing spatial frequency for higher-index modes for plane waves as depicted in Fig. 3.1.
 ,
,  and
and  of the Fenton-Karma model are obtained using a Newton-Raphson method in Ref. [16], and the dominant eigenvalues and eigenmodes at the fixed point have to be determined by further sophisticated methods. In contrast, Lyapunov exponents and vectors can be determined by standard procedures without any further algorithmic effort. Note also that the ability to detect and characterize this particular meandering bifurcation via linear stability analysis is based on the geometrically simple trajectory from which it originates, which makes it easily possible to transform a periodic orbit into a fixed point. While this can in the general case always be done by defining appropriate Poincaré sections, switching from the continuous to a time-discrete system might hide important details. In contrast, Lyapunov analysis could also be applied for meandering transitions where the (non-meandering) spiral trajectory is not just a circular motion.
3.1.5 Circular Heterogeneities
 and
and  are fixed, whereas the excitation threshold
  is varied. Figure 3.11 shows the Lyapunov spectra for a spiral wave in a homogeneous medium with the different values of
  . For the whole range, the spiral wave rotates steadily, indicated by three Lyapunov exponents which are equal to zero (similar to the spiral in Sect. 3.1.4 before the meandering bifurcation, see Fig. 3.9). The two Lyapunov exponents associated with meandering come very close to zero towards
  , but instead of bifurcating, they stabilize again for further increasing
  . Finally, for very high
  , the medium loses its ability to form spiral waves and so the Lyapunov spectrum becomes all negative, indicating a stable fixed point which corresponds to the stable, homogeneous resting state of the medium.
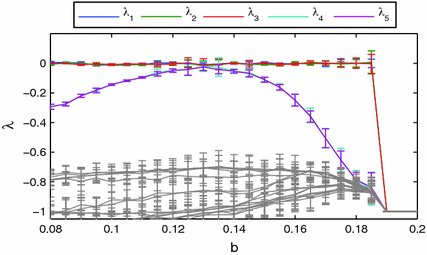
 throughout the medium. The range of the excitation threshold
  covers all values used in the heterogeneous scenario (cf. Fig. 3.12). The numerical space step is
  , the domain size
  and the time step
  . Lyapunov vectors were allowed to align for a time span of
  time units, before the Lyapunov spectrum was calculated for
  time units according to Sect. 2.2.6
  close to the spiral tip, in which the excitation threshold is increased from
  (which is used in the rest of the medium) to
  . It is well established that spiral waves are usually drawn to regions of longer spiral wave periods or lower excitability [17–19], although exceptions are known [20]. For the parameters used here, the expected behavior is indeed observed and the spiral wave is attracted by the heterogeneity if initiated close to it. A snapshot of the long time behavior for an exemplary simulation is shown in Fig. 3.12a. From Sect. 3.1.2 it is known that usually, two Lyapunov exponents which are equal to zero indicate the translational symmetry of the activation pattern. Consequently, for a heterogeneity which pins the spiral wave to a specific position as in Fig. 3.12a, these two exponents should become negative, similar to the pinning effect of the numerical grid observed in Fig. 3.5.
 and
and  reveals that the behavior of the system is much richer than expected. Figure 3.12c shows the Lyapunov spectrum of the dynamics for a small heterogeneity of
  in model length units, plotted against the parameter
  within the heterogeneity.
  corresponds to a homogeneous medium. As expected, the two Lyapunov exponents
  and
and  indicating spatial symmetry become negative with increasing excitation threshold
  . The heterogeneity thus seems to create one specific favorable location for the spiral and the “pinning force” to this location increases with the excitation threshold
  (indicated by the more and more stable symmetry modes).4 One can already see in the same plot that the destabilization of the meandering modes which was visible for homogeneously increased
  (see Fig. 3.11) is not fully suppressed:
  and
and  , which were identified as the meandering modes in Sect. 3.1.2, are slightly destabilized, although not enough to lead to a bifurcation and less than in the homogeneous case (see Fig. 3.11). However, if the heterogeneity is larger, as is the case for Fig. 3.12d (
 ), exactly this happens. Not only is the rate with which the symmetry modes become stable much faster, but at the same time, the meandering modes are destabilized much stronger, leading to a bifurcation close to
  which results in one additional zero Lyapunov exponent above
  (similar to meandering in a homogeneous medium). Note that, for this to happen, the Lyapunov exponents which correspond to the symmetry and meandering modes have to reverse their order (see value of
  marked by “” in Fig. 3.12d). This will be discussed in detail at the end of this section. Visual inspection of the spiral tip trajectories confirms that up to
  , the spiral wave is indeed held in a fixed position by the heterogeneity, as seen in Fig. 3.12a, whereas above the bifurcation value, the tip starts to meander. This effect is seen more easily for an even larger heterogeneity (
 ), with a Lyapunov spectrum as plotted in Fig. 3.12e. The corresponding spiral tip trajectory for the meandering region with two zero Lyapunov exponents is shown in Fig. 3.12b.
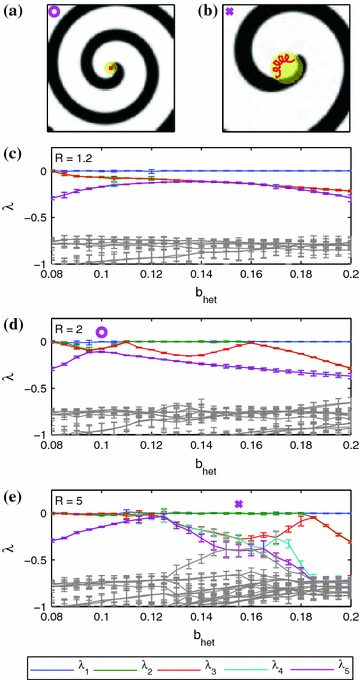
 of spirals interacting with a circular heterogeneity of increased excitation threshold
  (region indicated by yellow color). Parameter set B4 (see Table A.1, p. 184) is used with
  throughout the medium, except for the circular region, whose parameter
  is indicated by “” and “
 ” in (d) and (e), respectively. The spiral tip path detected using the method outlined in Sect. 2.2.5 with
  is plotted as a red line. c–e Leading Lyapunov spectra for three different radii of the heterogeneity (
 , respectively) plotted against the value of the model parameter
  within the circular region.
  corresponds to a homogeneous medium. The numerical parameters are identical to those noted in the caption of Fig. 3.11
  , the heterogeneity therefore acts as a pinning center, despite the fact that a homogeneous medium of the same increased excitation threshold is close to a meandering instability (cf. Fig. 3.11). For larger
  , however, this potential instability does not only reappear but is even enhanced, such that an actual bifurcation can take place which is not observed in the homogeneous case. Another interesting phenomenon for
  is that the symmetry modes are not stabilized for moderate values of
  , indicating that within the heterogeneity, the spiral can still evolve freely if the heterogeneity is not too strong. Also, note that the Lyapunov spectra for moderate
  (below the bifurcation value) look very similar to the homogeneous case in Fig. 3.11. The value of
  at which the spiral wave feels that the modification of
  is not global and deviates from the homogeneous behavior therefore increases with increasing
  . This is consistent with the fact that the case of
  is identical to the homogeneous scenario of Fig. 3.11.
 ) to the value of
  indicated by “”, it was implicitly assumed that the trend in growth rate for both modes continues and that indeed the Lyapunov exponents of the meandering modes approach a value of zero (later confirmed when the bifurcation takes place at about
  ). However, since the ordering of Lyapunov exponents from largest to smallest alone defines their indices, one would not be able to follow this (heuristic) reasoning if only the spectrum at
  (“”) was known. Fortunately, this is possible making use of one quantity disregarded so far this section: the Lyapunov vectors. Figure 3.13 shows the Lyapunov vectors for the five leading exponents in the system with
  and
and  . The first one corresponds to the perturbation along the trajectory, whereas the spatial symmetry modes can be found as the fourth and fifth Lyapunov vector.
  represents a shift of the wave pattern towards the lower right, whereas
  shifts the spiral wave towards the lower left. In contrast, the second and third Lyapunov vector exhibit a higher-frequency modulation of the wave front characteristic for the meandering modes (see Sect. 3.1.4). In this way, the reversal of stability order necessary for the pinned meandering bifurcation observed in this section can be objectively confirmed.
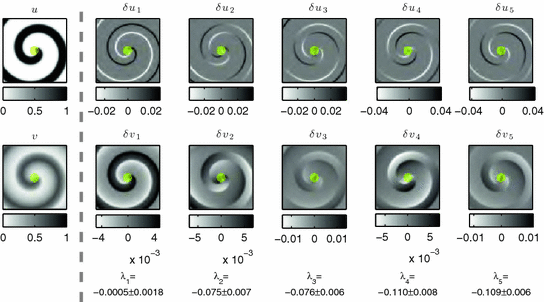
 is marked by yellow color. The medium state is depicted in the leftmost column. The five columns each show the
  and
and  components of the Lyapunov vectors. Values of Lyapunov exponents are printed below each column
3.1.6 Random Heterogeneities
 from the base value of
  towards higher excitation thresholds are imposed, where a well-defined correlation length serves as a similar measure as the radius of the heterogeneity in Sect. 3.1.5. To construct such a randomly varying
  , so-called Gaussian random fields are utilized. These are fully defined by their auto-correlation function, which makes it particularly easy to obtain different realizations. If
  is the intended correlation length, let
 is the power spectrum of the underlying field
  , so
, so![$$\begin{aligned} \left| \mathcal F_2[\beta _\text {full}]\right| = \sqrt{\mathcal F_2[R]}, \end{aligned}$$](/wp-content/uploads/2016/11/A328193_1_En_3_Chapter_Equ10.gif)
 denotes the two-dimensional Fourier transform in space. As the Fourier transform of the field
  is only determined up to its amplitude by this relation, different realizations of the field can be obtained by choosing random phases
  for each mode (numerically: for each computational point) and transforming the spectrum back to real space:
![$$\begin{aligned} \beta _\text {full}=\mathrm {Re}\left( \mathcal F_2^{-1}\left[ \theta \cdot \sqrt{\mathcal F_2[R]}\right] \right) , \end{aligned}$$](/wp-content/uploads/2016/11/A328193_1_En_3_Chapter_Equ11.gif)
 is the real part. The standard deviation of the obtained realization
  across the whole domain is then normalized to one and negative regions are set to zero to give the final modulation
  :
: for the simulation is then defined as
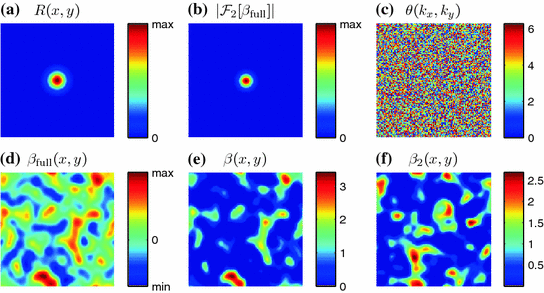
 with a defined correlation length
  [see Eq. (3.7)]. b Amplitude of the spectrum of the underlying random field, via Wiener-Khinchin theorem from (a) as in Eq. (3.8). c Random phase
  determining the realization of the field. d Realization of the field according to Eq. (3.9). e Normalized and capped version
  of the field in (d) used to modify the excitation threshold. f Same as (e), but for a different realization, i.e. different phases in (c)
 is by construction the value of
  which is one standard deviation of
  above the base value
  of the excitation threshold. It serves here as a measure for the amplitude of the heterogeneity and has a meaning similar to
  in Sect. 3.1.5. Simulations for a range of correlation lengths
  and target excitabilities
  were carried out. Because of the stochasticity of the system, for every fixed
  and
and  Lyapunov exponents were calculated using 40 different realizations of
  . The ensemble averages for three selected values of
  along with two exemplary snapshots are shown in Fig. 3.15. For rather small-scale heterogeneities (
 ), Fig. 3.15c shows that little more happens for increasing
  than the gradual stabilization of the Euclidian symmetry modes. This is in a way expected, because the spiral wave interacts with the first heterogeneity it encounters and pins to it. The gradual effect is a result of an increasing average amplitude of the heterogeneity with increasing
  . The meandering modes are only slightly destabilized and Lyapunov exponents with even higher indices,
  ,
,  . Note also that the standard deviation of the ensemble Lyapunov exponents increases towards higher
  , because there is a larger variability in the amplitude of heterogeneities the spiral can encounter.
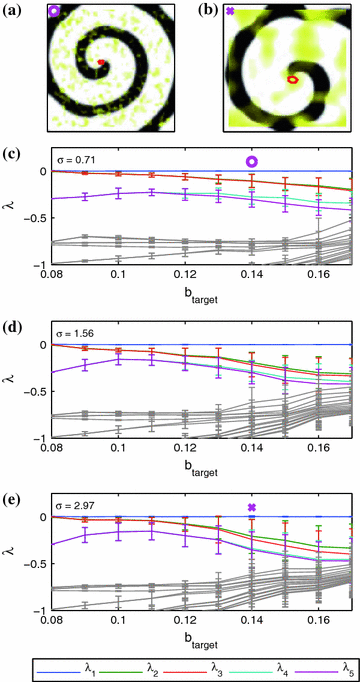
 of spirals interacting with the random heterogeneity of increased excitation threshold
  (deviation
  from the base value indicated by yellow color). Base parameters correspond to parameter set B4 (see Table A.1, p. 184) with
  . The value of
  for the example snapshots is indicated by “” and “
 ” in (c) and (e), respectively. The spiral tip path detected using the method outlined in Sect. 2.2.5 with
  is plotted as a red line. c–e Leading Lyapunov spectra for three different correlation lengths
  plotted against the strength
  of the heterogeneity.
  corresponds to a homogeneous medium. The plotted Lyapunov exponents are ensemble averages, error bars indicate standard deviation. The numerical space step is
  , the domain size
  and the time step
  . Lyapunov vectors were allowed to align for a time span of
  time units, before the Lyapunov spectrum was calculated for
  time units according to Sect. 2.2.6
  ), Fig. 3.15d shows a similar behavior. However, the symmetry modes are stabilized more rapidly and the meandering modes are considerably more destabilized compared to the first case. Thus, although there is, on average, no bifurcation, some of the behavior for a discrete heterogeneity (cf. Fig. 3.12) is maintained. A prominent difference is seen in the higher-index Lyapunov exponents, which clearly increase for higher
  , closing the otherwise large gap below the meandering modes. This is probably due to the heterogeneities with which the spiral tip is not directly interacting and which are distributed across the rest of the medium—a feature that does not exist for the discrete heterogeneities of Sect. 3.1.5.
 ), except for one: for small
  , the pinning force (as measured by the stabilization of the symmetry modes) stays relatively weak, before intensifying from
  upwards. This is again a somewhat masked version of the effect seen for large heterogeneities in Fig. 3.12e: There, no symmetry break was observed up to a certain threshold value of the heterogeneity amplitude. Hence, even for the random case, the larger the typical size of the heterogeneities, the stronger this heterogeneity needs to be to cause a considerable pinning effect, although the meandering modes are still destabilized immediately. The latter could make the spiral wave prone to other destabilizing factors, like a global parameter shift of the medium or random stimuli.
 ” in Fig. 3.15 are shown in Fig. 3.16. While the first Lyapunov vector can clearly be identified as a perturbation along the trajectory, the next four Lyapunov vectors appear to be more or less random modulations of the wave front with no discernible regularity. This is likely to be due to the irregular propagation of the spiral wave, which causes fluctuating growth rates of which the Lyapunov exponents (which nevertheless have an exact two-fold degeneracy) are only averages. Thus, the Lyapunov vectors are also time-dependent beyond a simple rotation.
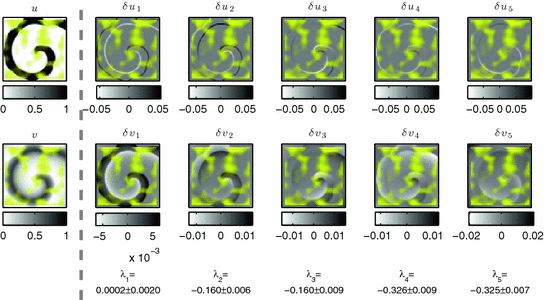
 ” in Fig. 3.15. The deviation
  from the base value is indicated by yellow color. The medium state is depicted in the leftmost column. The five columns each show the
  and
and  components of the Lyapunov vectors. Values of Lyapunov exponents are printed below each column
3.1.7 Heterogeneities in Spatio-Temporal Chaos
 , which was introduced by J. A. Kaplan and J. L. Yorke [23]. It was conjectured by Kaplan and Yorke that for typical (non-pathological) systems,
  is equal to the Rényi dimension of order 1 [24], which is also called the information dimension and is a fractal dimension for the attractor in phase space. A direct calculation of the information dimension is almost impossible for very high-dimensional attractors, as it relies on the estimation of the asymptotic probability distribution of trajectories in phase space and the time until densities sufficient for this estimation are reached increases with increasing dimensionality.
  , however, is a function of the spectrum of Lyapunov exponents and can thus easily be calculated, if the Lyapunov exponents are known. It is defined as
 is the largest index such that the sum (*) is still non-negative. Consequently, for non-chaotic attractors with
  for all
  , the Lyapunov dimension
  is equal to the number of Lyapunov exponents which are equal to zero. Heuristically, in the general case,
  is the number of degrees of freedom necessary to describe the dynamics, such that the resulting set in phase space is, on average, neither expanding nor contracting. For this reason, it can be used to estimate an effective number of degrees of freedom for high- or infinite-dimensional systems. In fact, as noted in the introduction in Sect. 1.7, in one of the two studies which have made use of Lyapunov exponents in excitable media so far, M. C. Strain and H. S. Greenside did exactly that [25]: In the Bär-Eiswrith model during spatio-temporal chaos,
  was found to be an extensive quantity and the average number of degrees of freedom per phase singularity was found to be a function of the model parameter
  in the chaotic regime. The following results build on this knowledge by considering heterogeneities in the same model parameter.
 with periodic boundary conditions, using the Bär-Eiswirth model with parameters
  ,
,  and
and  varying between
  and
and  . For the whole range of
  , spiral waves are known to break up leading to a state of spatio-temporal chaos [26]. In all cases, the activity is initiated by creating two spiral waves which subsequently break up as illustrated in Fig. 3.17a. Note that the initial condition is slightly asymmetric to prevent mirror symmetry which would persist even after breakup. The simulation is allowed to equilibrate for 1,500 model time units (roughly 300 dominant periods) before Lyapunov exponents and phase singularity statistics are obtained for another 1,500 time units. Phase singularities are detected every
  time units using the method introduced in Sect. 2.1.7 with
  . In contrast to Ref. [25], this fixed definition of phase is used independent of the value of
  , to be able to obtain comparable results later in the heterogeneous case. The Lyapunov dimension
  is calculated for the obtained Lyapunov spectra according to Eq. (3.12). In order to assess the accuracy of the dimension estimation, the calculated Lyapunov spectrum is shifted up (down) by the error estimate introduced in Sect. 2.2.6 and the Lyapunov dimension is calculated for the shifted spectra to yield an upper (lower) bound for
  .
.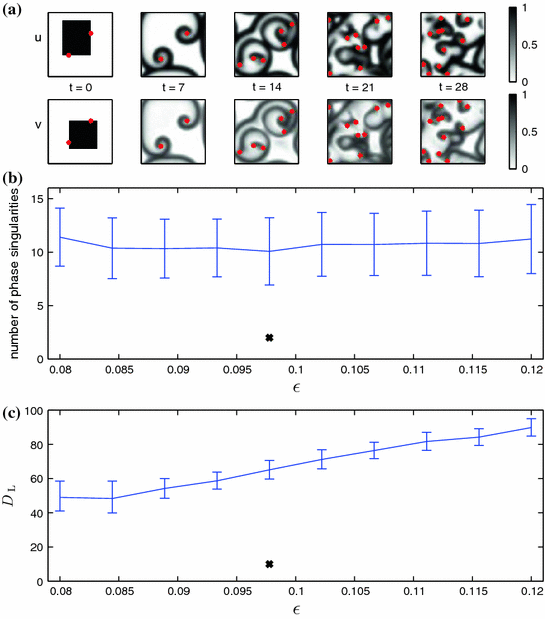
 and
and  for the beginning of an exemplary simulation showing the initiation protocol for spatio-temporal chaos (time progresses from left to right). Two spiral waves quickly break up and a turbulent state is formed. Red dots correspond to phase singularities detected by the method outlined in Sect. 2.2.5 with
  . The value of
  is marked by “
 ” in (b) and (c). b Mean number of phase singularities in simulations exhibiting spatio-temporal chaos, initiated as in (a), using parameter set BE1 (see Table A.1, p. 184) with different values of
  . The number of phase singularities is calculated every 1 model time units from
  to
to  to allow for equilibration. Error bars indicate standard deviation. c Kaplan-Yorke dimension
  for the same parameters as in (b). Error bars indicate the possible range of
  for Lyapunov spectra shifted by the error as calculated according to Sect. 2.2.6. The numerical space step is
  , the domain size
  and the time step
  . Lyapunov vectors were allowed to align for a time span of
  time units, before the Lyapunov spectrum was calculated for 1,500 time units (roughly 300 dominant periods) according to Sect. 2.2.6
  .5 Roughly 10 phase singularities are present on average in the simulation domain. In contrast, as indicated by Fig. 3.17c, the Lyapunov dimension
  increases steadily with increasing
  . This is plausible, as the transition to spiral breakup occurs just below
  [26] and is consistent with the results reported in Ref. [25]. Beyond the critical value, further increase of
  thus increases the chaoticity of the system.
 from this range are combined in a single medium? Similarly to the results presented in Sect. 3.1.5, circular heterogneities are considered. Since multiple spiral waves are present in the system, not only one but several circular heterogeneities, in which the value of
  is modified, are inserted into the system. For simplicity, here, a regular grid of
  heterogeneities is chosen, such that the total number of 16 heterogeneities is on the same order as the average number of phase singularities as calculated in Fig. 3.17b. Simulations were carried out for three different levels
  within the circular regions, whose radius radii
  was also varied. In the rest of the medium,
  was kept at its base value of
  . Phase singularity statistics and the Lyapunov dimension
  are calculated as above. Snapshots of an examplary simulation for heterogeneities with
  and
and  and the time evolution of the number of phase singularities can be found in Fig. 3.18.
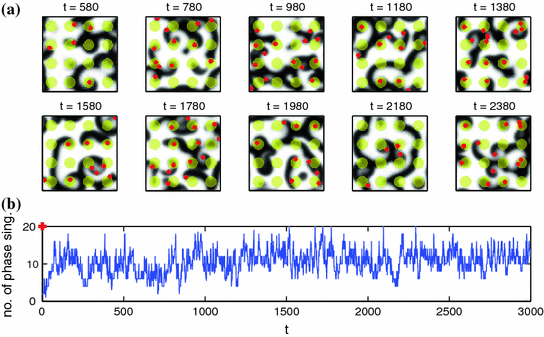
 of spatio-temporal chaos interacting with circular heterogeneities, within which
  is increased to
  (indicated by yellow color). Red dots correspond to phase singularities detected by the method outlined in Sect. 2.2.5 with
  . The radius
  of the heterogeneities and
  are indicated by “
 ” in Fig. 3.19. Parameter set BE1 (see Table A.1, p. 184) is used; outside the yellow regions
  . b Number of phase singularities for the entire simulation time. Statistics (shown in Fig. 3.19) are calculated from
  onwards. The “
 ” at
” at  indicates that the data corresponds to the equally marked parameters in Fig. 3.19
 Stay updated, free articles. Join our Telegram channel

Full access? Get Clinical Tree


