We read the insightful comments by Drs. Singh and Khosla on our meta-analysis of the outcomes of successful versus failed chronic total occlusion (CTO) percutaneous coronary intervention (PCI). A point by point response is as follows:
First, regarding the statement “Publication bias was assessed through visual inspection of funnel plots (Begg’s method) which demonstrated some asymmetry for all-cause mortality, myocardial infarction, angina, CABG and MACE suggestive of possible publication bias,” the term “possible” means that there is no certainty that the asymmetry was due to publication bias, and therefore, there are other potential explanations, as proposed by Drs. Singh and Khosla.
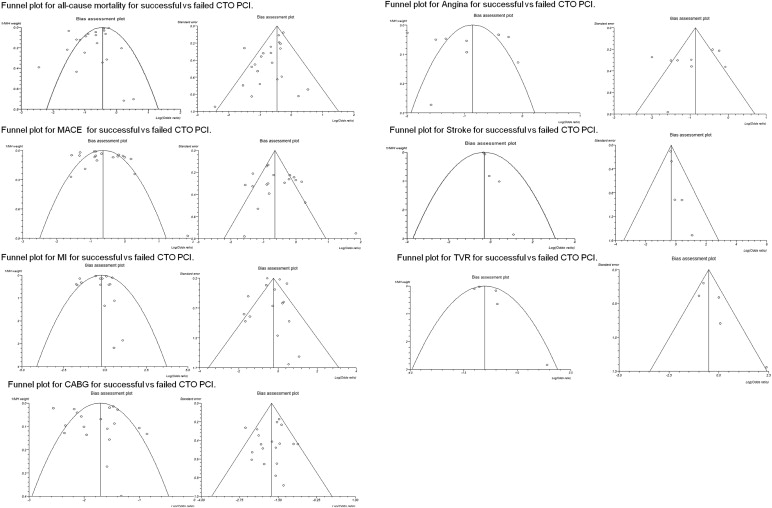
Second, regarding plotting standard error of log odd versus plotting variance of log odds ratio against log odds ratio, both are perfectly valid and acceptable methods. Indeed, as can be observed in Figure 1 , where we plotted both methods simultaneously, the plots are pretty similar.
Third, the authors criticize listing of 3 statistical tests of publication bias with each funnel plot and suggest that when <10 studies are included in an analysis, statistical tests are meaningless. What the Cochrane Handbook for Systematic Reviews of Interventions states is that “as a rule of thumb, tests for funnel plot asymmetry should be used only when there are at least 10 studies included in the meta-analysis, because when there are fewer studies the power of the tests is too low to distinguish chance from real asymmetry.” In our study, the statistical tests for asymmetry in the funnel plot for stroke were significant, although <10 studies were included; hence, the limitation of low power does not apply. In the funnel plots for angina, stroke, and target vessel revascularization, it is stated that the Begg-Mazumdar Kendall’s tau test has low power. Although a priori specification of the testing test for funnel plot asymmetry is desirable, this can be challenging because choice depends on the degree of heterogeneity observed. In our study, all 3 statistical tests for asymmetry provided concordant results, except for 1 funnel plot (the one for all-cause mortality), in which 2 of the 3 bias indicators were significant (Egger bias p = 0.02, and Horbod-Egger bias p = 0.02) but the third one (that had the least power) was not (Begg-Mazumbar p = 0.20). Therefore, our conclusions do not substantially change whether 1 or 3 statistical tests are listed evaluating the asymmetry of the funnel plots.
Fourth, the statement “publication bias is possible (higher volume, more experienced centers may be more likely to report their outcomes)” is criticized as difficult to interpret and disconnected from the analysis. Publication bias is highly likely in CTO PCI publications as studies reporting high failure rates or high incidence of subsequent adverse events are less likely to receive favorable reviews (and eventually get published) compared with manuscripts reporting positive results. Although no statistical test can definitely answer the question of whether publication bias actually exists, based on our extensive experience publishing on CTO PCI and reviewing several related manuscripts every year, we believe that publication bias exists.
Fifth, regarding sources of bias for the meta-analysis, although every bias is possible in a meta-analysis of observational studies, selection bias is most likely to be present (different baseline characteristics among the compared groups). Selection bias was addressed in both the results and the discussion because it likely explains a significant part of the differences in outcomes observed between the 2 study groups. Performance bias is possible, but, if anything, it would reduce any observed differences, as patients with failed CTO PCI might be more likely to receive more aggressive post-PCI care. Detection bias is unlikely because most of the outcomes assessed were “hard” (such as death, myocardial infarction, coronary revascularization, and stroke). Attrition bias is unlikely as most studies were retrospective observational studies.
Sixth, regarding the use of the fixed- versus random-effects model, Drs. Singh and Khosla state that “the random effect models were used in the review without proper rationale” “although they appropriate in most analyses here.” The basic assumption of a fixed-effects model is that “there is one true effect size which is shared by all the included studies.” This assumption is implausible in our meta-analysis, for multiple reasons, such as the wide variability in population studied, procedural and long-term outcomes, and period when each study was performed. Therefore, the random-effects model was the appropriate model for our meta-analysis. Indeed, the random-effects model was used in most previous similar meta-analyses, whereas the fixed-effects model was only used in one (whereas 1 meta-analysis used both fixed- and random-effects model ). When the fixed-effects model was used in our study, results were nearly identical, as shown in Table 1 .


