Although statin therapy is essential for secondary cardiovascular prevention, the therapeutic effect of statins on cardiovascular outcomes in patients with advanced chronic kidney disease (CKD) after coronary revascularization has not been fully elucidated. In the CREDO-Kyoto Registry Cohort-2, 14,706 patients who underwent first coronary revascularization were divided into 4 strata based on estimated glomerular filtration rate (eGFR) or status of hemodialysis (HD). Patients in each stratum were further divided into 2 groups based on statin therapy at discharge: non-CKD stratum (eGFR ≥60 ml/min/1.73 m 2 ), 8,959 patients (statin, n = 4,747; no statin, n = 4,212); mild CKD stratum (eGFR ≥30 to <60 ml/min/1.73 m 2 ), 4,567 patients (statin, n = 2,135; no statin, n = 2,432); severe CKD stratum (eGFR <30 ml/min/1.73 m 2 ), 608 patients (statin, n = 229; no statin, n = 379); and HD stratum, 572 patients (statin, n = 117; no statin, n = 455). Median follow-up duration was 956 days (interquartile range 699 to 1,245). Adjusted risk for major adverse cardiovascular events (MACEs; composite of cardiovascular death, myocardial infarction, or stoke) was significantly lower in the statin group than in the no-statin group in the non-CKD (hazard ratio 0.8, 95% confidence interval 0.68 to 0.95, p = 0.01) and mild CKD (hazard ratio 0.69, 95% confidence interval 0.56 to 0.84, p = 0.0002) strata. However, a significant association of statin therapy and lower risk for MACEs was not seen in the severe CKD (hazard ratio 0.91, 95% confidence interval 0.6 to 1.38, p = 0.65) and HD (hazard ratio 1.04, 95% confidence interval 0.64 to 1.69, p = 0.87) strata. In conclusion, statin therapy was associated with significantly lower risk for MACEs in patients with non-CKD and mild CKD undergoing coronary revascularization. However, therapeutic benefits of statins were not apparent in patients with severe CKD and HD.
Chronic kidney disease (CKD) is one of the strongest prognostic factors in patients with coronary artery disease, and primary and secondary preventions are important for patients with CKD. Beneficial effects of 3-hydroxy-3-methylglutaryl coenzyme A reductase inhibitors (statins) on cardiovascular outcomes have been shown in a wide range of patient groups. However, previous studies have suggested that effects of statins in patients with CKD might differ according to severity of renal dysfunction. It has been repeatedly demonstrated that statin therapy decreases the risk for cardiovascular events in patients with mild CKD, whereas statin therapy has been found to not decrease cardiovascular risk in patients on hemodialysis (HD) in randomized controlled trials. Recently, the Study of Heart and Renal Protection (SHARP) trial showed that coadministration of simvastatin plus ezetimibe decreased the incidence of major atherosclerotic events in a wide range of patients with advanced CKD. However, the SHARP trial excluded patients with a history of myocardial infarction or coronary revascularization. In addition, effects of simvastatin and ezetimibe could not be individually evaluated in this trial. Thus, further investigations to evaluate the effect of statin therapy on cardiovascular outcomes in patients with advanced CKD and coronary artery disease would be warranted. In the present study, we analyzed the impact of statin therapy on cardiovascular outcomes in patients with or without CKD in a large Japanese observational database of patients who underwent first coronary revascularization.
Methods
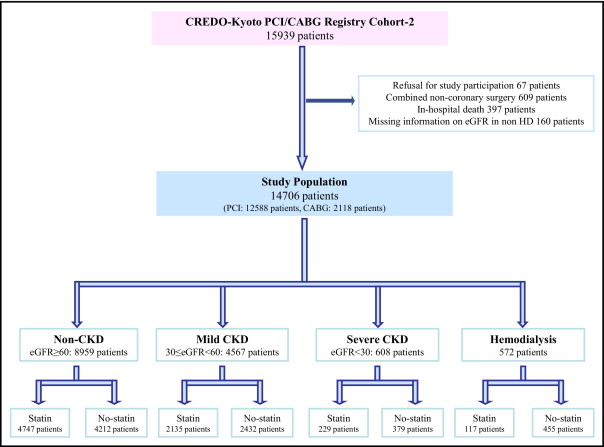
The design and patient enrollment (from January 2005 to December 2007) of the Coronary Revascularization Demonstrating Outcome Study in Kyoto Percutaneous Coronary Intervention/Coronary Artery Bypass Grafting (CREDO-Kyoto PCI/CABG) Registry Cohort-2 ( Supplementary Appendix A ) has been described previously. Of the 15,939 patients registered, 14,706 patients (PCI, 12,588; isolated CABG, 2,118) constituted the study population for the present analyses. Patients were divided into 4 strata based on estimated glomerular filtration rate (eGFR) or status of HD and patients in each stratum were further divided into 2 groups based on statin therapy at discharge: non-CKD stratum (eGFR ≥60 ml/min/1.73 m 2 ), 8,959 patients (statin group, n = 4,747; no-statin group, n = 4,212); mild CKD stratum (eGFR ≥30 to <60 ml/min/1.73 m 2 ), 4,567 patients (statin group, n = 2,135; no-statin group, n = 2,432): severe CKD stratum (eGFR <30 ml/min/1.73 m 2 ), 608 patients (statin group, n = 229; no-statin group, n = 379); and HD stratum, 572 patients (statin group, n = 117; no-statin group, n = 455; Figure 1 ).
Definitions of baseline characteristics/events and data collection by experienced clinical research coordinators in the independent research organization (Research Institute for Production Development, Kyoto, Japan; Supplementary Appendix B ) were described previously. Low-density lipoprotein cholesterol concentrations were calculated by the Friedewald formula. For triglyceride levels ≥400 mg/dl, low-density lipoprotein cholesterol was judged as missing information. Renal function was expressed as eGFR calculated by the Modification of Diet in Renal Disease formula modified for Japanese patients. The primary outcome measurement in the present analysis was major adverse cardiovascular events (MACEs; composite of cardiovascular death, myocardial infarction, or stroke). Cardiovascular death, myocardial infarction, and stroke were adjudicated against original source documents by a clinical event committee ( Supplementary Appendix C ).
Median follow-up duration was 956 days (interquartile range 699 to 1,245). Serum lipid levels and eGFR during follow-up were measured optionally in 8,987 patients (61%) and in 12,382 patients (84%), respectively, and median interval from the index procedure to the measurement was 357 days (interquartile range 254 to 398).
Categorical variables were compared with chi-square test. Continuous variables were expressed as mean ± SD or median and interquartile range and compared using Student’s t test or Wilcoxon rank-sum test based on their distributions. Cumulative incidence was estimated by the Kaplan–Meier method and differences were assessed with log-rank test. We used Cox proportional hazard models to estimate risk for MACEs in each stratum adjusting the differences in patient characteristics, procedural factors, and medications. Consistent with our previous reports, we chose 31 clinically relevant factors listed in Table 1 as risk-adjusting variables. Continuous variables were dichotomized by clinically meaningful reference values or median values. Statin therapy and the 31 risk-adjusting variables were simultaneously included in the Cox proportional hazard model. Twenty-six centers were included in the model as stratification variables. Effect of statin therapy (statin compared to no-statin group) was expressed as hazard ratios and their 95% confidence intervals. Statistical analyses were conducted by a physician (M.N.) and by a statistician (T.M.) using JMP 8.0 and SAS 9.2 (SAS Institute, Cary, North Carolina). All statistical analyses were 2-tailed and p values <0.05 were considered statistically significant.
| Variable | Non-CKD (eGFR ≥60 ml/min/1.73 m 2 ) | Mild CKD (eGFR ≥30–<60 ml/min/1.73 m 2 ) | ||||
|---|---|---|---|---|---|---|
| Statin | No statin | p Value | Statin | No statin | p Value | |
| (n = 4,747) | (n = 4,212) | (n = 2,135) | (n = 2,432) | |||
| Clinical characteristics | ||||||
| Age (years) | 64.4 ± 10.7 | 67.0 ± 10.5 | <0.0001 | 71.4 ± 9.4 | 73.4 ± 9.0 | <0.0001 |
| Age ≥75 ⁎ | 888 (19%) | 1,086 (26%) | <0.0001 | 854 (40%) | 1,190 (49%) | <0.0001 |
| Men ⁎ | 3,414 (72%) | 3,257 (77%) | <0.0001 | 1,438 (67%) | 1,767 (73%) | <0.0001 |
| Body mass index (kg/m 2 ) | 24.3 ± 3.4 | 23.3 ± 3.3 | <0.0001 | 24.3 ± 3.4 | 23.3 ± 3.6 | <0.0001 |
| Body mass index <25.0 ⁎ | 2,998 (63%) | 3,051 (72%) | <0.0001 | 1,322 (62%) | 1,771 (73%) | <0.0001 |
| Baseline lipid levels | ||||||
| Total cholesterol (mg/dl) | 200 ± 42.4 | 186 ± 35.0 | <0.0001 | 192 ± 41.7 | 184 ± 37.3 | <0.0001 |
| High-density lipoprotein cholesterol (mg/dl) | 48.7 ± 13.3 | 48.0 ± 13.5 | 0.01 | 47.2 ± 13.5 | 45.5 ± 13.1 | <0.0001 |
| Triglyceride (mg/dl) | 114 (79–169) | 103 (71–150) | <0.0001 | 114 (81–165) | 106 (73–148) | <0.0001 |
| Low-density lipoprotein cholesterol (mg/dl) | 124 ± 37.9 | 114 ± 30.2 | <0.0001 | 119 ± 37.6 | 115 ± 31.5 | 0.0005 |
| Estimated glomerular filtration rate (ml/min/1.73 m 2 ) | 79.2 ± 23.8 | 78.3 ± 16.8 | 0.04 | 49.1 ± 7.7 | 48.5 ± 8.0 | 0.006 |
| Acute myocardial infarction ⁎ | 1,759 (37%) | 1,289 (31%) | <0.0001 | 607 (28%) | 606 (25%) | 0.007 |
| Hypertension ⁎ | 3,863 (81%) | 3,272 (78%) | <0.0001 | 1,879 (88%) | 2,076 (85%) | 0.009 |
| Diabetes mellitus ⁎ | 1,799 (38%) | 1,540 (37%) | 0.19 | 864 (40%) | 926 (38%) | 0.10 |
| On insulin therapy | 287 (6.1%) | 285 (6.8%) | 0.16 | 198 (9.3%) | 229 (9.4%) | 0.87 |
| Current smoking ⁎ | 1,778 (37%) | 1,432 (34%) | 0.0007 | 496 (23%) | 616 (25%) | 0.10 |
| Heart failure ⁎ | 537 (11%) | 607 (14%) | <0.0001 | 477 (22%) | 702 (29%) | <0.0001 |
| Shock at presentation | 124 (2.6%) | 103 (2.5%) | 0.62 | 134 (6.3%) | 175 (7.2%) | 0.22 |
| Mitral regurgitation grade 3/4 ⁎ | 93 (2.0%) | 122 (2.9%) | 0.004 | 88 (4.1%) | 148 (6.1%) | 0.003 |
| Ejection fraction | 60.1 ± 12.3 | 59.1 ± 12.7 | 0.0004 | 58.9 ± 13.4 | 57.0 ± 14.2 | <0.0001 |
| Previous myocardial infarction ⁎ | 444 (9.4%) | 412 (9.8%) | 0.49 | 316 (15%) | 382 (16%) | 0.40 |
| Previous stroke ⁎ | 324 (6.8%) | 435 (10%) | <0.0001 | 282 (13%) | 363 (15%) | 0.10 |
| Peripheral vascular disease ⁎ | 231 (4.9%) | 296 (7.0%) | <0.0001 | 202 (9.5%) | 282 (12%) | 0.02 |
| Multivessel disease | 2,672 (56%) | 2,365 (56%) | 0.89 | 1,398 (65%) | 1,587 (65%) | 0.87 |
| Target of proximal left anterior descending artery ⁎ | 2,950 (62%) | 2,626 (62%) | 0.84 | 1,260 (59%) | 1,519 (62%) | 0.02 |
| Unprotected left main coronary artery disease ⁎ | 263 (5.5%) | 362 (8.6%) | <0.0001 | 154 (7.2%) | 281 (12%) | <0.0001 |
| Target of chronic total occlusion ⁎ | 636 (13%) | 670 (16%) | 0.0008 | 342 (16%) | 477 (20%) | 0.002 |
| Revascularization by coronary artery bypass grafting ⁎ | 347 (7.3%) | 713 (17%) | <0.0001 | 234 (11%) | 553 (23%) | <0.0001 |
| Atrial fibrillation ⁎ | 277 (5.8%) | 378 (9.0)% | <0.0001 | 210 (9.8%) | 385 (16%) | <0.0001 |
| Anemia (hemoglobin <11 g/dl) ⁎ | 194 (4.1%) | 307 (7.3%) | <0.0001 | 234 (11%) | 421 (17%) | <0.0001 |
| Platelet count <100 × 10 9 /L ⁎ | 33 (0.7%) | 66 (1.6%) | <0.0001 | 18 (0.8%) | 49 (2.0%) | 0.0008 |
| Chronic obstructive pulmonary disease ⁎ | 160 (3.4%) | 158 (3.8%) | 0.33 | 75 (3.5%) | 88 (3.6%) | 0.88 |
| Liver cirrhosis ⁎ | 91 (1.9%) | 139 (3.3%) | <0.0001 | 33 (1.6%) | 78 (3.2%) | 0.0002 |
| Malignancy ⁎ | 315 (6.6%) | 423 (10%) | <0.0001 | 215 (10%) | 271 (11%) | 0.24 |
| Baseline medication | ||||||
| Medication at hospital discharge | ||||||
| Antiplatelet therapy | ||||||
| Thienopyridine | 4,366 (92%) | 3,475 (83%) | <0.0001 | 1,881 (88%) | 1,877 (77%) | <0.0001 |
| Ticlopidine | 3,852 (89%) | 3,204 (92%) | <0.0001 | 1,657 (88%) | 1,734 (93%) | <0.0001 |
| Clopidogrel | 498 (11%) | 264 (7.6%) | <0.0001 | 221 (12%) | 140 (7.5%) | <0.0001 |
| Aspirin | 4,721 (99%) | 4,166 (99%) | 0.004 | 2,107 (99%) | 2,391 (98%) | 0.30 |
| Cilostazol ⁎ | 946 (20%) | 708 (17%) | 0.0001 | 361 (17%) | 352 (14%) | 0.02 |
| Other medications | ||||||
| β Blockers ⁎ | 1,608 (34%) | 1,015 (24%) | <0.0001 | 780 (37%) | 671 (28%) | <0.0001 |
| Angiotensin-converting enzyme inhibitors/angiotensin II receptor blockers ⁎ | 2,893 (61%) | 2,069 (49%) | <0.0001 | 1,316 (62%) | 1,265 (52%) | <0.0001 |
| Nitrates ⁎ | 1,495 (31%) | 1,669 (40%) | <0.0001 | 728 (34%) | 973 (40%) | <0.0001 |
| Calcium channel blockers ⁎ | 1,776 (37%) | 1,754 (42%) | <0.0001 | 970 (45%) | 1,112 (46%) | 0.84 |
| Nicorandil ⁎ | 1,200 (25%) | 1,117 (27%) | 0.18 | 592 (28%) | 687 (28%) | 0.70 |
| Warfarin ⁎ | 443 (9.3%) | 556 (13%) | <0.0001 | 245 (11%) | 427 (18%) | <0.0001 |
| Proton pump inhibitors ⁎ | 1,245 (26%) | 1,069 (25%) | 0.36 | 617 (29%) | 686 (28%) | 0.61 |
| H 2 blockers ⁎ | 1,322 (28%) | 1,186 (28%) | 0.75 | 617 (29%) | 667 (27%) | 0.27 |
| Serum levels during follow-up † | ||||||
| Total cholesterol (mg/dl) | 176 ± 34.2 | 188 ± 33.3 | <0.0001 | 174 ± 33.7 | 186 ± 35.3 | <0.0001 |
| High-density lipoprotein cholesterol (mg/dl) | 53.0 ± 14.1 | 52.0 ± 15.1 | 0.01 | 51.1 ± 14.3 | 49.8 ± 14.2 | 0.02 |
| Triglyceride (mg/dl) | 120 (87–170) | 118 (84–168) | 0.1 | 125 (91–173) | 120 (86–169) | 0.04 |
| Low-density lipoprotein cholesterol (mg/dl) | 95.3 ± 28.3 | 110 ± 29.9 | <0.0001 | 94.7 ± 28.8 | 109 ± 30.6 | <0.0001 |
| Low-density lipoprotein cholesterol change (mg/dl) | −30.9 ± 39.1 | −6.3 ± 33.4 | <0.0001 | −26.2 ± 39.9 | −7.9 ± 34.6 | <0.0001 |
| Low-density lipoprotein cholesterol change (%) | −19.8 ± 28.9 | −1.4 ± 31.7 | <0.0001 | −15.9 ± 33.0 | −1.9 ± 37.6 | <0.0001 |
| Estimated glomerular filtration rate (ml/min/1.73 m 2 ) | 71.0 ± 16.8 | 70.9 ± 16.8 | 0.82 | 48.8 ± 13.4 | 49.0 ± 14.1 | 0.64 |
| Estimated glomerular filtration rate change (ml/min/1.73 m 2 ) | −8.2 ± 24.9 | −7.1 ± 15.9 | 0.02 | −0.28 ± 11.6 | 0.34 ± 11.8 | 0.10 |
| Estimated glomerular filtration rate change/year (ml/min/1.73 m 2 ) | −11.3 ± 63.3 | −8.0 ± 53.1 | 0.01 | 2.1 ± 39.8 | 2.5 ± 37.7 | 0.77 |
⁎ Potential independent variables selected for multivariate analysis.
† Values for serum lipid levels during follow-up were available in 3,271 patients in the statin group and in 2,457 patients in the no-statin group in the nonchronic kidney disease stratum and 1,387 patients in the statin group and 1,318 patients in the no-statin group in the mild chronic kidney disease stratum. Values for estimated glomerular filtration rate levels during follow-up were available in 4,152 patients in the statin group and 3,479 patients in the no-statin group in the nonchronic kidney disease stratum, 1,848 patients in the statin group and 1,985 patients in the no-statin group in the mild chronic kidney disease stratum.
Relevant review boards or ethics committees in all participating centers approved the research protocol. Because of retrospective enrollment, written informed consent from patients was waived; however, we excluded those patients who refused participation in the study when contacted for follow-up. This strategy is concordant with guidelines for epidemiologic studies issued by the Ministry of Health, Labor and Welfare of Japan.
Results
In the non-CKD and mild CKD strata, patients in the statin group were younger and had higher body mass index than those in the no-statin group. Female gender, acute myocardial infarction, and hypertension were found more often in the statin group than in the no-statin group, whereas heart failure, moderate to severe mitral regurgitation, peripheral vascular disease, unprotected left main coronary artery disease, target of chronic total occlusion, revascularization by CABG, atrial fibrillation, anemia, low platelet count, and liver cirrhosis were more common in the no-statin than in the statin group. Ejection fraction and eGFR were significantly lower in the no-statin than in the statin group. Baseline lipid profile and medications were also significantly different between the 2 groups in the 2 strata ( Table 1 ).
In the severe CKD stratum, patients in the statin group were younger and had higher body mass index and eGFR than those in the no-statin group. Female gender and hypertension were found more often in the statin group than in the no-statin group, whereas revascularization by CABG, atrial fibrillation, and anemia were more common in the no-statin than in the statin group. Baseline lipid profile and medications were also significantly different between the 2 groups ( Table 2 ).
| Variable | Severe CKD (eGFR <30 ml/min/1.73 m 2 ) | HD | ||||
|---|---|---|---|---|---|---|
| Statin | No statin | p Value | Statin | No statin | p Value | |
| (n = 229) | (n = 379) | (n = 117) | (n = 455) | |||
| Clinical characteristics | ||||||
| Age (years) | 72.0 ± 10.1 | 74.6 ± 9.7 | 0.002 | 65.6 ± 11.0 | 65.5 ± 9.7 | 0.94 |
| Age ≥75 years | 106 (46%) | 203 (54%) | 0.08 | 28 (24%) | 82 (18%) | 0.16 |
| Men | 119 (52%) | 247 (65%) | 0.001 | 68 (58%) | 363 (80%) | <0.0001 |
| Body mass index (kg/m 2 ) | 23.9 ± 3.9 | 23.0 ± 3.5 | 0.004 | 22.8 ± 4.6 | 21.9 ± 3.2 | 0.02 |
| Body mass index <25.0 | 153 (67%) | 289 (76%) | 0.01 | 88 (75%) | 384 (84%) | 0.02 |
| Baseline lipid levels | ||||||
| Total cholesterol (mg/dl) | 187 ± 45.1 | 175 ± 43.7 | 0.001 | 170 ± 42.4 | 162 ± 39.9 | 0.04 |
| High-density lipoprotein cholesterol (mg/dl) | 44.6 ± 14.0 | 41.5 ± 12.2 | 0.01 | 46.4 ± 14.9 | 43.2 ± 13.0 | 0.04 |
| Triglyceride (mg/dl) | 121 (85–188) | 107 (72–154) | 0.02 | 97 (74–153) | 100 (70–141) | 0.46 |
| Low-density lipoprotein cholesterol (mg/dl) | 114 ± 38.7 | 109 ± 35.2 | 0.14 | 102 ± 35.1 | 94.4 ± 29.6 | 0.04 |
| Estimated glomerular filtration rate (ml/min/1.73 m 2 ) | 22.0 ± 6.2 | 20.8 ± 6.7 | 0.04 | NA | NA | |
| Acute myocardial infarction | 58 (25%) | 109 (29%) | 0.36 | 18 (15%) | 46 (10%) | 0.12 |
| Hypertension | 221 (97%) | 342 (90%) | 0.003 | 105 (90%) | 392 (86%) | 0.29 |
| Diabetes mellitus | 128 (56%) | 203 (54%) | 0.58 | 72 (62%) | 274 (60%) | 0.79 |
| On insulin therapy | 50 (22%) | 87 (23%) | 0.75 | 44 (38%) | 127 (28%) | 0.04 |
| Current smoking | 48 (21%) | 93 (25%) | 0.31 | 20 (17%) | 96 (21%) | 0.33 |
| Heart failure | 96 (42%) | 183 (48%) | 0.13 | 43 (37%) | 144 (32%) | 0.30 |
| Shock at presentation | 22 (9.6%) | 44 (12%) | 0.44 | 3 (2.6%) | 11 (2.4%) | 0.93 |
| Mitral regurgitation grade 3/4 | 18 (7.9%) | 30 (7.9%) | 0.98 | 10 (8.6%) | 35 (7.7%) | 0.76 |
| Ejection fraction | 55.5 ± 14.2 | 54.0 ± 14.7 | 0.26 | 53.2 ± 14.1 | 54.1 ± 13.8 | 0.54 |
| Previous myocardial infarction | 41 (18%) | 75 (20%) | 0.57 | 24 (21%) | 59 (13%) | 0.046 |
| Previous stroke | 41 (18%) | 86 (23%) | 0.16 | 11 (9.4%) | 71 (16%) | 0.07 |
| Peripheral vascular disease | 23 (10%) | 46 (12%) | 0.43 | 17 (15%) | 90 (20%) | 0.18 |
| Multivessel disease | 165 (72%) | 284 (75%) | 0.43 | 83 (71%) | 311 (68%) | 0.59 |
| Target of proximal left anterior descending artery | 136 (59%) | 227 (60%) | 0.90 | 64 (55%) | 266 (58%) | 0.46 |
| Unprotected left main coronary artery disease | 23 (10%) | 45 (12%) | 0.49 | 12 (10%) | 55 (12%) | 0.58 |
| Target of chronic total occlusion | 43 (19%) | 72 (19%) | 0.95 | 22 (19%) | 86 (19%) | 0.98 |
| Revascularization by coronary artery bypass grafting | 38 (17%) | 109 (29%) | 0.0005 | 12 (10%) | 112 (25%) | 0.0003 |
| Atrial fibrillation | 21 (9.2%) | 65 (17%) | 0.005 | 15 (13%) | 60 (13%) | 0.92 |
| Anemia (hemoglobin <11 g/dl) | 105 (46%) | 214 (56%) | 0.01 | 70 (60%) | 270 (59%) | 0.92 |
| Platelet count <100 × 10 9 /L | 4 (1.8%) | 10 (2.6%) | 0.47 | 6 (5.1%) | 27 (5.9%) | 0.74 |
| Chronic obstructive pulmonary disease | 14 (6.1%) | 15 (4.0%) | 0.23 | 1 (0.9%) | 7 (1.5%) | 0.55 |
| Liver cirrhosis | 6 (2.6%) | 16 (4.2%) | 0.29 | 4 (3.4%) | 31 (6.8%) | 0.15 |
| Malignancy | 23 (10%) | 56 (15%) | 0.09 | 4 (3.4%) | 47 (10%) | 0.01 |
| Baseline medication | ||||||
| Medication at hospital discharge | ||||||
| Antiplatelet therapy | ||||||
| Thienopyridine | 188 (82%) | 273 (72%) | 0.004 | 103 (88%) | 345 (76%) | 0.003 |
| Ticlopidine | 173 (92%) | 252 (93%) | 0.70 | 93 (90%) | 321 (93%) | 0.37 |
| Clopidogrel | 15 (8.0%) | 19 (7.0%) | 0.70 | 10 (9.7%) | 24 (7.0%) | 0.37 |
| Aspirin | 226 (99%) | 377 (99%) | 0.31 | 115 (98%) | 444 (98%) | 0.64 |
| Cilostazol | 30 (13%) | 56 (15%) | 0.56 | 11 (9.4%) | 59 (13%) | 0.28 |
| Other medications | ||||||
| β Blockers | 100 (44%) | 122 (32%) | 0.005 | 43 (37%) | 100 (22%) | 0.001 |
| Angiotensin-converting enzyme inhibitors/angiotensin II receptor blockers | 149 (65%) | 167 (44%) | <0.0001 | 63 (54%) | 198 (44%) | 0.046 |
| Nitrates | 86 (38%) | 150 (40%) | 0.62 | 44 (38%) | 160 (35%) | 0.62 |
| Calcium channel blockers | 135 (59%) | 222 (59%) | 0.93 | 50 (43%) | 233 (51%) | 0.10 |
| Nicorandil | 61 (27%) | 115 (30%) | 0.33 | 36 (31%) | 115 (25%) | 0.23 |
| Warfarin | 26 (11%) | 68 (18%) | 0.03 | 17 (15%) | 70 (15%) | 0.82 |
| Proton pump inhibitors | 90 (39%) | 175 (46%) | 0.10 | 48 (41%) | 185 (41%) | 0.94 |
| H 2 blockers | 53 (23%) | 66 (17%) | 0.09 | 25 (21%) | 119 (26%) | 0.28 |
| Serum levels during follow-up ⁎ | ||||||
| Total cholesterol (mg/dl) | 174 ± 36.6 | 173 ± 39.6 | 0.88 | 163 ± 40.2 | 164 ± 37.6 | 0.98 |
| High-density lipoprotein cholesterol (mg/dl) | 48.0 ± 14.4 | 44.4 ± 12.9 | 0.03 | 46.1 ± 15.0 | 44.3 ± 13.2 | 0.34 |
| Triglyceride (mg/dl) | 128 (88–188) | 112 (85–156) | 0.1 | 126 (80–176) | 113 (83–162) | 0.60 |
| Low-density lipoprotein cholesterol (mg/dl) | 97.0 ± 30.3 | 103 ± 33.6 | 0.17 | 90.5 ± 33.4 | 93.3 ± 30.0 | 0.51 |
| Low-density lipoprotein cholesterol change (mg/dl) | −18.8 ± 42.6 | −7.7 ± 41.5 | 0.047 | −5.4 ± 30.7 | −1.7 ± 31.9 | 0.43 |
| Low-density lipoprotein cholesterol change (%) | −7.6 ± 41.1 | 0.004 ± 39.2 | 0.15 | −1.5 ± 33.2 | 4.6 ± 39.9 | 0.29 |
| Estimated glomerular filtration rate (ml/min/1.73 m 2 ) | 23.1 ± 12.2 | 22.6 ± 13.4 | 0.67 | Not applicable | Not applicable | |
| Estimated glomerular filtration rate change (ml/min/1.73 m 2 ) | 1.1 ± 10.9 | 1.7 ± 11.4 | 0.56 | Not applicable | Not applicable | |
| Estimated glomerular filtration rate change/year (ml/min/1.73 m 2 ) | 3.6 ± 24.0 | 5.5 ± 29.2 | 0.47 | Not applicable | Not applicable | |
Stay updated, free articles. Join our Telegram channel

Full access? Get Clinical Tree


