Q waves have been shown to be a stronger prognostic marker than time from symptom onset to percutaneous coronary intervention (PCI) in ST-segment elevation myocardial infarction. We examined whether the relative importance of these 2 measurements is modulated by patient gender. Q waves in the area of ST-segment elevation on baseline electrocardiogram were evaluated at a central core laboratory in 4,530 patients with ST-segment elevation myocardial infarction (3,468 men and 1,062 women) without previous infarction and who underwent PCI in the Assessment of Pexelizumab in Acute Myocardial Infarction (APEX-AMI) trial. Women were older and had higher rates of diabetes, hypertension, Killip class >I, and lower creatinine clearance compared to men. Time from symptom onset to PCI >3 hours was associated with a trend toward worse 90-day mortality (adjusted hazard ratio 1.5, 95% confidence interval 0.9 to 2.2) in men but not in women (0.8, 0.5 to 1.4). In contrast, presence of Q waves on baseline electrocardiogram was associated with significantly higher 90-day mortality in men (adjusted hazard ratio 1.7, 95% confidence interval 1.0 to 2.7) and women (2.3, 1.2 to 4.2). In conclusion, in this gender-specific analysis, baseline Q wave was found be a better marker of risk of 90-day mortality than time from symptom onset to PCI, overall, and especially in women.
Assessing time of symptom onset may be more complicated for women with ST-segment elevation myocardial infarction (STEMI) given their higher likelihood of developing atypical and prodromal symptoms. Therefore, a more objective measurement of the evolution of the infarct would be particularly useful in assessing risk and informing treatment decisions in these patients. One such measurement is the presence of Q wave on baseline electrocardiogram (ECG). We extended our previous analysis in the Assessment of Pexelizumab in Acute Myocardial Infarction (APEX-AMI) trial to examine the relative prognostic significance of time from symptom onset to percutaneous coronary intervention (PCI) and presence of Q waves on baseline ECG on 90-day outcomes of death and the composite of death/congestive heart failure (CHF)/cardiogenic shock.
Methods
The APEX-AMI trial was a multicenter, randomized, double-blinded, placebo-controlled trial of intravenous pexelizumab administered immediately before primary PCI for patients with electrocardiographically high-risk STEMI. Study end points were 90-day mortality and the composite of death, centrally adjudicated CHF, or cardiogenic shock at 90 days. Because no significant difference was observed in the primary end point between the treatment and placebo arms, the 2 arms were pooled for the present analysis.
In total 5,745 patients were enrolled in the APEX-AMI trial according to the following specific entry criteria described previously: briefly, patients were ≥18 years old, with symptom onset <6 hours, and had an ECG indicative of acute STEMI that fulfilled any of the following 3 criteria: ≥2-mm STE in 2 anterior or lateral leads, or ≥2-mm STE in 2 inferior leads coupled with ST-segment depression in 2 contiguous anterior leads for a total ST-segment deviation of ≥8 mm, or new left bundle branch block with ≥1-mm concordant STE. For the present analysis, patients with previous MI were excluded to remove any potential confounding of Q-wave ascertainment during the acute index event.
All baseline ECGs were evaluated centrally at electrocardiographic core laboratories (Canadian VIGOUR Centre, Edmonton, Alberta, Canada; Duke Clinical Research Institute, Durham, North Carolina) without knowledge of treatment assignment and outcomes. Q wave or Q-wave equivalent was determined on baseline ECG using the Selvester QRS screening criteria: Q wave ≥30 ms in lead aVF (inferior), ≥40 ms in leads I and aVL (lateral), ≥40 ms in ≥2 of leads V 4 , V 5 , and/or V6 (apical), or any Q wave in lead V 2 (anterior). Further, Q-wave equivalents were defined as an R wave ≥40 ms in lead V 1 (posterior) or an R wave ≤0.1 mV and <10 ms in lead V 2 (anterior).
Descriptive statistics were reported as percentages for categorical variables with comparisons made using chi square tests. Medians with 25th and 75th percentiles and Mann Whitney U tests are reported for continuous variables. Time from symptom onset to PCI was considered a dichotomous variable with 3 hours as the cut point (to correspond to current American College of Cardiology/American Heart Association guidelines, ≤3 vs >3 hours).
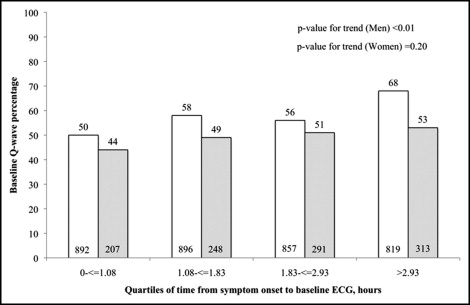
The relation between time from symptom onset to baseline ECG and presence of Q waves was examined in men and women. Chi-square tests for trend were used to examine whether the frequency of Q waves differed across quartiles of time from symptom onset to baseline ECG.
Interaction tests were performed to determine whether the association of time from symptom onset to PCI and of baseline Q waves with clinical outcomes differed significantly in men and women. Gender-specific unadjusted associations between time from symptom onset to PCI and clinical outcomes of interest (i.e., 30-day death, 30-day death/CHF/shock, 90-day death, and 90-day death/CHF/shock) were examined using chi-square or log-rank tests as appropriate. Similarly, gender-specific relations between baseline Q waves and these outcomes were also examined. These associations with mortality were then adjusted for baseline variables using a previously developed mortality model that included age, systolic blood pressure, heart rate, Killip class, MI location, serum creatinine, and baseline ΣST-segment deviation. For the composite of death/CHF/shock, covariates included age, hypertension, systolic blood pressure, heart rate, Killip class, MI location, serum creatinine, and baseline ΣST-segment deviation. Unadjusted and adjusted hazard ratios and corresponding 95% confidence intervals are reported.
All tests were 2-sided with a 5% level of significance. All analyses were performed with SAS 9.1.3 (SAS Institute, Cary, North Carolina).
Results
Of 5,745 patients enrolled in the APEX-AMI trial, 559 patients were excluded because they had missing (n = 12) or noninterpretable (n = 206) ECGs or did not undergo primary PCI (n = 341). An additional 656 patients were excluded because of previous MI and/or Q waves outside the acute MI territory. Patient characteristics of the 4,530 men and women retained for analysis by baseline Q-wave status and time from symptom onset to PCI are presented in Table 1 . Men and women presenting with Q waves were older, had higher rates of Killip class >I, and were less likely to have inferior MI. Similarly, men and women with time from symptom onset to PCI >3 hours were older and had higher rates of diabetes and hypertension. A smaller percentage of women received PCI ≤3 hours from symptom onset (33%) compared to men (43%, p <0.01; Table 2 ). Frequency of Q waves was also significantly lower in women (50%) than in men (57%, p <0.01). Time from symptom onset to ECG was significantly longer in patients with Q waves and there was no significant difference in time from ECG to PCI in patients with and without baseline Q waves.
| Variable | Men | Women | Men | Women | ||||
|---|---|---|---|---|---|---|---|---|
| No Q Wave (n = 1,483) | Q Wave (n = 1,985) | No Q Wave (n = 533) | Q Wave (n = 529) | Sx to PCI ≤3 Hours (n = 1,475) | Sx to PCI >3 Hours (n = 1,993) | Sx to PCI ≤3 Hours (n = 355) | Sx to PCI >3 Hours (n = 707) | |
| Age (years) | 58 (50–67) | 60 (52–69) ⁎ | 67 (56–75) | 69 (58–78) ⁎ | 58 (50–66) | 60 (52–69) ⁎ | 66 (55–76) | 68 (58–77) |
| Diabetes mellitus | 10.9% | 14.5% ⁎ | 16.3% | 20.2% | 11.1% | 14.4% ⁎ | 15.8% | 19.5% |
| Hypertension | 41.4% | 43.6% | 58.0% | 59.4% | 37.8% | 46.3% ⁎ | 54.7% | 60.7% |
| Heart rate (beats/min) | 72 (62–83) | 76 (65–88) ⁎ | 73 (64–85) | 77 (67–88) ⁎ | 74 (63–84) | 75 (65–86) ⁎ | 74 (65–85) | 76 (66–88) ⁎ |
| Systolic blood pressure (mm Hg) | 132 (117–150) | 135 (120–150) | 130 (114–150) | 132 (118–150) ⁎ | 131 (117–148) | 135 (120–151) ⁎ | 130 (110–148) | 135 (120–152) ⁎ |
| Killip class >I | 7.1% | 9.6% ⁎ | 10.3% | 16.3% ⁎ | 7.6% | 9.2% | 11.8% | 14.0% |
| Inferior myocardial infarction | 56.1% | 30.1% ⁎ | 59.6% | 26.3% ⁎ | 40.7% | 41.5% | 46.6% | 41.1% |
| Creatinine clearance (ml/min) | 89.9 (72–112) | 87.9 (69–112) ⁎ | 68.6 (51–91) | 67.6 (49–88) | 91.9 (74–113) | 86.1 (69–112) ⁎ | 68.1 (49–92) | 67.8 (52–89) |
⁎ Significant at p <0.05 based on chi-square tests for categorical variables and nonparametric Mann–Whitney U test for continuous variables.
| Variable | Men | Women | Men | Women | ||||
|---|---|---|---|---|---|---|---|---|
| No Q Wave (n = 1,483) | Q Wave (n = 1,985) | No Q Wave (n = 533) | Q Wave (n = 529) | Sx to PCI ≤3 Hours (n = 1,475) | Sx to PCI >3 Hours (n = 1,993) | Sx to PCI ≤3 Hours (n = 355) | Sx to PCI >3 Hours (n = 707) | |
| Time from symptom onset to baseline electrocardiogram (hours) | 1.57 (1.0–2.5) | 1.90 (1.2–3.1) ⁎ | 1.99 (1.1–3.0) | 2.18 (1.3–3.3) ⁎ | 1.07 (0.7–1.47) | 2.60 (1.9–3.6) ⁎ | 1.10 (0.7–1.5) | 2.73 (2.0–3.8) ⁎ |
| Time from hospital arrival to baseline electrocardiogram (minutes) | 5 (0–19) | 7 (0–23) ⁎ | 7 (0–28) | 8 (0–31) | 4 (0–13) | 9 (0–31) ⁎ | 5 (0–16) | 9 (0–39) ⁎ |
| Time from baseline electrocardiogram to percutaneous coronary intervention (hours) | 1.38 (1–1.9) | 1.35 (1.0–1.8) | 1.38 (1–1.9) | 1.45 (1.0–2.0) | 1.16 (0.9–1.5) | 1.58 (1.1–2.1) ⁎ | 1.15 (0.9–1.5) | 1.55 (1.1–2.2) ⁎ |
| Time from symptom onset to percutaneous coronary intervention (hours) | 3.03 (2.3–4.0) | 3.25 (2.5–4.3) ⁎ | 3.33 (2.5–4.3) | 3.52 (2.8–4.5) ⁎ | 2.37 (1.9–2.7) | 4.07 (3.5–4.9) ⁎ | 2.42 (2.0–2.7) | 4.15 (3.5–4.9) ⁎ |
| Time from symptom onset to percutaneous coronary intervention ≤3 hours | 52.9% | 60.9% ⁎ | 64.2% | 69.0% | 100% | 0% | 100% | 0% |
| Baseline ΣST-segment deviation (mm) | 13 (9.5–18) | 14.5 (10.5–21) ⁎ | 12.5 (9–17.5) | 13 (9–18.5) | 14 (10–20.5) | 13.8 (9.5–19.5) ⁎ | 12.8 (9–18.5) | 13 (9–17.5) |
| Q wave | 0% | 100% | 0% | 100% | 52.6% | 60.7% ⁎ | 46.2% | 51.6% |
⁎ Significant at p <0.05 based on chi-square tests for categorical variables and nonparametric Mann–Whitney U test for continuous variables.
The relation between time from symptom onset to ECG and presence of Q waves in men and women is described in Figure 1 . Percent Q waves increased with increasing time from symptom onset to ECG in men and women. However, the gradient of the incline was steeper and statistically significant in men but flatter and nonsignificant in women.