Vitamin D and parathyroid hormone (PTH) may affect cardiovascular health in patients with kidney disease and in the general population. The aim of this study was to investigate associations of serum 25-hydroxyvitamin D (25(OH)D) and PTH concentrations with a comprehensive set of biochemical, electrocardiographic, and echocardiographic measurements of cardiac structure and function in the Cardiovascular Health Study. A total of 2,312 subjects who were free of cardiovascular disease at baseline were studied. Serum 25(OH)D and intact PTH concentrations were measured using mass spectrometry and a 2-site immunoassay. Outcomes were N-terminal pro-B-type natriuretic peptide, cardiac troponin T, electrocardiographic measures of conduction, and echocardiographic measures of left ventricular mass and diastolic dysfunction. At baseline, subjects had a mean age of 73.9 ± 4.9 years, 69.7% were women, and 21% had chronic kidney disease (glomerular filtration rate <60 ml/min). Mean 25(OH)D was 25.2 ± 10.2 ng/ml, and median PTH was 51 pg/ml (range 39 to 65). After adjustment, 25(OH)D was not associated with any of the biochemical, conduction, or echocardiographic outcomes. Serum PTH levels ≥65 pg/ml were associated with greater N-terminal pro-B-type natriuretic peptide, cardiac troponin T, and left ventricular mass in patients with chronic kidney disease. The regression coefficients were: 120 pg/ml (95% confidence interval 36.1 to 204), 5.2 pg/ml (95% confidence interval 3.0 to 7.4), and 17 g (95% confidence interval 6.2 to 27.8) (p <0.001). In subjects with normal kidney function, PTH was not associated with the outcomes. In conclusion, in older adults with chronic kidney disease, PTH excess is associated with higher N-terminal pro-B-type natriuretic peptide, cardiac troponin T, and left ventricular mass. These findings suggest a role for PTH in cardiovascular health and the prevention of cardiac diseases.
Insufficient vitamin D and excess of parathyroid hormone (PTH), beyond their effects on calcium homeostasis and bone mineralization, are associated with higher risk for cardiovascular diseases. The Ludwigshafen Risk and Cardiovascular Health (LURIC) study, a large cohort of patients referred for angiography, showed an independent association between 25-hydroxyvitamin D (25(OH)D) and an upregulated circulating renin-angiotensin system. This implies that 25(OH)D might have antihypertensive and tissue-protective properties, attributed to the inhibition of renin synthesis. We previously measured serum 25(OH)D and PTH levels in 2,312 subjects from the Cardiovascular Health Study (CHS) who were free of clinical cardiovascular disease. In this community-based sample, lower serum 25(OH)D levels were associated with incident myocardial infarction, and higher PTH levels were associated with incident heart failure during 14 years of follow-up. Given these associations with cardiovascular events, in this study, we investigated relations of 25(OH)D and PTH with biochemical, electrocardiographic, and structural measurements of cardiac function.
Methods
The CHS is a prospective, community-based, multicenter cohort study of determinants of cardiovascular risk and prognosis among older adults. In 1989 and 1990, the CHS enrolled 5,201 ambulatory men and women aged ≥65 years from Medicare eligibility lists in Forsyth County, North Carolina (latitude 36°6′ north); Sacramento County, California (latitude 38°35′ north); Washington County, Maryland (latitude 39°38′ north); and Pittsburgh, Pennsylvania (latitude 40°27′ north). The CHS enrolled an additional 687 African American subjects in 1992 and 1993. The investigation conforms with the principles outlined in the Declaration of Helsinki. Each center’s institutional review committee approved the study, and all subjects gave written informed consent.
For analyses of cardiac biomarkers, we evaluated the sample of 2,312 CHS subjects who were free of clinical cardiovascular disease at the time of their 1992 to 1993 examinations and had available serum measurements of 25(OH)D, PTH, and cardiac biomarkers. For analyses of electrocardiographic measurements we further excluded 22 subjects who did not undergo electrocardiography at their 1992 to 1993 study visits, which resulted in 2,290 subjects with electrocardiographic conduction measurements.
Between the 1992 to 1993 and 1994 to 1995 CHS exams, 96 subjects died. An additional 300 subjects did not complete echocardiographic measurements as part of the 1994 to 1995 examination, and an additional 495 did not complete echocardiographic measurements to calculate left ventricular (LV) mass. Final sample sizes for Doppler and LV mass measurements were 1,575 and 1,399, respectively. Subjects who did not complete electrocardiographic and echocardiographic measurements were older (74.8 vs 73.4 years) and more likely to be men (37% vs 25%).
All measurements were performed on serum samples stored at −70°C and thawed just before testing (maximum of 3 freeze-thaw cycles). The University of Washington Clinical Nutrition Research Unit performed total 25(OH)D measurements from serum collected during the 1992 to 1993 CHS exams using high-performance liquid chromatography and tandem mass spectrometry on a Waters Quattro micro mass spectrometer (Waters, Milford, Massachusetts). The interassay coefficient of variation was <3.4%. Intact serum PTH was quantified using a 2-site immunoassay on a Beckman UniCel DxI clinical analyzer (Beckman Coulter, Brea, California). The interassay coefficient of variation for PTH was 4.5% at 37 pg/ml. Serum nonionized total calcium levels were measured using indirect potentiometry. Serum phosphorus levels were measured using a timed-rate colorimetric reaction method with ammonium molybdate on a Beckman DxC Synchron analyzer (Beckman Coulter).
Serum N-terminal pro-B-type natriuretic peptide (NT-proBNP) was measured in 2008, and cardiac troponin T (cTnT) was measured in 2010 on the Elecsys 2010 system (Roche Diagnostics, Indianapolis, Indiana). Serum cTnT concentrations were measured with highly sensitive cTnT reagents, and the analytic measurement range was 3 to 10,000 pg/ml. The coefficient of variation for the NT-proBNP interassay was 2% to 5% during the testing period, and the analytic measurement range was 5 to 35,000 pg/ml.
Standardized rest 12-lead electrocardiography was performed with the patient in the supine position, and results were processed using the Marquette 12SL electrocardiographic analysis program (GEMS-IT, Milwaukee, Wisconsin), which clusters QRS-T complexes from a 10-second recording of 8 independent simultaneous electrocardiographic leads.
Echocardiographic images were obtained using a standardized protocol and recorded onto S-VHS tape using a Toshiba SSH-160A cardiac ultrasound machine. The core reading center for the echocardiograms was located at Georgetown University (Washington, District of Columbia). The methods for 2-dimensional, Doppler, and M-mode transthoracic echocardiography in the CHS have been previously described. Data were evaluated at a centralized echocardiography center by readers blinded to the subjects’ clinical information. Quality control measures included standardized training on echocardiography for technicians and readers, observation of technicians by a trained echocardiographer, and periodic blind duplicate readings.
LV mass was estimated using M-mode echocardiography. The LV outflow tract velocity-time integral and diastolic flow measures, such as mitral early (E) and late (A) wave peak velocities, were assessed using 2-dimensional directed Doppler echocardiography. Fractional shortening at the endocardium and midwall was calculated from M-mode measurements.
Trained CHS study personnel conducted standardized interviews at the 1992 to 1993 visit, which queried demographics, health status, smoking status, and alcohol use. CHS study personnel assessed prescription and over-the-counter medication use, including vitamin D supplements, by instructing subjects to bring in all of their medications and directly transcribing the medication bottle labels. Blood pressure was measured in triplicate 5 minutes apart with the participant seated, and phlebotomy was performed under fasting conditions. Diabetes was defined as a fasting glucose level 7.0 mmol/L or the use of insulin or an oral hypoglycemic medication. Hypertension was categorized as present if seated systolic blood pressure was ≥140 mm Hg or diastolic blood pressure was ≥90 mm Hg or the patient self-reported a history of hypertension in combination with use of antihypertensive medication. The Laboratory for Clinical Biochemistry Research analyzed blood specimens for albumin, total and high-density lipoprotein cholesterol, creatinine, and C-reactive protein levels. We calculated estimated glomerular filtration rate (GFR) according to the Chronic Kidney Disease–Epidemiology formula. We defined chronic kidney disease (CKD) as a GFR <60 ml/min.
We analyzed 25(OH)D concentrations according to previously published categories used in the CHS: >30, 15 to ≤30, and <15 ng/ml. Serum 25(OH)D concentration was categorized using a threshold of 15 ng/ml because 25(OH)D concentrations below this level are associated with increased risk for incident cardiovascular events.
We examined serum PTH concentrations dichotomously as <65 versus ≥65 pg/ml because functional analyses revealed threshold associations of serum PTH levels >65 pg/ml with study outcomes. We defined primary hyperparathyroidism as a serum PTH level ≥65 pg/ml plus a serum calcium level >10.2 mg/dl, as previously published.
We constructed linear regression models to estimate regression coefficients for associations of 25(OH)D and PTH with biochemical, electrocardiographic, and echocardiographic measurements after adjustment for potential confounding variables. A basic model included 25(OH)D or PTH as the exposure variable and was adjusted for age, race, gender, season of the year, clinic site, height, and weight. A second model included established cardiovascular risk factors: type 2 diabetes, smoking, education, physical activity, systolic blood pressure, antihypertensive medication, and C-reactive protein. In the case of PTH, model 2 was also adjusted for total 25(OH)D, because vitamin D deficiency is a known risk factor for hyperparathyroidism. A third model added estimated GFR to describe separately the influence of adjustment for kidney function.
We used the likelihood ratio test to investigate potential interactions of CKD status on associations of 25(OH)D and PTH with study outcomes. For statistically significant interactions, we present separate results for subjects who had and did not have CKD. All reported intervals are 95% confidence intervals, and all p values are 2 sided. We conducted analyses using SPSS version 19.0 (SPSS, Inc., Chicago, Illinois).
Results
At baseline, subjects had a mean age of 74 ± 4.9 years, 70% were women, and 21% had CKD. Mean serum 25(OH)D was 25 ± 10 ng/ml. The prevalence of vitamin D deficiency (<15 ng/ml) was 17%, and that of insufficiency (15 to 30 ng/ml) was 54%. Lower serum 25(OH)D concentrations were related to African American race, female gender, measurement during winter months, prevalent diabetes, current smoking, higher body mass index, lesser physical activity, higher systolic blood pressure, and higher serum C-reactive protein levels ( Table 1 ).
| Variable | Serum 25(OH)D (ng/ml) | Serum PTH (pg/ml) | |||
|---|---|---|---|---|---|
| >30 | 15–30 | <15 | <65 | ≥65 | |
| Number of participants | 681 (29%) | 1,247 (54%) | 384 (17%) | 1,742 (75%) | 570 (25%) |
| Age (years) | 73 ± 4 | 74 ± 5 | 74 ± 6 | 74 ± 5 | 75 ± 6 |
| Women | 394 (58%) | 912 (73%) | 305 (79%) | 1,187 (68%) | 424 (74%) |
| African Americans | 30 (4%) | 160 (13%) | 142 (37%) | 226 (13%) | 107 (19%) |
| Season | |||||
| Winter | 112 (16%) | 303 (24%) | 169 (44%) | 413 (24%) | 171 (30%) |
| Spring | 109 (16%) | 302 (24%) | 118 (31%) | 386 (22%) | 143 (25%) |
| Summer | 286 (42%) | 339 (27%) | 45 (12%) | 538 (31%) | 132 (23%) |
| Autumn | 174 (26%) | 303 (25%) | 52 (13%) | 405 (23%) | 124 (22%) |
| Study site | |||||
| Forsyth County, North Carolina | 195 (29%) | 387 (31%) | 103 (27%) | 513 (30%) | 172 (30%) |
| Sacramento County, California | 199 (29%) | 264 (21%) | 94 (24%) | 390 (22%) | 167 (29%) |
| Washington County, Maryland | 152 (22%) | 334 (27%) | 76 (20%) | 449 (26%) | 113 (20%) |
| Pittsburgh, Pennsylvania | 135 (20%) | 262 (21%) | 111 (29%) | 390 (22%) | 118 (21%) |
| Education level | |||||
| Low | 73 (11%) | 207 (17%) | 87 (23%) | 262 (15%) | 105 (18%) |
| Intermediate | 256 (38) | 469 (38%) | 145 (38%) | 654 (38%) | 216 (38%) |
| High | 349 (51%) | 569 (45%) | 151 (39%) | 823 (47%) | 246 (44%) |
| Type 2 diabetes (%) | 55 (8%) | 134 (11%) | 76 (20%) | 196 (11%) | 69 (12%) |
| Cigarette smokers (%) | 54 (8%) | 116 (10%) | 58 (16%) | 180 (10%) | 48 (9%) |
| Physical activity (kcal/week) | 2,479 ± 2,421 | 1,772 ± 1,911 | 1,243 ± 1,676 | 1,964 ± 2,111 | 1,672 ± 1,978 |
| Body mass index (kg/m 2 ) | 25.5 ± 3.9 | 27.1 ± 4.8 | 27.9 ± 5.5 | 26.4 ± 4.5 | 27.8 ± 5.4 |
| Systolic blood pressure (mm Hg) | 132 ± 20 | 135 ± 21 | 139 ± 21 | 133 ± 20 | 139 ± 23 |
| Diastolic blood pressure (mm Hg) | 70 ± 11 | 71 ± 11 | 72 ± 11 | 70 ± 11 | 73 ± 12 |
| Serum measurements | |||||
| 25(OH)D (ng/ml) | 37 ± 8 | 23 ± 4 | 11 ± 3 | 27 ± 10 | 21 ± 9 |
| PTH (pg/ml) | 49 ± 27 | 57 ± 26 | 71 ± 39 | 44 ± 12 | 94 ± 37 |
| Calcium (mg/dl) | 9.5 ± 0.3 | 9.5 ± 0.4 | 9.5 ± 0.4 | 9.5 ± 0.4 | 9.5 ± 0.4 |
| Phosphorus (mg/dl) | 3.6 ± 0.5 | 3.6 ± 0.5 | 3.6 ± 0.5 | 3.6 ± 0.5 | 3.5 ± 0.5 |
| Total cholesterol (mg/dl) | 210 ± 37 | 211 ± 35 | 212 ± 39 | 210 ± 36 | 214 ± 39 |
| High-density lipoprotein cholesterol (mg/dl) | 57 ± 16 | 55 ± 14 | 56 ± 14 | 56 ± 15 | 54 ± 14 |
| Estimated GFR (ml/min/1.73 m 2 ) | 71 ± 15 | 74 ± 16 | 74 ± 17 | 74 ± 15 | 69 ± 18 |
| GFR <60 ml/min/1.73m 2 | 146 (21%) | 210 (17%) | 65 (17%) | 317 (18%) | 174 (31%) |
| Triglycerides (mg/dl) | 132 ± 71.1 | 137 ± 68.8 | 130 ± 64.2 | 132 ± 66.5 | 140 ± 75.0 |
| C-reactive protein (mg/L) | 3.6 ± 6.9 | 4.1 ± 7.4 | 5.7 ± 10.1 | 4.1 ± 7.9 | 4.5 ± 7.4 |
| Medication use | |||||
| Any antihypertensive agent | 252 (37%) | 486 (39%) | 187 (49%) | 663 (38%) | 262 (46%) |
| Thiazide diuretic agent | 56 (8%) | 131 (11%) | 53 (14%) | 183 (11%) | 57 (10%) |
| Loop diuretic agent | 15 (2%) | 45 (4%) | 16 (4%) | 39 (2%) | 37 (7%) |
| Vitamin D supplement | 10 (1.5%) | 0 (0%) | 0 (0%) | 8 (0.5) | 2 (0.4) |
| Calcium supplement | 7 (1.0%) | 9 (0.7%) | 2 (0.5%) | 16 (0.9) | 2 (0.4) |
Serum PTH levels showed a distribution skewed to the right, with a median value of 51 pg/ml (interquartile range 39 to 65). The proportion of subjects with PTH levels ≥65 pg/ml was 25%. Higher serum PTH concentrations were associated with African American race, female gender, higher systolic blood pressure, and lower estimated GFR. Serum phosphorus levels were slightly lower in subjects with serum PTH levels ≥65 pg/ml. Serum 25(OH)D concentrations were inversely correlated with serum PTH concentrations, especially for values of 25(OH)D <20 ng/ml.
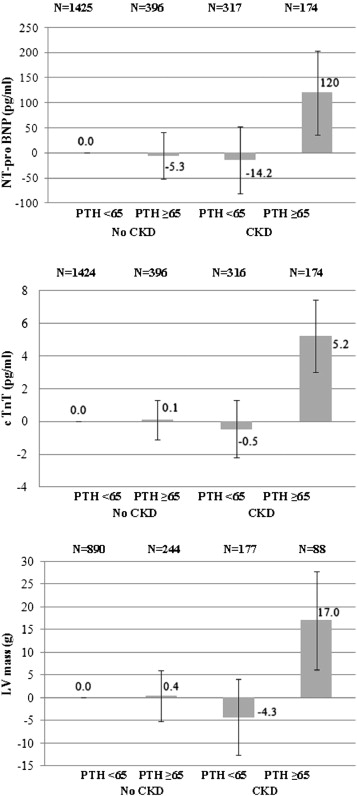
In unadjusted analyses, lower serum 25(OH)D levels were associated with higher NT-proBNP concentrations but not with cTnT ( Table 2 ). Associations of 25(OH)D with NT-proBNP were removed by adjustment for demographics and traditional cardiovascular risk factors. In contrast, higher serum PTH levels remained associated with NT-proBNP and cTnT in analyses adjusted for demographic, cardiovascular risk factor, and estimated GFR. We detected a significant interaction of estimated kidney function on associations of PTH levels with cardiac biomarkers (p for interaction <0.001), with substantially stronger associations in patients with CKD ( Figure 1 ).
| Variable | n | Mean Value | Model 1 ∗ | Model 2 † | Model 3 ‡ |
|---|---|---|---|---|---|
| NT-proBNP (pg/ml) | |||||
| 25(OH)D >30 ng/ml | 681 | 194 ± 304 | Reference | Reference | Reference |
| 25(OH)D 15–30 ng/ml | 1,247 | 192 ± 305 | −5.9 (−45.9 to 34.1) | −17.2 (−77.5 to 43.1) | −9.3 (−69.1 to 50.6) |
| 25(OH)D <15 ng/ml | 384 | 273 ± 783 | 67.2 (10.2 to 124) | 39.0 (−59.4 to 137) | 44.1 (−53.5 to 142) |
| p value for trend | 0.011 | 0.061 | 0.446 | 0.382 | |
| PTH <65 pg/ml | 1,742 | 186 ± 391 | Reference | Reference | Reference |
| PTH ≥65 pg/ml | 570 | 267 ± 509 | 56.1 (16.1 to 96.1) | 48.0 (7.4 to 88.7) | 31.7 (−9.0 to 72.4) |
| p value | <0.001 | 0.006 | 0.021 | 0.127 | |
| cTnT (pg/ml) | |||||
| 25(OH)D >30 ng/ml | 680 | 7.5 ± 12.3 | Reference | Reference | Reference |
| 25(OH)D 15–30 ng/ml | 1,246 | 7.7 ± 11.0 | 0.1 (−0.9 to 1.2) | 0.1 (−1.1 to 1.1) | 0.5 (−0.5 to 1.6) |
| 25(OH)D <15 ng/ml | 384 | 8.1 ± 9.9 | 0.3 (−1.2 to 1.8) | −0.2 (−1.8 to 1.3) | 0.4 (−1.1 to 1.9) |
| p value for trend | 0.333 | 0.698 | 0.803 | 0.491 | |
| PTH <65 pg/ml | 1,740 | 7.0 ± 8.1 | Reference | Reference | Reference |
| PTH ≥65 pg/ml | 570 | 9.8 ± 17.5 | 2.3 (1.2 to 3.3) | 2.2 (1.1 to 3.3) | 1.6 (0.5 to 2.6) |
| p value | <0.001 | <0.001 | <0.001 | 0.004 | |
∗ Adjusted for age, race, gender, season of the year, clinic site, height, and weight.
† Adjusted for model 1 covariates plus type 2 diabetes, kilocalories of physical activity, education, smoking status, antihypertensive medication, systolic blood pressure, C-reactive protein, and vitamin D (for PTH models).
‡ Adjusted for model 2 covariates plus estimated GFR creatinine (Chronic Kidney Disease–Epidemiology formula).
Neither 25(OH)D nor PTH levels were associated with electrocardiographic measures of atrioventricular or ventricular conduction ( Table 3 ). Adjustment for demographic characteristics did not alter these negative findings. There was no significant effect modification by estimated kidney function (p >0.115) on associations of 25(OH)D and PTH and the electrocardiographic markers.
| Variable | n | Mean Value | Model 1 ∗ |
|---|---|---|---|
| Atrioventricular conduction PR (ms) | |||
| 25(OH)D >30 ng/ml | 679 | 170 ± 29.4 | Reference |
| 25(OH)D 15–30 ng/ml | 1,240 | 171 ± 29.2 | −1.2 (−1.6 to 4.0) |
| 25(OH)D <15 ng/ml | 371 | 168 ± 28.8 | −1.9 (−5.9 to 2.1) |
| p value for trend | 0.503 | 0.583 | |
| PTH <65 pg/ml | 1,727 | 170 ± 29.0 | Reference |
| PTH ≥65 pg/ml | 563 | 171 ± 29.6 | −0.1 (−3.0 to 2.7) |
| p value | 0.421 | 0.272 | |
| Ventricular conduction QRS (ms) | |||
| 25(OH)D >30 ng/ml | 679 | 91.9 ± 15.8 | Reference |
| 25(OH)D 15–30 ng/ml | 1,240 | 91.4 ± 16.8 | 0.4 (−1.2 to 1.9) |
| 25(OH)D <15 ng/ml | 371 | 91.0 ± 17.5 | 0.9 (−1.4 to 3.1) |
| p value for trend | 0.555 | 0.455 | |
| PTH <65 pg/ml | 1,727 | 91.4 ± 16.3 | Reference |
| PTH ≥65 pg/ml | 563 | 91.9 ± 17.6 | 0.5 (−1.1 to 2.0) |
| p value | 0.534 | 0.563 | |
Stay updated, free articles. Join our Telegram channel

Full access? Get Clinical Tree


