Low and high ankle brachial index (ABI) values are both a marker of peripheral arterial disease and associated with greater cardiovascular disease event rates. The objective of the present study was to determine whether the ABI is associated with left ventricular (LV) systolic function. We studied 175 patients (age 67 ± 13 years, 58% men) referred for ABI determination who had had the LV ejection fraction (EF) determined using echocardiography within 14 days. The mean LVEF was 47 ± 13%, mean ABI for the right leg was 0.93 ± 0.32, and the mean ABI for the left leg was 0.94 ± 0.26. Of the 175 patients, 91 (52%) had a low, 69 (39%) had a normal, and 15 (9%) had a high ABI. The mean LVEF increased in a stepwise manner from the low, to normal, to abnormally high ABI groups (43 ± 13% vs 51 ± 12% vs 57 ± 5%, respectively; p <0.01). On ordinal regression analysis, ABI status was independently related to LVEF. For each 1% increase in LVEF, the odds of being in the higher category of ABI increased by 1.08 (95% confidence interval 1.02 to 1.12, p = 0.002). No significant interaction was seen between coronary artery disease and LVEF on the ABI (p = 0.48). In conclusion, the ABI might be influenced by LV systolic function, independent of coronary disease. LVEF should be considered when ABI values are used to evaluate and monitor cardiovascular risk in patients.
Peripheral arterial disease (PAD) is commonly assessed by the measurement of the ankle brachial systolic blood pressure index (ABI). The ABI is the ratio of Doppler- or sphygmomanometry-determined lower extremity blood pressure to brachial artery blood pressure. An ABI <0.9 in either lower extremity is considered evidence of PAD. Numerous studies have found low ABI values to be an independent predictor of cardiovascular events, including myocardial infarction, stroke, and mortality. Normal values generally range from 1.2 to 1.4. The ratio is >1.0 because the shape of the arterial waveform changes from the central aorta to the periphery, with the systolic blood pressure increasing at peripheral sites owing to arterial waveform reflection and summation. Because left ventricular (LV) systolic function has been shown to influence arterial wave reflective properties, we hypothesized the ABI would reflect LV systolic function, as well as atherosclerosis. The objective of the present study was to determine whether the ABI was related to the LV ejection fraction (EF) in an unselected group of patients referred to a community-based teaching hospital.
Methods
The institutional review board of Staten Island University Hospital approved the study. Each subject was assigned a study number, and all patient identifiers were omitted from the data collection. We retrospectively studied 175 consecutive patients who had been referred for ABI determination and had undergone transthoracic echocardiographic studies within 14 days without clinical events or a known change in clinical status.
After the participants had rested in the supine position for at least 10 minutes, the systolic ankle blood pressures were measured at the right and left brachial, dorsalis pedis, and posterior tibial arteries by trained technicians using a Doppler ultrasound instrument with an 8-MHz probe (Parks Flo-Lab 2100SX, Parks Medical Electronics, Aloha, Oregon). The right and left ABI values were calculated by dividing the right and the left ankle pressure by the greater of the 2 brachial systolic blood pressures. The greater of the dorsalis pedis and posterior tibial artery pressure was used. Participants were categorized as having a low ABI if either leg had an ABI of ≤0.9, having a high ABI if either leg had an ABI of ≥1.40, and having a normal ABI if both legs had an ABI >0.9 but <1.40.
Clinical data were obtained from the vascular database and patient medical records. The clinical variables included age, body mass index, hyperlipidemia, diabetes mellitus, hypertension, current cigarette smoking, and known coronary artery disease (CAD), defined as previous documented myocardial infarction, abnormal stress test results, or >50% stenosis by coronary angiography. Hyperlipidemia, hypertension, and diabetes mellitus were defined as either a documented diagnosis obtained from chart review or current treatment with medication. Diabetes mellitus, hypertension, and hyperlipidemia were also considered present if a fasting glucose level of ≥126 mg/dl, blood pressure of ≥140/90 mm Hg, and a plasma cholesterol level of ≥240 mg/dl, respectively, had previously been documented. Coronary angiography data were available for 81 (46%) of the 175 subjects. In this patient subgroup, obstructive CAD was defined as stenosis in at least one vessel of ≥50%. Claudication symptoms or pain at rest related to PAD were defined as either present or absent.
Transthoracic echocardiography was performed using General Electric model Vivid 7 machines (GE-Vingmed, Horten, Norway) and interpreted by experienced echocardiographers. The LV dimensions were measured from M-mode images according to the American Society of Echocardiography standards. Two-dimensional images were used when the scanning axis was not perpendicular to the axis of the heart. The LVEFs were calculated using the Teichholz formula and were confirmed by visual inspection. A normal LVEF was defined as ≥50%. Analysis of variance was used for a comparison of means, and chi-square tests and Fisher’s exact test were used to compare frequencies. Ordinal logistic regression analysis was performed with ABI status (low, normal, high) as the dependent variable and LVEF, age, smoking, body mass index, hypertension, diabetes mellitus, hypercholesterolemia, CAD, and symptom status as independent variables. Statistical significance was set at p <0.05 for inclusion in the final model. Statistical analyses were performed using the Statistical Package for Social Sciences, version 16.0 (SPSS, Chicago, Illinois).
Results
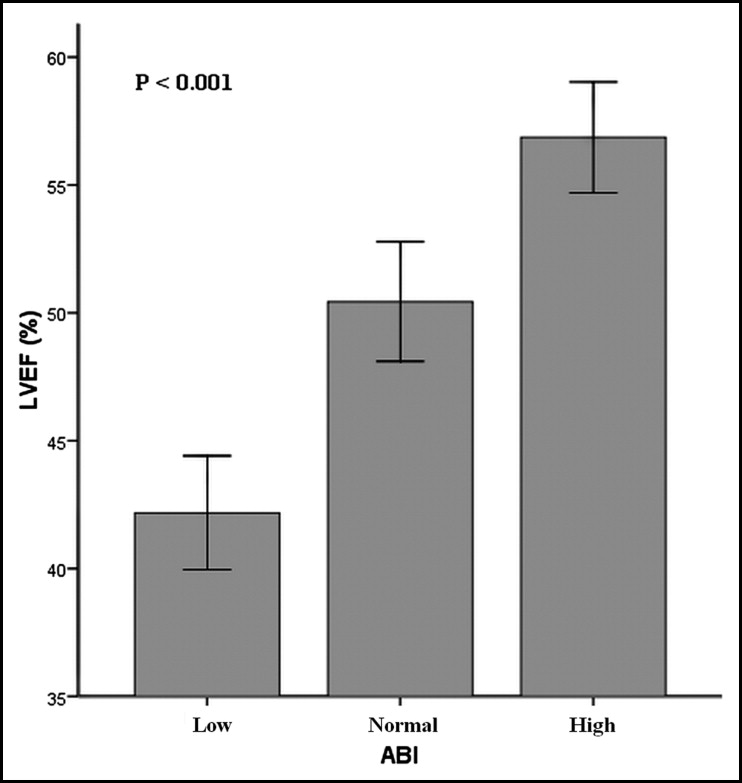
The patient characteristics are listed in Table 1 . We studied 175 patients (age 67 ± 13 years, 58% men). Of the 175 patients, 52% had a low ABI (≤0.9), 39% had a normal ABI, and 9% had a high ABI (≥0.40). The groups were similar, except for CAD history. No significant differences were found in the use of β blockers, diuretics, statins, calcium channel blockers, or angiotensin-converting enzyme inhibitors or angiotensinogen receptor blockers in the 3 ABI groups (p = NS). The mean right and left ABIs are listed in Table 1 . The groups significantly differed in the prevalence of a normal EF ( Table 1 ). For all patients, the ABI correlated significantly with the LVEF (r = 0.41, p <0.001), but not with age (r = −0.08, p = 0.31). The ABI correlated with LVEF in the patients with (r = 0.36, p = 0.001) and without (r = 0.36, p = 0.001) CAD. The mean LVEF increased in a stepwise manner from the low to normal to high ABI groups ( Table 1 and Figure 1 ). On ordinal regression analysis, after adjusting for age, body mass index, hypertension, cholesterol, diabetes mellitus, and smoking, ABI status was independently related to LVEF. For every 1% increase in LVEF, the odds of being in the higher category of ABI increased by 1.08 (95% confidence interval 1.02 to 1.12, p = 0.002). No significant interaction effect was seen between CAD history and LVEF on ABI (p = 0.48). In the angiographic subgroup, no interaction effect was found between CAD and LVEF on ABI (p = 0.39). Similarly, the ABI–LVEF relation was independent of PAD symptom status.
| Variable | Ankle Brachial Index | All (n = 175) | p Value | ||
|---|---|---|---|---|---|
| Low (n = 91) | Normal | High (n = 15) | |||
| Age (years) | 67 ± 13 | 66 ± 14 | 64 ± 11 | 67 ± 13 | 0.69 |
| Height (in.) | 66 ± 4 | 66 ± 4 | 66 ± 4 | 66 ± 4 | 0.99 |
| Weight (lb) | 171 ± 46 | 171 ± 52 | 178 ± 38 | 172 ± 48 | 0.87 |
| Body mass index (m/kg 2 ) | 27 ± 6 | 27 ± 6 | 28 ± 5 | 27 ± 6 | 0.76 |
| Women | 37% | 49% | 40% | 42% | 0.30 |
| Hypertension ⁎ | 70% | 61% | 80% | 67% | 0.25 |
| Diabetes mellitus † | 42% | 46% | 27% | 43% | 0.37 |
| Coronary artery disease ‡ | 64% | 38% | 40% | 51% | <0.01 |
| Hypercholesterolemia § | 46% | 41% | 47% | 44% | 0.76 |
| Ejection fraction | 43% ± 13% | 51% ± 12% | 57% ± 5% | 47% ± 13% | <0.01 |
| Prevalence of normal ejection fraction | 40% | 73% | 100% | 58% | <0.01 |
| No. of coronary arteries narrowed | 0.48 | ||||
| 0 | 12% | 15% | 25% | 15% | |
| 1 | 31% | 42% | 50% | 36% | |
| 2 | 7% | 12% | 13% | 9% | |
| 3 | 49% | 31% | 13% | 40% | |
| Ankle brachial index | |||||
| Right side | 0.71 ± 0.2 | 1.09 ± 0.1 | 1.45 ± 0.2 | 0.93 ± 0.3 | <0.01 |
| Left side | 0.77 ± 0.2 | 1.09 ± 0.1 | 1.25 ± 0.3 | 0.94 ± 0.3 | <0.01 |
| Current smoking | 54% | 46% | 57% | 52% | 0.32 |
| Heart rate (beats/min) | 83 ± 19 | 77 ± 16 | 83 ± 19 | 81 ± 18 | 0.09 |
⁎ Defined as either a documented diagnosis obtained from chart review or current treatment with medication or blood pressure of ≥140/90 mm Hg.
† Defined as either a documented diagnosis obtained from chart review or current treatment with medication or a fasting glucose level of ≥126 mg/dl.
‡ Defined as previous documented myocardial infarction, abnormal stress test results, or >50% stenosis by coronary angiography.
§ Defined as either a documented diagnosis obtained from chart review or current treatment with medication or a plasma cholesterol level of ≥240 mg/dl.