Systemic–to–pulmonary collateral arteries (SPCs) are common in patients with single-ventricle physiology, but their impact on clinical outcomes is unclear. The aim of this study was to use retrospective cardiac magnetic resonance data to determine the relation between SPC flow and palliative stage and clinical status in single-ventricle physiology. Of 116 patients, 78 were after Fontan operation (median age 19 years) and 38 were at an earlier palliative stage (median age 2 years). SPC flow was quantified as aortic flow minus total caval flow or total pulmonary vein flow minus total branch pulmonary artery flow. Median SPC flow/body surface area (BSA) was higher in the pre-Fontan group (1.06 vs 0.43 L/min/m 2 , p <0.0001) and decreased nonlinearly with increasing age after the Fontan operation (r 2 = 0.17, p <0.0001). In the Fontan group, patients in the highest quartile of SPC flow had larger ventricular end-diastolic volume/BSA (p <0.0001) and were older at the time of Fontan surgery (p = 0.04), but SPC flow/BSA was not associated with heart failure symptoms, atrial or ventricular arrhythmias, atrioventricular valve regurgitation, the ventricular ejection fraction, or peak oxygen consumption. In multivariate analysis of all patients (n = 116), higher SPC flow was independently associated with pre-Fontan status, unilateral branch pulmonary artery stenosis, a diagnosis of hypoplastic left-heart syndrome, and previous catheter occlusion of SPCs (model r 2 = 0.37, p <0.0001). In conclusion, in this cross-sectional study of single-ventricle patients, BSA-adjusted SPC flow was highest in pre-Fontan patients and decreased after the Fontan operation with minimal clinical correlates aside from ventricular dilation.
Systemic–to–pulmonary collateral arteries (SPCs) are common in patients with single-ventricle (SV) physiology, but their impact on clinical outcomes is unclear. Although some studies have postulated that SPC flow contributes to adverse outcomes such as abnormal ventricular mechanics, other reports have failed to show such associations. The lack of an accurate and readily applied technique to measure SPC flow in vivo has hindered research on this controversial topic. As a result, the amount of SPC flow and its clinical significance, time course, and optimal management in children with functional SVs remain unclear, with wide variation in management among centers. Recently, a cardiac magnetic resonance (CMR) technique for estimating SPC flow has been reported in small cohorts of young patients with functional SV. In the present study, we used CMR to quantify SPC flow in a cohort of functional SV patients and evaluated its relations with age, palliative stage, and clinical parameters.
Methods
A search of the CMR database at Children’s Hospital Boston identified all patients with functional SV physiology who underwent CMR studies from January 2003 to June 2011. Patients with a complete set of flow measurements allowing calculation of SPC flow were included. Patients were divided into 2 groups: (1) those who had undergone Fontan operations (the Fontan group) and (2) those who were at any palliative stage before the Fontan operation (the pre-Fontan group). Because the required flow measurements were not performed routinely in the pre-Fontan group before 2009, inclusion was restricted to the period from January 2009 through June 2011. For patients who underwent >1 CMR examination during the study period, the examination with the most complete data set and/or closest in time to exercise stress testing (EST) was used for primary analyses. Those with significant ferromagnetic image artifacts, Fontan baffle leaks or fenestration visible on CMR or echocardiography, or significant (>3 mm in diameter) systemic-to-pulmonary venous collateral vessels visible on CMR or x-ray angiography were excluded. The study was approved by the Scientific Review Committee of the Department of Cardiology and by the Children’s Hospital Boston Committee on Clinical Investigation.
Demographic and clinical data were abstracted from the medical records. Ventricular morphology was classified as left ventricular, right ventricular, or mixed (e.g., unbalanced atrioventricular canal). Ventricular type was classified as mixed if the 2 ventricles had an end-diastolic volume (EDV) larger than a z score of −4. Published normative data were used for calculation of z scores. Echocardiographic reports were reviewed, and the degree of atrioventricular valve regurgitation at the closest time to CMR was recorded.
CMR imaging was performed using 1.5-T whole-body scanners (Signa TwinSpeed, GE Healthcare, Milwaukee, Wisconsin; or Achieva, Philips Medical Systems, Best, The Netherlands). Electrocardiographically gated steady-state free precession cine magnetic resonance imaging in the vertical and horizontal ventricular long-axis planes and contiguous ventricular short-axis cine planes from the atrioventricular junction through the cardiac apex was performed. Ventricular volumes (indexed to body surface area [BSA]) and the ejection fraction were calculated using commercially available software (QMass MR; Medis, Leiden, The Netherlands) as previously described. In patients whose ventricular type was categorized as mixed, ventricular volumes were summed to calculate total EDV and end-systolic volume as previously described. Flow measurements were performed using an electrocardiographically gated through-plane cine phase-contrast magnetic resonance sequence. Target vessels included the ascending aorta, superior and inferior venae cavae, right and left pulmonary artery [PA] branches, and individual right and left pulmonary veins. Blood flow rates were calculated using commercially available software (QFlow; Medis). SPC flow was quantified using 1 or both of the following methods as previously described and indexed to BSA : method 1: SPC flow = ascending aortic flow − (superior vena cava flow + inferior vena cava flow); method 2: SPC flow = total pulmonary vein flow − (right PA flow + left PA flow).
Contrast-enhanced 3-dimensional magnetic resonance angiography was performed after intravenous injection of 0.2 mmol/kg of gadopentate dimeglumine (Magnevist; Berlex, Seattle, Washington). Multiplanar reformatting was used to measure the diameters of the PA branches in orthogonal planes. Branch PA stenosis was defined as fulfilling the following 2 criteria: (1) >50% narrowing relative to either a normal ipsilateral vessel segment or to the normal contralateral artery in cases in which there was diffuse hypoplasia and (2) <30% flow through the involved PA.
EST data were available only in the Fontan group, because most patients in the pre-Fontan group were too young to perform the test. Ramp cycle ergometry with assessment of gas exchange was performed to quantify percentage of predicted peak oxygen consumption for age and gender as previously described. Patients were referred for EST when clinically indicated, as determined by their primary cardiologists. Metabolic EST data were included if testing occurred within 1 year of the CMR study without intervening surgical or catheter intervention or change in clinical status and if the patient achieved maximal effort. A patient was considered to have reached maximal effort if he or she attained 1 or both of the following: respiratory exchange ratio ≥1.09 or 95% of predicted maximal heart rate. Patients with submaximal effort were excluded to avoid bias due to noncardiac factors.
When available, conventional x-ray angiographic images were analyzed to assign SPC grade if all the following conditions were met: (1) angiography within 3 months of CMR, (2) no transcatheter occlusion of SPCs or cardiac surgical procedure between catheterization and CMR, and (3) adequate-quality angiography to assess overall SPC burden. Qualitative angiographic SPC grade (1 = none or mild, 2 = moderate, 3 = severe) was assigned to each patient by a single observer (D.B.M.) blinded to CMR results using predefined criteria ( Table 1 ).
| Grade | Description |
|---|---|
| None/mild | None or faint opacification of PAs and/or pulmonary veins on aortography or subclavian artery angiography; ≤1 lobe in each lung |
| Moderate | Moderate opacification of PAs and/or pulmonary veins in both lungs on aortography or subclavian artery angiography; ≥1 lobe; vessels opacified after ≥2 cardiac cycles; extensive filling of PAs or pulmonary veins in a single lobe or lung; pulmonary vessels opacified within 1 to 2 cardiac cycles |
| Severe | Extensive filling of PAs and/or pulmonary veins on aortography in multiple lobes of both lungs; pulmonary vessels opacified within 1 to 2 cardiac cycles, usually from multiple systemic arterial sources |
Statistical analyses were performed using commercially available software (Stata version 10.0; StataCorp LP, College Station, Texas). To explore univariate associations of SPC flow/BSA, the pre-Fontan and Fontan groups were each divided into “low–SPC flow” and “high–SPC flow” categories using the group’s median SPC flow as the cutoff. In the Fontan group, comparisons were also made between patients in the lowest and highest quartiles for SPC flow. Unadjusted associations were assessed using Student’s t test, Wilcoxon’s rank-sum test, or Fisher’s exact test, as appropriate. Multivariate linear regression analysis with forward selection was used to assess the statistical significance of associations between SPC flow estimated by CMR and clinical variables. Variables demonstrating univariate associations with p values <0.10 qualified for inclusion in the multivariate model. In a subset of the pre-Fontan group, agreement between methods 1 and 2 for quantifying SPC flow was assessed using Bland-Altman analysis. For all analyses, statistical significance was evaluated with respect to a type 1 error probability threshold of 0.05.
Results
Of the 307 patients with SV physiology (264 Fontan and 43 pre-Fontan) who underwent CMR during the study period, 116 (78 Fontan and 38 pre-Fontan) had data sufficient to estimate SPC flow by CMR and were included in the study. All CMR studies were requested by the patients’ primary cardiologists for a variety of clinical indications, including but not limited to comprehensive evaluation before a bidirectional Glenn shunt, evaluation of the pulmonary vasculature, and quantification of ventricular size and function. Demographic and clinical characteristics of the study patients are listed in Tables 2 and 3 . In the Fontan group, patients included in the study were not different from those excluded with respect to their primary cardiac diagnoses, types of Fontan operations, and histories of superior cavopulmonary anastomosis before Fontan operation. However, the included subjects were slightly older (age 21.8 ± 10 vs 18.8 ± 10 years, p = 0.02), were more likely to have histories of atrial or ventricular arrhythmia (69% vs 48%, p = 0.001), and heart failure symptoms (27% vs 13%, p = 0.008). In the pre-Fontan group, the number of excluded subjects was too small to compare with included subjects.
| Variable | All Patients (n = 78) | SPC Flow (L/min/m 2 ) | p Value | |
|---|---|---|---|---|
| Low (<0.43) | High (≥0.43) | |||
| (n = 39) | (n = 39) | |||
| Age at enrollment (years) | 18.6 (5–53) | 21.1 (5–53) | 17.6 (5–37) | 0.09 |
| Female (%) | 28 (36%) | 15 (38%) | 13 (33%) | 0.63 |
| Time after Fontan surgery (years) | 15.9 ± 7 | 16.7 ± 6 | 14.1 ± 6 | 0.08 |
| Previous systemic-to-PA shunt | 61 (78%) | 32 (82%) | 29 (74%) | 0.4 |
| Previous Glenn shunt | 35 (45%) | 14 (36%) | 21 (54%) | 0.11 |
| Age at volume unloading surgery (years) | 0.8 (0.3–21) | 0.84 (0.5–20.6) | 0.75 (0.3–13.2) | 0.38 |
| Age at Fontan surgery (years) | 3.6 (1–40) | 3.9 (1–40) | 3.2 (1–20) | 0.36 |
| Previous catheter occlusion of SPCs | 10 (13%) | 3 (8%) | 7 (18%) | 0.18 |
| Anatomic diagnosis | 0.36 | |||
| Tricuspid atresia | 26 (33%) | 9 (23%) | 17 (44%) | |
| Double-outlet right ventricle | 18 (23%) | 9 (23%) | 9 (23%) | |
| HLHS | 12 (15%) | 7 (18%) | 5 (13%) | |
| L-loop transposition of the great arteries or double-outlet right ventricle with pulmonary stenosis/atresia | 7 (9%) | 4 (10%) | 3 (8%) | |
| Double-inlet left ventricle | 6 (8%) | 5 (13%) | 1 (3%) | |
| Hypoplastic tricuspid valve/right ventricle | 4 (5%) | 2 (5%) | 2 (5%) | |
| Pulmonary atresia, intact ventricular septum | 3 (4%) | 1 (3%) | 2 (5%) | |
| Unbalanced atrioventricular canal | 2 (3%) | 2 (3%) | — | |
| Type of Fontan operation | 0.33 | |||
| Lateral tunnel | 50 (64%) | 25 (64%) | 25 (64%) | |
| Right atrium to PA | 22 (28%) | 13 (33%) | 9 (23%) | |
| Right atrium–to–right ventricle conduit | 4 (5%) | 2 (5%) | 2 (5%) | |
| Extracardiac conduit | 2 (3%) | 1 (3%) | 1 (3%) | |
| Systemic oxygen saturation at rest (%) | 93.7 ± 3 | 94.1 ± 3 | 93.3 ± 3 | 0.24 |
| Heart failure symptoms | 21 (27%) | 10 (26%) | 11 (28%) | 0.80 |
| % predicted peak oxygen consumption (n = 43) | 59.2 ± 14.4 | 56.7 ± 14 | 61.3 ± 15 | 0.30 |
| Ventricular EDV/BSA (ml/m 2 ) ⁎ | 104.7 ± 35 | 94.5 ± 27 | 115.2 ± 40 | 0.015 |
| Ventricular ejection fraction (%) | 53.9 ± 16 | 55.4 ± 9 | 52.3 ± 11 | 0.19 |
| More than mild atrioventricular valve regurgitation by echocardiography | 22 (18%) | 6 (15%) | 7 (16%) | 0.19 |
| History of any arrhythmia | 54 (69%) | 25 (64%) | 29 (74%) | 0.33 |
| Atrial arrhythmia | 44 (56%) | 21 (54%) | 23 (59%) | 0.65 |
| Ventricular arrhythmia | 22 (28%) | 10 (26%) | 12 (31%) | 0.62 |
| Ventricular end-diastolic pressure (mm Hg) (n = 14) | 9.2 ± 4 | 9.9 ± 5 | 8.3 ± 3 | 0.50 |
| Mean PA pressure (mm Hg) (n = 14) | 13.6 ± 4 | 14 ± 3 | 13.2 ± 3 | 0.60 |
| Unilateral branch PA stenosis on CMR imaging † | 4 (5%) | 1 (3%) | 3 (8%) | 0.60 |
⁎ Excluding patients with more than mild valve regurgitation.
† Greater than 50% narrowing and <30% differential lung flow.
| Variable | All Patients (n = 38) | SPC Flow (L/min/m 2 ) | p Value | |
|---|---|---|---|---|
| Low (≤1.06) | High (>1.06) | |||
| (n = 19) | (n = 19) | |||
| Age at enrollment (years) | 2.01 (0.2–15) | 1.19 (0.2–7) | 2.32 (0.3–15) | 0.10 |
| Female (%) | 14 (37%) | 7 (37%) | 7 (37%) | 1 |
| Previous systemic-to-PA shunt | 21 (55%) | 6 (40%) | 15 (79%) | 0.008 |
| Previous bidirectional Glenn shunt | 28 (74%) | 11 (58%) | 17 (90%) | 0.06 |
| Age at volume unloading surgery (years) | 0.5 (0.2–8) | 0.55 (0.3–5) | 0.5 (0.2–8) | 0.60 |
| Previous catheter occlusion of SPCs | 15 (39%) | 2 (11%) | 13 (68%) | 0.001 |
| Anatomic diagnosis | 0.90 | |||
| HLHS | 20 (53%) | 9 (47%) | 11 (58%) | |
| Unbalanced atrioventricular canal | 7 (18%) | 4 (21%) | 3 (16%) | |
| Tricuspid atresia | 6 (16%) | 3 (16%) | 3 (16%) | |
| Double-outlet right ventricle | 3 (8%) | 2 (11%) | 1 (5%) | |
| Hypoplastic tricuspid valve/right ventricle | 2 (5%) | 1 (5%) | 1 (5%) | |
| Mean systemic oxygen saturation (%) | 80.5 ± 5 | 79.5 ± 5 | 81.4 ± 6 | 0.80 |
| Ventricular EDV/BSA (ml/m 2 ) (n = 29) ⁎ | 121.5 ± 34 | 111.3 ± 25 | 132.4 ± 39 | 0.09 |
| Ventricular ejection fraction (%) | 54.6 ± 10 | 54.0 ± 4 | 55.1 ± 4 | 0.9 |
| Unilateral branch PA stenosis on CMR † | 5 (13%) | 1 (5%) | 4 (21%) | 0.3 |
| More than mild atrioventricular valve regurgitation by echocardiography | 7 (18%) | 4 (21%) | 3 (16%) | 0.99 |
| Restrictive atrial septal defect ‡ | 6 (16%) | 1 (5%) | 5 (26%) | 0.18 |
| Ventricular end-diastolic or pulmonary capillary wedge pressure (mm Hg) (n = 27) § | 8.9 ± 2.0 | 8.3 ± 2 | 9.5 ± 2.0 | 0.18 |
| Mean PA pressure (mm Hg) (n = 14) | 13.8 ± 3 | 13 ± 3 | 14.5 ± 3 | 0.15 |
⁎ Excluding patients with more than mild valve regurgitation.
† Greater than 50% narrowing and <30% differential lung flow.
‡ Mean gradient >3 mm Hg by catheterization.
§ Excluding patients with restrictive atrial septal defects.
The Fontan group was composed of predominantly young adults late after Fontan operation. Tricuspid atresia was the most common anatomic diagnosis. Most patients underwent initial palliation with systemic-to-PA shunts, but only a minority underwent intermediate volume-unloading procedures (usually a bidirectional Glenn shunt), reflecting clinical practice during the era of their surgical palliation. The most common type of Fontan procedure was a lateral tunnel. Only a small proportion (13%) of subjects had undergone catheter-based embolization of SPCs.
The pre-Fontan group was composed of infants and young children, most (53%) with hypoplastic left-heart syndrome (HLHS). Most patients in this group (74%) had undergone superior cavopulmonary anastomosis, while the rest were at earlier palliative stages (26%). The atrial septal defects were restricted in 16% of patients in preparation for possible biventricular repair. Approximately 1/3 (39%) of the group had undergone previous catheter-based embolization of SPCs.
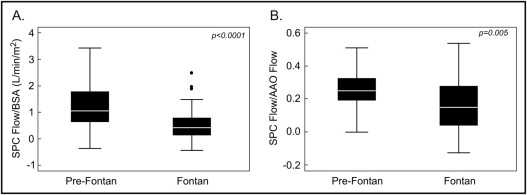
In the Fontan group, median SPC flow by method 1 was 0.43 L/min/m 2 (interquartile range 0.13 to 0.79), accounting for a median of 15% (interquartile range 4% to 28%) of ascending aortic flow. Given that data for calculating SPC flow by method 2 was available in only 2 patients, further analyses were performed using only method 1.
In the pre-Fontan group using method 1 (n = 35), median SPC flow was 1.06 L/min/m 2 (interquartile range 0.65 to 1.77), accounting for a median of 24% (interquartile range 14% to 32%) of ascending aortic flow. Using method 2 (n = 24), median SPC flow was 1.26 L/min/m 2 (interquartile range 1.0 to 1.82), accounting for a median of 29% (interquartile range 20% to 35%) of ascending aortic flow. There was a good correlation (r = 0.90, p <0.0001) and agreement (mean difference 0.17 L/min/m 2 , limits of agreement −1.1 to 0.77) between methods 1 and 2 in quantifying SPC flow/BSA (n = 22). Accordingly, for further analyses, data from method 2 were used as substitute when data from method 1 were missing. Median SPC flow in the pre-Fontan group using either method (n = 38) was 1.06 L/min/m 2 (interquartile range 0.65 to 1.77), accounting for a median of 26% (interquartile range 16% to 33%) of ascending aortic flow.
As seen in Figure 1 , pre-Fontan patients had significantly higher SPC flow/BSA and SPC flow/ascending aortic flow compared to Fontan patients. Flow data for each group are listed in Table 4 . Pre-Fontan patients demonstrated higher indexed systemic blood flow (superior vena cava flow + inferior vena cave flow/BSA) with higher BSA-adjusted flow in the superior vena cava but similar flow in the inferior vena cava, resulting in a higher proportion of caval return being composed of superior vena cava flow.