Abrupt onset of renal ischemia is associated with increased blood pressure (BP), but it is unknown whether BP remains elevated in patients with chronic severe atherosclerotic renal artery stenosis (RAS). Patients undergoing coronary angiography who had concurrent renal angiography were divided into 3 groups: severe (stenosis ≥70% diameter reduction), moderate (10%–69%), and minimal RAS. Aortic BP was measured at the time of angiography. Renal angiography was performed in 762 (5.4%) of 14,181 patients undergoing coronary angiography. The mean age was 62 ± 12 years, 52% were women, 93% had hypertension, and 42% had diabetes mellitus. Minimal, moderate, or severe RAS was found in 62%, 30%, and 9% of patients. Patients with minimal RAS were younger, less likely to have hypercholesterolemia or coronary artery disease, and had a lower creatinine than patients with severe RAS. Severe RAS was associated with a lower diastolic BP and mean BP and a higher pulse pressure (PP), but there was no difference in systolic BP or the number of antihypertensive medications between the 3 groups. The degree of RAS had a weak positive correlation with PP, a weak negative correlation with diastolic BP, and almost no correlation with systolic BP or mean BP. In multivariate linear regression analysis, there was an association between severity of RAS and PP but not with mean BP or systolic BP. In conclusion, PP, but not systolic BP, diastolic BP, mean BP, or number of antihypertensive medications, was elevated in patients with severe RAS.
Patients undergoing coronary angiography are a useful group in which to study the hemodynamic effects of renal artery disease because angiographically apparent renal artery disease is present in 8% to 33% and significant renal artery stenosis (RAS) in 3% to 17% of cases. This study examines the association between angiographic severity of RAS and invasively measured parameters of blood pressure (BP) in patients undergoing concurrent coronary and renal angiography.
Methods
Patients undergoing concurrent coronary and renal angiography in the University of North Carolina Cardiac Catheterization Laboratory between 2004 and 2011 were retrospectively identified. Patients were excluded if they had congenital heart disease, moderate to severe mitral regurgitation, moderate to severe aortic stenosis, fibromuscular dysplasia, end-stage liver disease, end-stage renal disease, history of cardiac transplant, acute ST-elevation myocardial infarction, severe left ventricular dysfunction, inadequate visualization of the renal arteries, and/or creatinine level ≥2.5 mg/dl. This study was approved by the Institution Review Board.
The angiographic method used to evaluate the renal arteries was at the discretion of the individual operator. In the majority of cases, an abdominal aortogram was performed with selective renal angiography if atherosclerotic disease was identified. The degree of stenosis was determined with a computer-assisted quantitative angiography system (AGFA Heartlabs; Greenville, South Carolina). BP was measured via a 6-French fluid-filled pigtail catheter placed in the ascending aorta after the patient was in the supine position for at least 15 minutes while under sedation and before the injection of any contrast media. The monitoring system (Witt Series IV Physiomonitoring System, Philips Medical Systems, Boeblingen, Germany) was balanced and calibrated before each patient was studied. The zero reference was taken as the midaxillary line.
Obstructive coronary artery disease was considered present when the left main artery had a stenosis ≥50% and/or a major epicardial artery or branch had stenosis ≥70%. Standardized definitions were used for risk factors. Antihypertensive medications, defined according to The Seventh Report of the Joint National Committee on Prevention, Detection, Evaluation, and Treatment of High Blood Pressure , were abstracted from the medical record for all patients with severe RAS and for a random sample of patients with minimal or moderate RAS.
Comparisons between groups were done using the Student t test, analysis of variance, or Mantel-Haenszel Chi-squared. Pearson product-moment correlation was used to analyze correlations. To correct for likely confounders, the relation between BP and RAS was assessed relative to the covariates in Table 1 and the presence of coronary, peripheral or cerebrovascular disease. The final model presents adjusted BPs with 95% confidence intervals based on the beta estimates from multiple linear regression with p values based on any significant difference among minimal, moderate, or severe RAS. Differences were considered significant at a p value of ≤0.05.
| Variable | RAS | p Value | ||
|---|---|---|---|---|
| Minimal (n = 469) | Moderate (n = 228) | Severe (n = 65) | ||
| Mean RAS (%) | 1 ± 0.2 | 41 ± 17 | 83 ± 10 | |
| Age (yrs) | 59 ± 12 | 66 ± 10 | 68 ± 10 | <0.001 |
| Women | 49.3% | 57.9% | 47.7% | 0.08 |
| Number of BP medications | 2.4 ± 1.7 | 2.7 ± 1.7 | 2.7 ± 1.3 | 0.43 |
| Ever smoker | 59.7% | 65.0% | 72.9% | 0.10 |
| Current smoker | 27.0% | 28.1% | 37.3% | 0.27 |
| Hypercholesterolemia (low-density lipoprotein ≥130 mg/dl) | 74.9% | 88.0% | 87.5% | 0.002 |
| Diabetes mellitus | 41.5% | 42.9% | 45.2% | 0.84 |
| Hypertension (by history) | 91.6% | 94.7% | 95.4% | 0.25 |
| Heart failure | 19.6% | 21.1% | 32.3% | 0.06 |
| Chronic lung disease | 19.4% | 20.4% | 23.1% | 0.77 |
| Left ventricular ejection fraction (%) | 58 ± 14 | 60 ± 13 | 53 ± 15 | 0.005 |
| Blood urea nitrogen (mg/dl) | 18 ± 8 | 19 ± 8 | 23 ± 12 | <0.001 |
| Creatinine (mg/dl) | 1.05 ± 0.3 | 1.07 ± 0.3 | 1.31 ± 0.4 | <0.001 |
| Indications for renal angiography | ||||
| • Accelerated, resistant, or malignant hypertension | 56.3% | 63.2% | 63.1% | 0.175 |
| • Multi-vessel coronary artery or Peripheral vascular disease | 43.7% | 69.3% | 89.2% | <0.001 |
| • Unexplained pulmonary edema | 21.3% | 20.2% | 18.5% | 0.842 |
| • Unexplained heart failure or refractory angina | 7.7% | 10.5% | 13.8% | 0.175 |
| • Unexplained renal dysfunction | 2.6% | 1.8% | 7.7% | 0.033 |
| • Severe hypertension with age ≥55 yrs | 0.9% | 2.2% | 1.5% | 0.341 |
| • Not meeting any of the listed criteria | 15.8% | 8.3% | 3.1% | 0.001 |
Results
Renal angiography was performed in 762 (5.4%) of 14,181 patients undergoing coronary angiography during this time period. The primary indications for renal artery angiography were accelerated, resistant, or malignant hypertension; multivessel coronary artery disease; and/or peripheral vascular disease ( Table 1 ). The degree of renal artery narrowing was determined by quantitative angiography with minimal RAS (stenosis <10%) being present in 469 (62%) patients, moderate RAS (stenosis between 10% and 69%) in 228 (30%) patients, and severe RAS (stenosis ≥70%) in 65 (8.5%) patients. The prevalence of significant RAS in this population was consistent with previous studies of patients undergoing coronary angiography. The groups were well matched for demographics and risk factors except for age, history of hypercholesterolemia, and laboratory measurements of renal function ( Table 1 ).
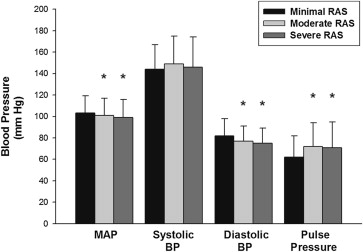
Mean arterial and diastolic BP, measured at the time of renal angiography, were higher in the minimal RAS group compared with moderate and severe RAS groups ( Figure 1 ). The mean pulse pressure (PP) was higher in the moderate and severe RAS groups compared with patients in the minimal RAS group. There was a highly statistically significant correlation between PP and severity of RAS (R = 0.217; p <0.001). There were no differences in systolic BP or the number of antihypertensive medications among the 3 groups ( Table 1 ).

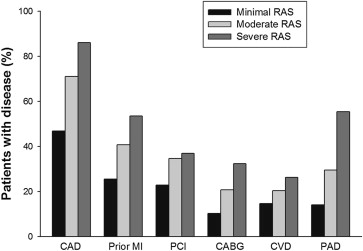
There was a higher incidence of coronary artery disease, previous percutaneous coronary intervention, previous coronary artery bypass grafting, and previous myocardial infarction comparing groups with severe, moderate, and minimal RAS ( Figure 2 ) . On average, patients with severe RAS had a significantly greater number of coronary arteries with obstructive disease than patients with moderate or minimal RAS (1.8 ± 1.1, 1.5 ± 1.2, and 0.9 ± 1.1; p <0.01). The amount of atherosclerotic disease in other vascular beds was also increased including documented cerebrovascular disease and peripheral vascular disease ( Figure 2 ).

Multivariate linear regression models were used to identify and correct for confounding. In these models, the degree of RAS correlated with PP but not with mean BP or systolic BP. The degree of RAS remained correlated with PP and uncorrelated with mean BP or systolic BP in the final model after adjusting for potential confounders ( Table 2 ). In multivariate analysis, factors that correlated with systolic BP included age, gender, history of ever smoking, and history of hypertension, but not degree of RAS.
| Unadjusted | Adjusted for Age and Gender | Adjusted for Age, Gender, History of Hypertension, and History of Ever Smoking | ||||
|---|---|---|---|---|---|---|
| MAP (95% CI) | p Value | MAP (95% CI) | p Value | MAP (95% CI) | p Value | |
| Minimal | 103 (102–105) | 0.05 | 102 (101–104) | 0.49 | 102 (101–104) | 0.53 |
| Moderate | 101 (98–103) | 102 (100–104) | 102 (99–104) | |||
| Severe | 99 (95–103) | 100 (96–104) | 100 (96–104) | |||
| Systolic BP (95% CI) | Systolic BP (95% CI) | Systolic BP (95% CI) | ||||
|---|---|---|---|---|---|---|
| Minimal | 144 (142–147) | 0.06 | 145 (143–147) | 0.27 | 144 (142–147) | 0.31 |
| Moderate | 149 (146–152) | 148 (145–151) | 148 (144–151) | |||
| Severe | 146 (141–152) | 146 (140–152) | 145 (139–152) |
Stay updated, free articles. Join our Telegram channel

Full access? Get Clinical Tree


