In the present study, we hypothesized that hypoadiponectinemia and hyperleptinemia might be associated with left ventricular (LV) diastolic dysfunction. To test the hypothesis, we examined the relation of the plasma levels of adiponectin and leptin with the indexes of LV diastolic and systolic function (relaxation time constant, end-diastolic pressure, and ejection fraction) in 193 consecutive patients undergoing cardiac catheterization for coronary artery disease (age 69 ± 9 years, 74% men; ejection fraction 68.4 ± 9.9%). Regardless of gender, the adiponectin levels correlated negatively with the relaxation time constant and end-diastolic pressure, and the correlations remained significant after adjustment for potential confounders, including age, body mass index, heart rate, blood pressure, and coronary artery disease severity. Adiponectin levels did not significantly correlate with the ejection fraction in either men or women. The leptin levels did not significantly correlate with the indexes of LV diastolic or systolic function in either men or women. In conclusion, we found that decreased adiponectin levels were associated with LV diastolic dysfunction in patients with known or suspected coronary artery disease.
In the present study, we hypothesized that hypoadiponectinemia and hyperleptinemia might be associated with left ventricular (LV) diastolic dysfunction. To test the hypothesis, we examined the relation of the plasma levels of adiponectin and leptin with the indexes of LV diastolic and systolic function in patients undergoing left-sided cardiac catheterization for coronary artery disease (CAD).
Methods
We studied 193 consecutive Japanese patients who underwent cardiac catheterization for the evaluation of CAD and LV hemodynamics. All the patients had symptoms suggestive of angina and/or clinical signs of CAD (positive exercise electrocardiographic findings and/or abnormal myocardial perfusion scintigraphic findings). No patients with acute coronary syndrome, congestive heart failure, atrial fibrillation, primary valvular diseases, idiopathic dilated or hypertrophic cardiomyopathy, congenital heart disease, or end-stage renal disease receiving maintenance hemodialysis were included. A history of coronary revascularization and the medication status were determined by a review of the medical records. Hypertension was defined as systolic blood pressure >140 mm Hg and/or diastolic blood pressure >90 mm Hg measured by indirect arm cuff sphygmomanometry at rest or the use of antihypertensive drugs. Diabetes was defined as a fasting blood glucose level >126 mg/dl or treatment with dietary modification, insulin, or oral hypoglycemic agents. The body mass index was calculated according to the height and weight measured the day before the index cardiac catheterization. All the patients gave written informed consent to participate in the present study, which was performed according to the regulations proposed by the Ethical Guidelines Committee of the Nagoya City University Graduate School of Medical Sciences.
Before contrast material was injected into the left ventricle or coronary artery, LV and aortic pressure waves were obtained with a catheter-tipped micromanometer (SPC-454D, Millar Instrument, Houston, Texas) and recorded on a polygraph system (RMC-2000, Nihon Kohden, Tokyo, Japan), as previously reported. From the recorded pressure waves, the aortic systolic and diastolic pressures and LV end-diastolic pressure (EDP) were determined. A time constant of the decrease in LV pressure (Tau), an index of early diastolic relaxation, was computed by applying a monoexponential fitting with zero asymptote to the LV pressure decay. The LV end-systolic and end-diastolic volumes were obtained from biplane left ventriculography using the method proposed by Chapman et al and were used to calculate the ejection fraction (EF). The median values of the measurements of 3 consecutive beats were used for statistical analyses.
The day before the index cardiac catheterization, an echocardiographic examination was performed (APLIO 80, Toshiba, Tokyo). The LV mass was calculated from the M-mode echocardiographic measurements.
The day before the index cardiac catheterization, blood chemistry was obtained for assessment of the clinical features. The estimated glomerular filtration rate was calculated using an equation developed and validated in a Japanese population. The blood samples for the assay of the plasma levels of adiponectin were collected from the left or right radial artery at cardiac catheterization. The plasma adiponectin levels were measured with a sandwich enzyme-linked immunosorbent assay system (Otsuka Pharmaceutical, Tokyo, Japan). The plasma leptin levels were measured using a radioimmunoassay (human leptin radioimmunoassay kit, SRL, Tokyo, Japan).
We used the SAS program package (SAS Institute, Cary, North Carolina) for all statistical analyses. The differences between the groups were assessed using the Student t test for continuous variables and the chi-square test for categorical variables. The association between continuous variables was determined using Pearson’s correlation analysis. Because the adiponectin and leptin values were not normally distributed, a logarithmic transformation was performed. The significant determinants of the adiponectin levels and LV diastolic function indexes were explored using linear regression analysis. To identify the independent determinants of the adiponectin levels and LV diastolic function indexes, stepwise multivariate linear regression analyses, including the significant determinants as candidates, were performed, with p = 0.05 as the threshold for inclusion or exclusion. The independent association of adiponectin levels with the LV diastolic function indexes was assessed using multivariate linear regression analyses, including the potential confounding factors (significant determinants of adiponectin levels and those of LV diastolic function indexes) 1 by 1. Because the plasma levels of adiponectin and leptin were greater in the women than in the men, all the analyses were performed separately for men and women. p Values <0.05 were considered significant.
Results
The clinical, angiographic, hemodynamic, and echocardiographic features of all patients and patient subgroups are listed in Tables 1 and 2 . Compared to men, women were older and had greater plasma levels of adiponectin and leptin, and a greater EF and had lower Tau and LV volumes.
| Variable | All Patients (n = 193) | Men (n = 143) | Women (n = 50) | p Value |
|---|---|---|---|---|
| Age (years) | 69 ± 9 | 68 ± 9 | 71 ± 9 | <0.05 |
| Body mass index (kg/m 2 ) | 24.7 ± 3.4 | 25.0 ± 3.2 | 24.0 ± 3.8 | NS |
| Hypertension | 138 (72%) | 106 (74%) | 32 (64%) | NS |
| Diabetes mellitus | 87 (45%) | 61 (43%) | 26 (52%) | NS |
| Previous myocardial infarction | 58 (30%) | 43 (30%) | 15 (30%) | NS |
| Previous coronary revascularization | 105 (54%) | 83 (58%) | 22 (44%) | NS |
| Estimated glomerular filtration rate (ml/min/1.73 m 2 ) | 68.2 ± 13.8 | 69.1 ± 13.3 | 65.4 ± 14.9 | NS |
| Medications | ||||
| Angiotensin-converting enzyme inhibitors/angiotensin receptor blockers | 100 (52%) | 79 (55%) | 21 (42%) | NS |
| β Blocker | 78 (40%) | 59 (41%) | 19 (38%) | NS |
| Calcium blocker | 90 (47%) | 69 (48%) | 21 (42%) | NS |
| Statin | 137 (71%) | 105 (73%) | 32 (64%) | NS |
| Adiponectin (μg/ml) | 9.3 ± 5.9 | 8.5 ± 5.5 | 11.7 ± 6.5 | <0.001 |
| Leptin (ng/ml) | 7.5 ± 5.1 | 6.4 ± 4.4 | 10.7 ± 5.4 | <0.001 |
| Variable | All Patients (n = 193) | Men (n = 143) | Women (n = 50) | p Value |
|---|---|---|---|---|
| No. of coronary arteries narrowed ⁎ | NS | |||
| 0 | 54 (28%) | 37 (26%) | 17 (34%) | |
| 1 | 48 (25%) | 35 (24%) | 13 (26%) | |
| >1 | 91 (47%) | 71 (50%) | 20 (40%) | |
| Heart rate (beats/min) | 66 ± 12 | 65 ± 12 | 67 ± 12 | NS |
| Systolic aortic pressure (mm Hg) | 146 ± 21 | 144 ± 21 | 153 ± 19 | NS |
| Diastolic aortic pressure (mm Hg) | 69 ± 12 | 70 ± 12 | 68 ± 12 | NS |
| Mean aortic pressure (mm Hg) | 100 ± 14 | 100 ± 14 | 102 ± 13 | NS |
| Relaxation time constant (ms) | 44.6 ± 8.0 | 45.5 ± 8.4 | 42.1 ± 6.5 | <0.01 |
| End-diastolic pressure (mm Hg) | 14.9 ± 5.2 | 15.2 ± 5.2 | 14.2 ± 5.0 | NS |
| Left ventricular end-diastolic volume index (ml/m 2 ) | 70.8 ± 15.9 | 72.4 ± 15.6 | 66.1 ± 15.8 | <0.05 |
| Left ventricular end-systolic volume index (ml/m 2 ) | 22.9 ± 11.1 | 23.4 ± 9.8 | 22.5 ± 12.3 | <0.05 |
| Ejection fraction (%) | 68.4 ± 9.9 | 67.5 ± 9.7 | 71.1 ± 10.0 | <0.05 |
| Left ventricular mass index (g/m 2 ) † | 104.3 ± 23.8 | 104.3 ± 24.9 | 104.4 ± 22.2 | NS |
⁎ Narrowed coronary artery defined as major epicardial artery with ≥75% stenosis on angiogram.
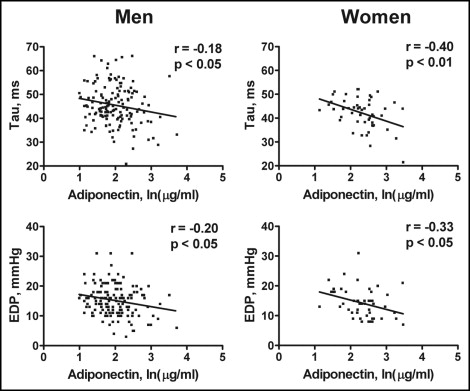
The correlations of the adiponectin levels with the LV diastolic function indexes stratified by gender are shown in Figure 1 . The adiponectin levels correlated negatively with Tau and EDP in men and women. In contrast, the adiponectin levels did not significantly correlate with the EF in either men or women (all p >0.05). No significant correlation was observed between the leptin levels and Tau, EDP, or EF in either men or women (all p >0.05).
The body mass index correlated positively with the Tau (r = 0.23, p <0.01) and EDP (r = 0.18, p <0.05) but not with the EF (r = 0.01, p >0.1) for men and positively with the Tau (r = 0.37, p <0.01) and EDP (r = 0.25, p=0.07) but not with the EF (r = 0.19, p >0.1) for women.
Of the variables listed in Tables 1 and 2 , the significant determinants of the adiponectin levels included age (β = 0.018 ± 0.005 SE, p <0.001), body mass index (β = −0.037 ± 0.013, p <0.01), and heart rate (β = 0.011 ± 0.004, p <0.01) for men and body mass index (β = −0.048 ± 0.019, p <0.05) for women. In the stepwise multivariate linear regression analysis of these variables, the adiponectin levels were determined by age (partial R 2 = 0.091, p <0.001), heart rate (partial R 2 = 0.063, p <0.01), and body mass index (partial R 2 = 0.038, p <0.05) for men and body mass index (partial R 2 = 0.118, p <0.05) for women.
Of the variables listed in Tables 1 and 2 , the significant determinants of Tau included body mass index (β = 0.59 ± 0.21 SE, p <0.01), previous myocardial infarction (β = 7.14 ± 1.41, p <0.001), previous coronary revascularization (β = 5.25 ± 1.35, p <0.001), heart rate (β = −0.45 ± 0.05, p <0.001), and EF (β = −0.32 ± 0.07, p <0.001) for men and body mass index (β = 0.63 ± 0.23, p <0.01), heart rate (β = −0.24 ± 0.07, p <0.01), and systolic aortic pressure (β = 0.10 ± 0.05, p <0.05) for women. In the stepwise multivariate linear regression analysis of these variables, Tau was determined by the heart rate (partial R 2 = 0.385, p <0.001), previous myocardial infarction (partial R 2 = 0.101, p <0.001), body mass index (partial R 2 = 0.029, p <0.01), and EF (partial R 2 = 0.025, p <0.01) for men and heart rate (partial R 2 = 0.186, p <0.01), body mass index (partial R 2 = 0.136, p <0.01), and systolic aortic pressure (partial R 2 = 0.079, p <0.05) for women.
Of the variables listed in Tables 1 and 2 , the significant determinants of EDP included the body mass index (β = 0.29 ± 0.13 SE, p <0.05), previous myocardial infarction (β = 3.55 ± 0.91, p <0.01), previous coronary revascularization (β = 1.79 ± 0.87, p <0.05), heart rate (β = −0.14 ± 0.04, p <0.001), mean aortic pressure (β = 0.088 ± 0.031, p <0.01), systolic aortic pressure (β = 0.061 ± 0.020, p <0.01), and EF (β = −0.13 ± 0.04, p <0.01) for men and previous myocardial infarction (β = 3.05 ± 1.48, p <0.05) and systolic aortic pressure (β = 0.10 ± 0.03, p <0.01) for women. In the stepwise multivariate linear regression of these variables, EDP was determined by previous myocardial infarction (partial R 2 = 0.109, p <0.001), heart rate (partial R 2 = 0.068, p <0.001), and mean aortic pressure (partial R 2 = 0.025, p <0.001) for men and by systolic aortic pressure (partial R 2 = 0.164, p <0.01) for women.
The adiponectin levels correlated significantly with the LV diastolic function indexes after adjustment for each of potential confounders ( Table 3 ). The adjustment for body mass index attenuated the correlations of adiponectin levels with LV diastolic function indexes but the correlations with EDP in men and with Tau in women remained significant.


