Nonalcoholic fatty liver disease (NAFLD) is associated with obesity and insulin resistance and has been linked with increased cardiovascular risk. Although physical activity (PA) and lifestyle modification are often recommended in patients at cardiovascular risk, the benefit across the cardiometabolic risk spectrum is unclear. We aimed to evaluate the relation of PA and NAFLD independent of metabolic syndrome (MS) or obesity. We evaluated 5,743 healthy Brazilian subjects (43 ± 10 years, 79% men) without clinical coronary heart disease from December 2008 to December 2010. NAFLD was diagnosed using ultrasounds, and self-reported PA was assessed using the International Physical Activity Questionnaire scale. In a multivariate logistic regression adjusted for cardiometabolic risk factors, we evaluated for an independent association of NAFLD and PA. In the total study population, NAFLD prevalence was 36% (n = 2,075), obesity 23% (1,300), and MS 20% (1,152). NAFLD was more prevalent in subjects with MS (74%) than those without (26%) and in those obese (73%) than in those nonobese (25%). Overall, 1,305 (23%) subjects reported low activity, 1,990 (35%) moderate activity, and 2,448 (42%) high activity. NAFLD prevalence was lower at higher levels of reported PA (low 45%, moderate 38%, and high 30%, p <0.001). After adjusting for risk factors, subjects with high activity had lower odds of having NAFLD. The favorable association was independent of obesity or MS. In conclusion, PA presents a dose-response association with NAFLD independent of the MS or obesity. Our results are compatible with the idea that benefits of PA are relevant to everyone regardless of cardiometabolic risk.
Regular physical activity (PA) reduces the risk of many adverse health outcomes. It has been shown that any PA is better than none and additional benefits occur as the amount of PA increases through higher intensity, greater frequency, and/or longer duration, especially with regard to cardiovascular health. As such, the American Heart Association concluded that sedentary lifestyle is a major modifiable risk factor for cardiovascular disease (CVD). Nonalcoholic fatty liver disease (NAFLD) represents a spectrum of progressive liver diseases ranging from simple steatosis to nonalcoholic steatohepatitis (NASH) that may progress to hepatocellular carcinoma. It is thought that NAFLD is not just a risk marker for CVD but also is involved in its pathogenesis. Previous studies have shown that NAFLD is improved by being physically active and other lifestyle measures. However, it is not clear if the association of PA and NAFLD is independent of the presence of the metabolic risks. In this study, we aimed to assess the association of PA levels and NAFLD in the presence or absence of metabolic syndrome (MS) and obesity.
Methods
We evaluated 5,743 asymptomatic men and women, free of CVD, who had a routine obligatory clinical and laboratory health evaluation paid for by their employers from December 2008 to December 2010 at the Preventive Medicine Center of the Hospital Israelita Albert Einstein in São Paulo, Brazil. The examination protocol consisted of a clinical consultation, laboratory evaluation, and abdominal ultrasound, as previously described. Using questionnaires, all subjects provided self-reported details of their demographics, medical history, quantitative alcohol consumption, smoking status, and medication usage at the time of their clinical visits. We excluded 730 subjects with missing information on PA or presence of NAFLD. Subjects with a known history of liver disease were excluded from this study. PA level was assessed by a physical educator using the International Physical Activity Questionnaire: Short Form (IPAQ-SF), which has been previously validated in a similar patient population. The IPAQ-SF traditionally categorizes subjects into 1 of 3 distinct qualitative categories of PA: high, moderate, and low. According to IPAQ-SF scoring guidelines, high PA is equivalent to >1 hour of moderate-intensity activity over and above basal activity or >30 minutes of vigorous-intensity activity above basal levels daily. Moderate activity is defined as 30 minutes of at least moderate-intensity activity on most days of the week, and low activity describes all subjects not meeting the previously mentioned criteria. In the analysis, PA was stratified into low, moderate, and high.
Smoking status was defined as either current smoker or nonsmoker (inclusive of former smokers and never smokers). Diabetes mellitus was identified by previous physician diagnosis or by the use of a glucose-lowering medication. Hypertension and dyslipidemia were identified by a previous diagnosis of these conditions or the use of blood pressure–lowering or lipid-lowering medications. Additionally, those subjects with systolic blood pressure >140 mm Hg or diastolic blood pressure >90 mm Hg at the clinical evaluation were also labeled as having hypertension. During physical examinations, blood pressure was measured with an aneroid sphygmomanometer using the method recommended by the American Heart Association. Waist circumference (WC) was measured at the smallest diameter between the iliac crest and the costal margin using a plastic anthropometric tape held parallel to the floor. Obesity was defined as a body mass index >30 kg/m 2 or >25 kg/m 2 in subjects with a high WC. WC was defined as high if >94 cm in men or >80 cm in women. The MS was defined using criteria from the International Diabetes Federation guidelines. Alcohol use was quantified by the Alcohol Use Disorders Identification Test score. The Alcohol Use Disorders Identification Test score was developed and validated by the World Health Organization among men and women in different countries. We categorized a total test score of ≥8 as high alcohol consumption for men and ≥4 for women.
Blood specimens were collected after an overnight fast. Plasma lipid, glucose, gamma glutamyl transferase (GGT), and liver transaminase (alanine aminotransferase (ALT) and aspartate aminotransferase (AST)) levels were measured by standardized automated laboratory tests using a VITROS platform (Johnson & Johnson Clinical Diagnostics, New Brunswick, New Jersey). High-sensitivity C-reactive protein levels were determined by immunonephelometry (Dade-Behring GMbH, Mannheim, Germany). All tests were performed at the Central Laboratory of the Hospital Israelita Albert Einstein.
NAFLD was diagnosed after at least a 6-hour fast using an ACUSON XP-10 device (Mountain View, California) and was identified by the presence of an ultrasonographic pattern of a bright liver, with evident contrast between hepatic and renal parenchyma and using a standardized algorithm. All hepatic ultrasounds were read by board certified radiologists. This study was approved by the local institutional review board, and a waiver for informed consent was obtained as all data were deidentified previous to analysis.
Baseline characteristics of subjects in the different PA categories were compared using the analysis of variance test for continuous variables and the Pearson’s chi-square test for categorical variables. Because of the skewed distribution of ALT, AST, GGT, and high-sensitivity C-reactive protein, median values were used in comparing the 2 groups using the nonparametric Kruskal-Wallis test. A multivariate logistic regression was used to evaluate associations of PA levels and the presence of NAFLD. An unadjusted logistic regression was done first followed by sequentially adjusting first for age and gender and then simultaneously adjusting for other confounding factors (WC, systolic blood pressure, fasting glucose, low-density lipoprotein cholesterol, lipid-lowering medication use, high-sensitivity C-reactive protein, alcohol consumption, and smoking). All statistical analyses were performed using STATA Statistical Software: Release 12. College Station, Texas: StataCorp LP.
Results
The characteristics of the study population stratified by the level of PA are displayed in Table 1 . There were statistically significant differences in demographics, anthropometric, and biochemical profiles among the 3 groups.
| Physical Activity level | ||||
|---|---|---|---|---|
| Variable | Low (N=1,305) | Moderate (N=1,990) | High (N=2,448) | P-value |
| Men | 77% | 79% | 80% | 0.119 |
| Mean age (years ±SD) | 42±10 | 43±9 | 45±10 | <0.001 |
| Mean BMI (Kg/m 2 ±SD) | 27±5 | 26±4 | 26±4 | <0.001 |
| Mean Waist circumference (cm ±SD) | 94±13 | 92±12 | 90±11 | <0.001 |
| Body Mass Index ≥ 30kg/m 2 | 33% | 23% | 17% | <0.001 |
| Mean Systolic Blood Pressure (mmHg ±SD) | 120±13 | 119±13 | 118±12 | <0.001 |
| Mean Diastolic Blood Pressure (mmHg ±SD) | 78±8 | 77±8 | 77±8 | 0.001 |
| Hypertension | 13% | 12% | 12% | 0.456 |
| Median Aspartate Transaminase (IU/L) (inter-quartile range) | 29(24-35) | 29(25-34) | 29(25-34) | <0.001 |
| Median Alanine Transaminase (IU/L) (inter-quartile range) | 35(26-49) | 33(25-45) | 32(25-41) | <0.001 |
| Median Gamma Glutamyl Transferase (mg/dl) (inter-quartile range) | 34(24-51) | 31(22-47) | 29(21-42) | <0.001 |
| Median Triglycerides (mg/dl) (inter-quartile range) | 128(90-128) | 120(85-172) | 107(78-147) | <0.001 |
| Mean High Density Lipoprotein Cholesterol (mg/dl ±SD) | 46±13 | 47±13 | 50±13 | <0.001 |
| Mean Low Density Lipoprotein Cholesterol (mg/dl ±SD) | 133±34 | 131±33 | 129±33 | 0.005 |
| Mean Fasting Blood Glucose (mg/dl ±SD) | 90±12 | 90±10 | 89±9 | <0.001 |
| Median high sensitive C-reactive Protein (mg/dl) (inter-quartile range) | 1.5(0.8-3.0) | 1.3(0.7-2.5) | 1.1(0.6-2.0) | <0.001 |
| High sensitivity C-reactive Protein (≥3mg/dl) | 33% | 32% | 31% | 0.753 |
| Mean Uric acid (mg/dl ±SD) | 6.0±1.4 | 5.9±1.4 | 5.7±1.4 | <0.001 |
| Antihypertensive | 13% | 11% | 12% | 0.524 |
| Lipid lowering Medication | 7% | 8% | 10% | 0.014 |
| Metabolic syndrome | 26% | 23% | 15% | <0.001 |
| Median Triglyceride: High Density Lipoprotein ratio (inter-quartile range) | 2.9(1.7-4.8) | 2.6(1.7-4.2) | 2.2(1.5-3.4) | <0.001 |
| Current smoker | 12% | 9% | 7% | 0.001 |
| Non-Alcoholic Fatty Liver Disease | 45% | 38% | 30% | <0.001 |
Figures 1 and 2 demonstrate a steady decrease in the prevalence of NAFLD with activity level independent of the presence of MS or obesity. The prevalence of NAFLD was 79% in subjects with body mass index alone >30, 72% in the group with central obesity, and only 27% in subjects without the MS.
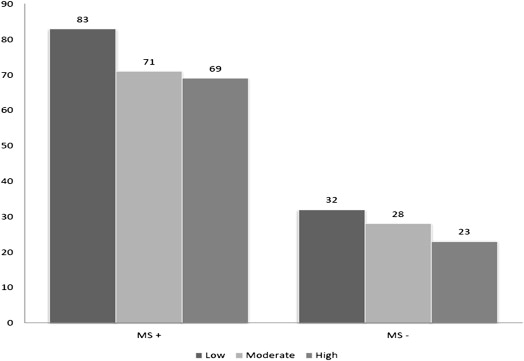
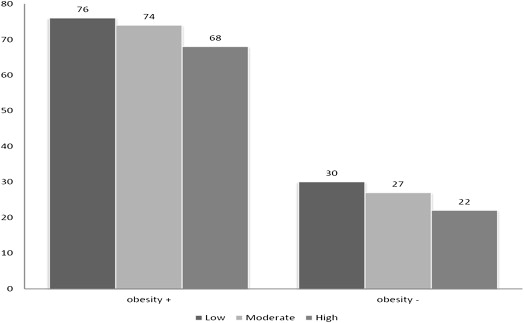
Table 2 presents multivariate logistic regression of the risk of NAFLD by the PA level adjusted for confounding variables and stratified by the presence of MS and obesity. The association between PA and NAFLD showed a dose-response association independent of the presence of MS or obesity. From a subanalysis, Table 3 shows that the association of PA and NAFLD was only significant in the metabolically unhealthy compared with the healthy obese population.
| Total | β MS+ | MS- | † Obesity+ | † Obesity- | |
|---|---|---|---|---|---|
| Model 1 | |||||
| Low(ref) | 1.0 | 1.0 | 1.0 | 1.0 | 1.0 |
| Moderate | 0.74 (0.64−0.85) Ω | 0.54 (0.38-0.76) Ω | 0.83 (0.70-0.99) ∗ | 0.88 (0.65-1.19) | 0.85 (0.70-1.01) |
| High | 0.51 (0.45- 0.59) Ω | 0.49 (0.34-0.70) Ω | 0.64 (0.54-0.76) Ω | 0.64 (0.47-0.87) α | 0.66 (0.55-0.78) Ω |
| Model 2 | |||||
| Low(ref) | 1.0 | 1.0 | 1.0 | 1.0 | 1.0 |
| Moderate | 0.67 (0.57- 0.78) Ω | 0.53 (0.38-0.76) Ω | 0.74 (0.62-0.90) α | 0.83 (0.60-1.15) | 0.76 (0.63-0.93) α |
| High | 0.41 (0.35- 0.47) Ω | 0.47 (0.32- 0.67) Ω | 0.49 (0.41-0.59) Ω | 0.57 (0.41-0.78) α | 0.51 (0.42-0.62) Ω |
| Model 3 | |||||
| Low(ref) | 1.0 | 1.0 | 1.0 | 1.0 | 1.0 |
| Moderate | 0.81 (0.67 – 0.97) ∗ | 0.57 (0.39 – 0.84) α | 0.88 (0.70-1.10) | 0.76 (0.54-1.08) | 0.75 (0.61-0.94) ∗ |
| High | 0.69 (0.57- 0.84) Ω | 0.65 (0.43 – 0.98) ∗ | 0.74 (0.59-0.92) α | 0.60 (0.42-0.85) α | 0.54 (0.44-0.67) Ω |
Stay updated, free articles. Join our Telegram channel

Full access? Get Clinical Tree


