Biomarker measures of infarct size and myocardial salvage index (MSI) are important surrogate measures of clinical outcomes after a myocardial infarction. However, there is variability in infarct size unaccounted for by conventional adjustment factors. This post hoc analysis of Evaluation of Myocardial Effects of Bendavia for Reducing Reperfusion Injury in Patients With Acute Coronary Events (EMBRACE) ST-Segment Elevation Myocardial Infarction (STEMI) trial evaluates the association between left ventricular (LV) mass and infarct size as assessed by areas under the curve for creatine kinase-MB (CK-MB) and troponin I release over the first 72 hours (CK-MB area under the curve [AUC] and troponin I [TnI] AUC) and the MSI. Patients with first anterior STEMI, occluded left anterior descending artery, and available LV mass measurement in EMBRACE STEMI trial were included (n = 100) ( ClinicalTrials.gov NCT01572909 ). MSI, end-diastolic LV mass on day 4 cardiac magnetic resonance, and CK-MB and troponin I concentrations were evaluated by a core laboratory. After saturated multivariate analysis, dominance analysis was performed to estimate the contribution of each independent variable to the predicted variance of each outcome. In multivariate models that included age, gender, body surface area, lesion location, smoking, and ischemia time, LV mass remained independently associated with biomarker measures of infarct size (CK-MB AUC p = 0.02, TnI AUC p = 0.03) and MSI (p = 0.003). Dominance analysis demonstrated that LV mass accounted for 58%, 47%, and 60% of the predicted variances for CK-MB AUC, TnI AUC, and MSI, respectively. In conclusion, LV mass accounts for approximately half of the predicted variance in biomarker measures of infarct size. It should be considered as an adjustment variable in studies evaluating infarct size.
Myocardial infarct size is a measure of the extent of ischemic injury in ST-segment elevation myocardial infarction (STEMI). Infarct size is an important prognostic factor after myocardial infarction (MI) and has been used as a surrogate measure of clinical outcomes in several clinical trials. There are biologic and methodologic contributors to the variability in infarct size. Biologic contributors to the variability in infarct size include duration of ischemia, presence of collaterals, and most importantly, myocardial area at risk. There is methodologic variability in each of the measures used to estimate infarct size including biochemical markers, such as creatine kinase-MB (CK-MB) and troponin I (TnI) release, as well imaging techniques, such as late gadolinium enhancement on cardiac magnetic resonance imaging (CMR) and single-photon emission computed tomography. The variability in infarct size can be reduced by adjusting for these biologic and methodologic confounders, thereby improving discussion and statistical power. The effect of the absolute left ventricular (LV) mass as a contributor to biologic variability in infarct size has not been evaluated. It is plausible that hearts with greater LV mass have a significantly larger myocardium at risk and larger absolute masses of myocardium infarcted during an MI. It is also plausible that hearts with large LV mass have larger absolute levels of enzyme release for proportionally equivalent infarct sizes. For example, an infarct involving 15% of the myocardium might yield twice as big of an area under the curve for biomarker release if the myocardium is of twice the mass. Adjustment for LV mass has not been adjusted for in the assessment of biomarker release in clinical trials despite possible confounding. The goal of this study was to evaluate the association between the absolute LV mass and 2 biomarker measures of infarct size (area under the curve [AUC] for CK-MB and AUC for TnI over the first 72 hours after an STEMI) and LV mass and the myocardial salvage index (MSI), a measure of viable myocardium relative to the initial myocardium at risk.
Methods
Evaluation of Myocardial Effects of Bendavia for Reducing Reperfusion Injury in Patients With Acute Coronary Events (EMBRACE) STEMI was a double-blind, placebo-controlled, randomized phase IIa clinical trial that evaluated the safety, tolerability, and efficacy of the mitochondrial-targeting peptide (MTP)-131 (Bendavia) among first-time anterior subjects with STEMI who underwent successful percutaneous coronary intervention (PCI) ( ClinicalTrials.gov NCT01572909 ). Subjects who presented within 4 hours of symptom onset were randomized in a 1:1 ratio to receive either 0.05 mg/kg/hour MTP-131 or identically appearing placebo infusion (n = 297). Infarct size was a prespecified end point and was evaluated by area under the curve for CK-MB enzyme over the first 72 hours after PCI (CK-MB AUC 0-72 and troponin I AUC 0-72 ) and by the volume of infarcted myocardium on CMR (late gadolinium enhancement) on day 4 ± 1 post-PCI. Compared with placebo, treatment with MTP-131 was not associated with a significant reduction in infarct size as assessed by enzyme release or on CMR. Additional details of the EMBRACE STEMI study design and the primary results have been previously published. The study was approved by the local institutional review committees, and all subjects provided informed consent.
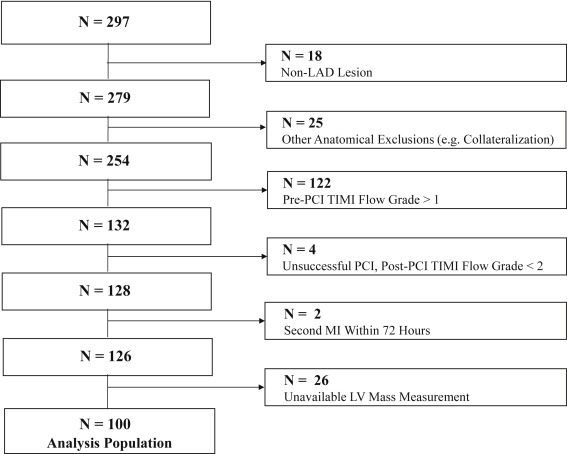
This post hoc analysis evaluates the association between LV mass and 2 biomarker measures of infarct size (CK-MB AUC 0-72 and TnI AUC 0-72 ), and between LV mass and the MSI. To control for all possible confounding factors, the analysis was exclusively conducted in patients with the following characteristics: left anterior descending (LAD) lesions, intervention on only the LAD, pre-PCI Thrombolysis In Myocardial Infarction (TIMI) flow grade ≤1, post-PCI TIMI flow grade >1, absence of significant coronary collateral flow, and no second MI within 72 hours of the primary event.
CK-MB and TnI measurements were all analyzed by a central laboratory. Calculation of the AUC was performed using the linear trapezoidal method and was based on 8 values of CK-MB/TnI: immediately after PCI and then at 6, 12, 24, 36, 48, 60, and 72 hours after PCI. All angiographic parameters were analyzed by an angiographic core laboratory blinded to treatment assignment. The lesion location relative to the length of the LAD was defined by quantitative coronary analysis as the % distance from the LAD ostium to the lesion divided by the total length of the LAD distal landmark (smaller % suggests more proximal lesions). The CMR protocol included T 2 -weighted short-axis and gadolinium enhancement short-axis scans (early and delayed). Prespecified CMR imaging parameters were echo time/repetition time (Gadolinium) = 2 to 4/6 to 9 ms, echo time/repetition time (T 2 ) = 2 R-R intervals/60 to 100 ms, field of view = 28 to 34 cm, matrix = 256 × 192 (or field of view/matrix to maintain in-plane spatial resolution ≤2 mm), and slice thickness = 8 mm. All CMR images were analyzed by a single, blinded, and experienced radiologist for infarct volume, edema volume, and total end-diastolic LV mass. MSI represents the area of reversibly injured myocardium on day 4 CMR and was calculated using the equation: MSI = [(myocardial area at risk − final infarct size)/(myocardial area at risk)].
All statistical analyses were performed using Stata 13 (StataCorp LP, College Station, Texas). Data were expressed as frequencies and percentages for categorical variables, means ± SD for parametric continuous variables, and median (interquartile range) for nonparametric continuous variables. The univariate associations between biomarker measures of infarct size (CK-MB AUC 0-72 and TnI AUC 0-72 ), the MSI, and the clinical variables were performed using Pearson’s correlation coefficient for continuous variables and t test with unequal variance for binary variables. Variables with a p value ≤0.10 in the univariate analysis were retained in the multiple regression models for each of the outcome variables: CK-MB AUC 0-72 , TnI AUC 0-72 , and MSI. All tests were double sided. A p value <0.05 was considered significant. There was no adjustment for multiple comparisons.
Dominance analysis and estimation of the McFadden R 2 statistic were performed to evaluate the relative importance of individual variables in explaining the variance of the outcome variable in each multivariate model. Dominance analysis is a useful statistical method that decomposes the variances for all possible subset models of a multiple regression model and examines the change in the predicted variance when reintroducing individual variables to the subset models. It simultaneously accounts for (1) the “direct effect” of a variable when considered alone, (2) its “total effect” when all other variables are factored in, and (3) its “partial effect” when only a portion of the other variables in the model are introduced. The dominance weight of a variable is standardized to be out of 100% and is reported as the standardized weight of the predicted variance, that is, the proportion of contribution of the individual variable to the predicted variance out of the total contributions of all variables included in any given model.
Results
A total of 297 subjects were randomized, of which 100 met the inclusion criteria for this analysis ( Figure 1 ). Each of CK-MB AUC 0-72 and TnI AUC 0-72 was available for 99% of patients (99 of 100) included in this analysis, and MSI was available for 92% of patients (92 of 100). The mean patient age was 59.3 ± 11.1 years, and 74% were men. Baseline characteristics are summarized in Table 1 . The median CK-MB AUC 0-72 was 6,125.7 ng·h/ml (3,962.3, 9,000.0), the median TnI AUC 0-72 was 4,830.2 μg·h/L (2,608.2, 6,503.7), and the median MSI was 0.58 (0.50, 0.64).
| Baseline Characteristic | Value (n=100) |
|---|---|
| Age (years), mean ± SD | 59.3 ± 11.1 |
| Men | 74% |
| BSA (m 2 ), median (IQR) | 1.97 (1.80, 2.08) |
| BMI (kg/m 2 ), median (IQR) | 27.13 (24.22, 30.41) |
| Diabetes mellitus | 7% |
| Hypertension | 47% |
| Dyslipidemia | 15% |
| Active smokers | 45% |
| Ischemia time (minutes), median (IQR) | 158.3 (123, 200) |
| Proximal culprit artery diameter (mm), median (IQR) | 2.9 (2.6, 3.2) |
| Pre-PCI thrombus aspiration | 68% |
| CMR end-diastolic LV mass (kg), median (IQR) | 0.15 (0.1, 0.2) |
| Active treatment | 47% |
On univariate analysis, LV mass was associated with each of CK-MB AUC 0-72 (r = 0.38, p <0.001) and TnI AUC 0-72 (r = 0.51, p <0.001), and it was inversely associated with MSI (r = −0.39, p <0.001). In addition, measures of infarct size were significantly associated with the lesion location relative to the length of the LAD, age, gender, active smoking status, and body surface area ( Table 2 ).
| Variables | CK-MB AUC 0-72 (n=99) | TnI AUC 0-72 (n=99) | MSI (n=92) | |||
|---|---|---|---|---|---|---|
| Continuous Variables | r | p-value | r | p-value | r | p-value |
| Age | -0.12 | 0.25 | -0.21 | 0.03 | 0.07 | 0.50 |
| BSA | 0.27 | 0.008 | 0.31 | 0.002 | -0.09 | 0.40 |
| Ischemia time | -0.01 | 0.91 | 0.01 | 0.92 | -0.09 | 0.41 |
| Lesion location ∗ | -0.15 | 0.13 | -0.30 | 0.002 | 0.07 | 0.54 |
| CMR end-diastolic LV mass | 0.38 | <0.001 | 0.51 | <0.001 | -0.39 | <0.001 |
| Categorical Variables | Mean difference † (95% CI) | p-value | Mean difference † (95% CI) | p-value | Mean difference † (95% CI) | p-value |
| Male gender | 925.3 (-428.9, 2279.6) | 0.18 | 1877.9 (700.4, 3055.5) | 0.002 | -0.02 (-0.08, 0.05) | 0.57 |
| Diabetes mellitus | 719.8 (-2868.8, 4308.5) | 0.65 | -61.4 (-2586.6, 2463.8) | 0.96 | -0.02 (-0.14, 0.10) | 0.66 |
| Hypertension | 786.3 (-622.1, 2194.7) | 0.27 | 375.8 (-1011.7, 1763.3) | 0.59 | -0.002 (-0.05, 0.05) | 0.92 |
| Active smoking | 1064.5 (-348.4, 2477.4) | 0.14 | 2067.6 (671.8, 3463.5) | 0.004 | -0.07 (-0.12, -0.02) | 0.009 |
| Thrombus aspiration | 565.4 (-813.3, 1944.0) | 0.42 | 629.6 (-585.2, 1844.4) | 0.31 | -0.04 (-0.09, 0.02) | 0.18 |
| Active treatment | -83.4 (-1476.2, 1309.4) | 0.91 | 800.8 (-595.5, 2197.1) | 0.10 | 0.002 (-0.05, 0.05) | 0.92 |
∗ Lesion location was defined as the % distance from the LAD ostium to the lesion divided by the total length of the LAD distal landmark on quantitative coronary analysis.
† Mean differences are calculated using the equation: mean for patients with the condition/disease – mean for patients without the condition/disease.
The associations between measures of infarct size and the clinical variables were then analyzed in a multiple regression model with adjustment for ischemia time ( Table 3 ). On multivariate analysis, only LV mass was independently associated with all measures of infarct size (CK-MB AUC 0-72 p = 0.02; TnI AUC 0-72 p = 0.03; and MSI p = 0.003), whereas active smoking status was only associated with TnI AUC 0-72 (p = 0.02). The remaining clinical variables, however, were no longer statistically significant when included in the multivariate models. The combination of clinical variables included in the multivariate models explained 17%, 33%, and 24% of the variance of CK-MB AUC 0-72 , TnI AUC 0-72 , and MSI, respectively.
| Variables | CK-MB AUC 0-72 (n=96) R 2 =0.17, p=0.01 | TnI AUC 0-72 (n=96) R 2 =0.33, p<0.001 | MSI (n=89) R 2 =0.25, p<0.001 | ||||||
|---|---|---|---|---|---|---|---|---|---|
| Partial r | Coefficient (95% CI) | p-value | Partial r | Coefficient (95% CI) | p-value | Partial r | Coefficient (95% CI) | p-value | |
| CMR end-diastolic LV mass | 0.26 | 20517.8 (3027.2, 38008.4) | 0.02 | 0.33 | 24304.0 (2929.9, 45678.1) | 0.03 | -0.39 | -1.1 (-1.8, -0.4) | 0.003 |
| Body surface area | 0.11 | 2462.0 (-3897.8, 8821.8) | 0.44 | -0.01 | -274.9 (-4733.2, 4183.4) | 0.90 | 0.13 | 0.1 (-0.1, 0.3) | 0.33 |
| Lesion location ∗ | -0.01 | -256.4 (-6520.3, 6007.5) | 0.94 | -0.14 | -4565.2 (-10598.9, 1468.5) | 0.14 | -0.13 | -0.2 (-0.4, 0.1) | 0.28 |
| Active smoking status | – | 573.7 (-958.1, 2105.5) | 0.46 | – | 1411.8 (205.9, 2617.7) | 0.02 | – | -0.1 (-0.1, 0.01) | 0.10 |
| Male gender | – | -849.4 (-2859.8, 1161.1) | 0.40 | – | 567.0 (-1310.7, 2444.7) | 0.56 | – | 0.04 (-0.1, 0.1) | 0.90 |
| Age | 0.03 | 10.7 (-73.0, 94.3) | 0.80 | -0.03 | -9.7 (-75.0, 55.6) | 0.77 | -0.06 | -0.001 (-0.003, 0.002) | 0.58 |
| Ischemia time | -0.09 | -5.7 (-21.0, 9.5) | 0.46 | -0.05 | -3.2 (-15.3, 8.9) | 0.60 | -0.06 | -0.001 (-0.001, 0.0003) | 0.57 |
Stay updated, free articles. Join our Telegram channel

Full access? Get Clinical Tree


