Catabolism and inflammation play a role in the physiopathology of heart failure with reduced ejection fraction and are more pronounced in the advanced stages of the disease. Our aim was to demonstrate that in patients with stable heart failure with reduced ejection fraction adequately treated, a direct relation exists between functional impairment, as evaluated by left ventricular ejection fraction (LVEF) and the 6-minute walking distance (6MWD), and catabolic and inflammatory markers. In 151 outpatients with heart failure and a LVEF of ≤40% (median age 64 years, LVEF 29%, and 6MWD 290 m) we measured the laboratory and body composition parameters that indicate directly or indirectly inflammatory activation, anabolic-catabolic balance, and nutritional status. We performed an analysis stratified by quartiles of LVEF and 6MWD and linear regression analysis to explore our hypothesis. In the linear regression analysis, after adjusting for age, gender, and etiology, LVEF was not related to the metabolic, inflammatory, or nutritional parameters. The 6MWD was directly related to albumin (p = 0.002) and log transformation of dehydroepiandrosterone (p = 0.013) and inversely to adiponectin (p = 0.001) and the log-transformation of high-sensitivity C-reactive protein (p = 0.037). In conclusion, in a population with stable heart failure with reduced ejection fraction, the 6MWD was related to the degree of inflammatory activity and catabolism, but LVEF was not. Even a slightly diminished functional capacity implies underlying inflammation and catabolic activation.
In addition to neurohormonal activation, inflammatory and metabolic phenomena play a role in the physiopathology of chronic heart failure with reduced ejection fraction. Progressively lower functional capacity (FC) and left ventricular ejection fraction (LVEF) are associated with more advanced heart failure. The Marcadores de Inflamación y Metabolismo en la Insuficiencia Cardíaca Ambulatoria (MIMICA) Study was designed to explore the hypothesis that within a population with heart failure with reduced ejection fraction (defined as chronic heart failure with a LVEF of ≤40%) with optimal medical treatment, a gradient might exist in the inflammatory and metabolic markers directly related to more severe disease. Specifically, we expected a clinical and biochemical picture characterized by greater inflammatory activation and anabolic-catabolic imbalance with progressively lower steps of LVEF and FC. The present study analyzed the relation of inflammation and catabolism with LVEF and FC in this population.
Methods
From May 2005 to March 2007, we included 151 ambulatory patients with heart failure with reduced ejection fraction and stable clinical conditions and no hospitalization within the previous 3 months. Heart failure had been diagnosed according to the American College of Cardiology/American Heart Association guidelines. The patients were treated by their own primary care physicians. A strong recommendation had been made for the use of β blockers, angiotensin-converting enzyme inhibitors or angiotensin receptor blockers, and spironolactone, whenever indicated. We excluded patients unable to perform a functional test or who had experienced a coronary event or revascularization procedure within the past 3 months. Patients with significant primary valvular disease, pericardial disease, or systemic diseases that could shorten their life expectancy or produce chronic inflammation (eg, active malignancy, autoimmune disease, chronic infection) were also excluded. The data from the patients’ medical history, symptoms, physical examination findings, and current medical treatment were registered.
After a 12-hour overnight fast, a venous blood sample was obtained from the antecubital vein. The hematologic parameters, urea, creatinine, glycemia, baseline insulin, liver, and cholesterol panels were determined. The laboratory parameters that directly or indirectly express inflammatory activation, anabolic-catabolic imbalance, and nutritional status, including hemoglobin, leukocyte count, globular sedimentation rate, high-sensitive C-reactive protein (hs-CRP), uric acid, leptin, adiponectin, albumin, cortisol, and dehydroepiandrosterone sulphate (DHEAS), were measured. N-terminal pro-brain natriuretic peptide was chosen as a reliable marker of heart failure severity. For determination of hs-CRP, leptin, adiponectin, N-terminal pro-brain natriuretic peptide, cortisol, and DHEAS, all the samples were processed in the same assay.
hs-CRP was determined using the Tina-quant CRP (latex) high-sensitive immunoturbidimetric assay (Roche Diagnostics, Indianapolis, Indiana) in a Hitachi 917 AutoAnalyzer. The intra-assay coefficient of variation was 0.43%.
Leptin was measured using an immunoradiometric assay (Active Human Leptin IRMA, Diagnostic System Laboratories, Webster, Texas). The intra-assay coefficient of variation at 3.0 ng/ml was 3.9% and at 12 ng/ml was 1.7%.
Adiponectin was determined using an enzyme immunoassay (Quantikine Human Adiponectin/Acrp30 Immunoassay, R&D Systems, Minneapolis, Minnesota). The intra-assay coefficient of variation at 19.8 ng/ml was 2.5%.
N-terminal pro-brain natriuretic peptide was determined using an immunoassay (proBNP Elecsys, Roche Diagnostics, GmbH, Mannheim, Germany). The intra-assay coefficient of variation was 2.7%.
The plasmatic cortisol levels were evaluated by immunoassay (Access Cortisol, Beckman Coulter, Chaska, Minnesota). The intra-assay coefficient of variation was 6.4%.
DHEAS was assessed by radioimmunoassay (Coat-A-Count DHEAS-SO 4 , Diagnostic Products, Los Angeles, California). The intra-assay coefficient of variation was <5.3%.
In nondiabetic patients, insulin resistance was calculated using the Homeostasis Model Assessment method.
The acquisition of echocardiographic data was performed using the Philips iE33 Ultrasound. M-mode left ventricular dimensions were obtained from the parasternal long-axis view according to the standard American echocardiographic guidelines, determining the left ventricular diastolic and systolic diameters, interventricular septum, posterior wall, and aortic root. Ventricular function was assessed in 4-chamber apical view: the endocardial border was manually traced in end-systole and end-diastole, and, using the Simpson method (biplane), the left ventricular end-diastolic volume, left ventricular end-systolic volume, and LVEF were assessed.
FC was assessed using the 6-minute walking distance (6MWD) test, performed on a flat, straight, 30-meter corridor. The test was conducted under the supervision of an experienced physician who encouraged the patients to walk the corridor at their fastest rate from one end to the other as many times as possible. The distance walked in 6 minutes (6MWD) was expressed in meters.
For every patient, the body composition (muscle mass, fat mass, and total, intra-, and extracellular water content) was assessed by body bioelectrical impedance analysis. All the tests were performed by the same skilled physician, using a tetrapolar and multiple frequency equipment (4-channel bioimpedanciometer Bioscan MSR-916, Maltron International, Cambridge, England). Bioelectrical impedance analysis has been validated as a suitable method to determine body composition and has been well correlated with dual-energy x-ray absorptiometry. The method is based on the resistance encountered through water and the body tissues during low-intensity electric current passage. Two electrodes are placed on the palm and wrist and 2 on the foot sole and ankle; all are placed on the right side of the body.
All tests were performed within 5 days of inclusion at the Instituto Cardiovascular de Buenos Aires. The investigation complied with the principles outlined in the Declaration of Helsinki. The institutional ethical committee approved the protocol, and every participant provided signed informed consent.
The categorical variables are expressed as percentages and the continuous variables as the median and interquartile range. The relation between both LVEF and 6MWD and the various inflammatory and metabolic parameters was explored in 2 ways. First, we considered the LVEF and 6MWD as categorical variables. The LVEF and 6MWD were divided into quartiles. The values of the baseline variables in the different quartiles of LVEF or 6MWD were compared. The categorical variables were compared using the chi-square test or Fisher’s exact test, as indicated. Continuous variables were compared using the Kruskal-Wallis test. The p value for linear trend among the quartiles was also assessed. Second, we considered the LVEF and 6MWD as continuous variables. The linear relation between both LVEF and 6MWD and all studied variables was evaluated using simple linear regression analysis with determination of the β coefficient, SE, and p value. Continuous variables with a non-normal distribution were subjected to logarithmic transformation to include them in the linear regression analysis. To avoid possible confounding, the variables significant or with a trend on simple linear regression analysis (p ≤0.15) were adjusted for age, gender, and etiology (ischemic or nonischemic).
p Values <0.05 (2-tailed) were considered significant. Statistical analysis was performed using Stata, version 10 (StataCorp, College Station, Texas).
Results
The baseline characteristics of the patients are listed in Table 1 . The patients predominantly had New York Heart Association functional class II and III; 94 (62.3%) had been hospitalized because of heart failure at least once. The median LVEF and 6MWD was 29% and 290 m, respectively. Of the patients, 75% had a body mass index >25 kg/m 2 . The use rate of neurohormonal antagonists was high ( Table 1 ).
| Variable | Value |
|---|---|
| Men | 127 (84.1%) |
| Age (years) | 64 (56–73) |
| Hypertension | 80 (52.3%) |
| Diabetes mellitus | 38 (25.2%) |
| New York Heart Association class I–II | 108 (71.5%) |
| New York Heart Association class III–IV | 43 (28.5%) |
| Ischemic etiology | 80 (52.3%) |
| Heart rate (beats/min) | 70 (64–80) |
| Systolic blood pressure (mm Hg) | 110 (100–120) |
| Left ventricular ejection fraction | 29 (22–35) |
| 6-Minute walking distance (meters) | 290 (180–390) |
| Body mass index (kg/m 2 ) | 28.3 (25.1–31.6) |
| Diuretics | 119 (78.9%) |
| Digoxin | 35 (23.2%) |
| β Blockers | 137 (90.7%) |
| Angiotensin-converting enzyme inhibitors/angiotensin receptor blockers | 121 (80.3%) |
| Spironolactone | 94 (62.3%) |
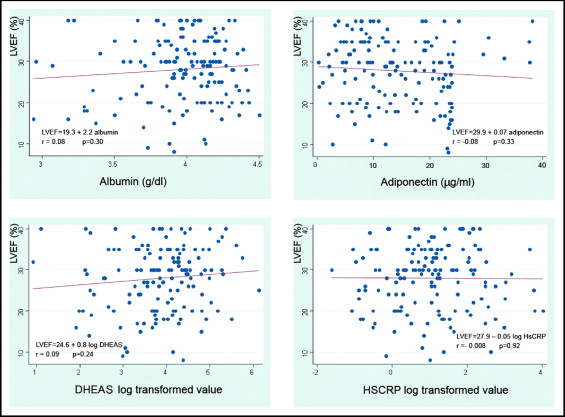
The stratified quartiles according to LVEF (quartile 1, 8% to 21%; quartile 2, 22% to 29%, quartile 3, 30% to 34%, and quartile 4, 35% to 40%) did not show any difference in 6MWD, gender, age, or etiology. When the biochemical and body composition parameters were considered, both N-terminal pro-brain natriuretic peptide and leptin showed significant differences, but the linear trend was statistically significant only for N-terminal pro-brain natriuretic peptide ( Table 2 ). On simple linear regression analysis, only N-terminal pro-brain natriuretic peptide was related to LVEF. This relation remained statistically significant after adjustment ( Table 3 ). The laboratory and body composition markers of inflammation and anabolic-catabolic imbalance were not related to LVEF ( Figure 1 ).
| Variable | Q1 (n = 37) | Q2 (n = 39) | Q3 (n = 34) | Q4 (n = 41) | p Value |
|---|---|---|---|---|---|
| Age (years) | 64 (54–72) | 65 (59–72) | 66 (59–73) | 63 (56–72) | 0.93 |
| Men | 75.7% | 89.7% | 79.4% | 90.2% | 0.20 |
| Ischemic etiology | 40.5% | 51.3% | 67.7% | 53.7% | 0.35 |
| 6-Minute walking distance (meters) | 280 (180–350) | 270 (190–400) | 250 (150–370) | 330 (250–390) | 0.24 |
| Hemoglobin (g/dl) | 13.7 (12.4–14.8) | 14.4 (13.5–14.8) | 13.7 (12.9–15.4) | 14.1 (13.4–14.9) | 0.19 |
| White blood cell count (1,000/mm 3 ) | 6.8 (6.3–8.2) | 7.3 (6.3–7.8) | 6.8 (5.9–8) | 7.8 (6.5–8.6) | 0.51 |
| Globular sedimentation rate (mm/s) | 10 (3.5–19.5) | 6 (4–20) | 10 (5–20) | 8 (4–21) | 0.93 |
| Glycemia (mg/dl) | 97 (87–111) | 101 (91–117) | 101 (91–119) | 99 (90–108) | 0.36 |
| Homeostasis model assessment of insulin resistance | 2.1 (1.1–3.7) | 2.4 (1.4–3.8) | 3.3 (1.7–5.1) | 2.4 (1.5–3.7) | 0.62 |
| Uric acid (mg/dl) | 6.8 (5.3–8.3) | 6.8 (5.1–7.4) | 6.4 (5.3–8.3) | 6.1 (5.2–7.6) | 0.84 |
| Albumin (g/ dl) | 4 (3.7–4.2) | 4.1 (3.9–4.2) | 4 (3.8–4.2) | 4 (3.9–4.2) | 0.42 |
| Cortisol (μg/dl) | 16.9 (13.8–19.3) | 16.4 (14–20.6) | 14.5 (12.7–19.1) | 15.8 (13.3–18.9) | 0.36 |
| Dehydroepiandrosterone sulphate (μg/dl) | 42.3 (21.1–72.3) | 50.5 (29.9–88.9) | 67.3 (39.8–86.1) | 54.7 (27–83.4) | 0.31 |
| High sensitivity C-reactive protein (mg/L) | 2.74 (1.09–5.34) | 2.84 (1.16–8.62) | 2.54 (1.68–4.1) | 2.85 (1.54–6.59) | 0.94 |
| N-terminal pro-brain natriuretic peptide (pg/ml) | 1,484 (947–3,274) | 1,113 (744–2,755) | 1,132 (352–1756) | 588 (174–956) | 0.001 ⁎ |
| Leptin (ng/ml) | 7 (3.7–11.5) | 6.4 (4.2–15) | 11.7 (6.3–17.5) | 7.6 (4.6–12) | 0.02 |
| Adiponectin (μg/ml) | 14.3 (8.6–23) | 14.8 (9.9–22) | 13.2 (6.5–20.6) | 9.6 (7.6–19.1) | 0.50 |
| Body mass index (kg/m 2 ) | 26.9 (23.8–32.1) | 27.7 (25.1–29.8) | 29.6 (26.8–33.7) | 29 (25.3–31.1) | 0.15 |
| Fat mass (%) | 28.7 (22.9–34.8) | 28.5 (24.3–32.6) | 32.9 (26–40.8) | 31.1 (25.2–33.5) | 0.08 |
| Muscle mass (%) | 34.3 (30.5–36.4) | 35.6 (33.4–37.5) | 34.8 (30.9–35.7) | 34.6 (33.4–36.6) | 0.22 |
| Variable | Simple Linear Regression Analysis | Adjusted Linear Regression Analysis | ||||
|---|---|---|---|---|---|---|
| β Coefficient | SE | p Value | β Coefficient | SE | p Value | |
| Hemoglobin (g/dl) | 0.57 | 0.39 | 0.15 | 0.50 | 0.43 | 0.24 |
| Homeostasis model assessment of insulin resistance | 0.51 | 0.35 | 0.14 | 0.51 | 0.36 | 0.17 |
| Log N-terminal pro-brain natriuretic peptide | −4.6 | 1.05 | <0.001 | −5.5 | 1.1 | <0.001 |
The quartiles of 6MWD (quartile 1, 30 to 170 m; quartile 2, 180 to 280 m; quartile 3, 290 to 380 m; and quartile 4, 390 to 610 m) did not differ with respect to LVEF, gender, or etiology. The patients in the lower quartiles were older, with significantly lower hemoglobin, albumin, and DHEAS values, and muscle mass proportion than the patients in the higher quartiles. In contrast, the N-terminal pro-brain natriuretic peptide and adiponectin values were greater in those in the lower quartiles. For all these variables, a linear tendency was verified. Also, a significant linear trend was found toward greater levels of hs-CRP in the patients in the lower 6MWD quartiles ( Table 4 ). On simple linear regression analysis, the 6MWD had a positive relation with hemoglobin, albumin, log transformation of DHEAS, and muscle mass proportion and a negative relation with age, adiponectin, and log transformations of hs-CRP and N-terminal pro-brain natriuretic peptide. Figure 2 illustrates the most relevant findings. After adjusting for age, gender, and etiology, the 6MWD relation with albumin, adiponectin, and the log transformations of DHEAS, hs-CRP, and N-terminal pro-brain natriuretic peptide remained statistically significant ( Table 5 ).
| Variable | Q1 (n = 37) | Q2 (n = 38) | Q3 (n = 38) | Q4 (n = 38) | p Value |
|---|---|---|---|---|---|
| Age (years) | 73 (67–77) | 66 (59–72) | 62.5 (53–69) | 58.5 (52–63) | <0.001 ⁎ |
| Men | 83.8% | 78.9% | 78.9% | 94.7% | 0.19 |
| Ischemic etiology | 43.2% | 52.6% | 55.3% | 60.5% | 0.50 |
| Left ventricular ejection fraction (%) | 30 (22–33) | 28 (29–32) | 30 (20–35) | 30 8 24–35) | 0.34 |
| Hemoglobin (g/dl) | 13.5 (12.4–14.6) | 14.1 (12.8–14.7) | 14.2 (13.2–15.5) | 14.2 (13.6–15) | 0.06 ⁎ |
| White blood cell count (1,000/mm 3 ) | 7.5 (5.9–8.6) | 6.8 (6.3–8.1) | 7.2 (6.4–8.4) | 6.8 (6–8) | 0.70 |
| Globular sedimentation rate (mm/s) | 11 (6–25) | 13 (3–20) | 6 (3–19) | 6 (5–12) | 0.20 |
| Glycemia (mg/dl) | 102 (87–124) | 101 (93–118) | 97 (87–111) | 98 (91–107) | 0.56 |
| Homeostasis model assessment of insulin resistance | 2.6 (1.4–5.1) | 2.1 (1.2–3.7) | 2.3 (1.5–3.6) | 2.6 (1.7–4.4) | 0.54 |
| Uric acid (mg/dl) | 7 (5.8–8.5) | 6.1 (4.5–7.2) | 6.6 (5–8.3) | 6.6 (5.3–7.4) | 0.35 |
| Albumin (g/dl) | 3.9 (3.7–4.1) | 4 (3.8–4.2) | 4 (3.8–4.2) | 4.1 (4–4.2) | <0.001 ⁎ |
| Cortisol (μg/dl) | 16.6 (13.2–19.3) | 16 (14.2–20.6) | 15.5 (11.5–19.3) | 16.3 (13.2–19) | 0.71 |
| Dehydroepiandrosterone sulphate (μg/dl) | 43.9 (14.3–70.3) | 50.2 (30.9–88.4) | 45.8 (27–80.7) | 69.8 (39–122.3) | 0.01 ⁎ |
| High-sensitivity C-reactive protein (mg/L) | 3.1 (2.01–8.08) | 3.01 (1.16–5.71) | 2.65 (1.54–6.59) | 1.95 (0.92–3.44) | 0.14 ⁎ |
| N-terminal pro-brain natriuretic peptide (pg/ml) | 1,967 (884–5,205) | 1,169 (760–2005) | 947 (652–1791) | 486 (153–1,123) | <0.001 ⁎ |
| Leptin (ng/ml) | 10.5 (5.2–15) | 7.1 (5.2–11) | 8 (6–15) | 5.6 (4.1–12) | 0.47 |
| Adiponectin (μg/ml) | 19.1 (9.3–23.6) | 12.9 (9.3–22.3) | 13.2 (7.6–20.6) | 8.4 (5.5–14.2) | <0.001 ⁎ |
| Body mass index (kg/m 2 ) | 27.9 (25–33.3) | 27.5 (24.4–30.8) | 28.9 (26–32.1) | 28.3 (26.2–30.8) | 0.90 |
| Fat mass (%) | 30.3 (25.1–35.7) | 29.5 (25.2–34.4) | 31.1 (25.9–35.4) | 28.6 (24.6–32) | 0.76 |
| Muscle mass (%) | 34.3 (31.2–36) | 34.5 (32.8–36.4) | 34.5 (31.4–35.8) | 36 (34.4–37.8) | 0.02 ⁎ |
Stay updated, free articles. Join our Telegram channel

Full access? Get Clinical Tree


