Hospitalization for heart failure (HF) is frequently related to dyspnea, yet associations among dyspnea severity, outcomes, and health care costs are unknown. The aim of this study was to describe the characteristics of patients hospitalized for acute HF by dyspnea severity and to examine associations among dyspnea severity, outcomes, and costs. Registry data for patients hospitalized for HF were linked with Medicare claims to evaluate dyspnea and outcomes in patients ≥65 years of age. We classified patients by patient-reported dyspnea severity at admission. Outcomes included length of stay, mortality 30 days after admission, days alive and out of the hospital, readmission, and Medicare payments 30 days after discharge. Of 48,616 patients with acute HF and dyspnea, 4,022 (8.3%) had dyspnea with moderate activity, 19,619 (40.3%) with minimal activity, and 24,975 (51.4%) at rest. Patients with dyspnea with minimal activity or at rest had greater co-morbidities, including renal insufficiency. Greater severity of baseline dyspnea was associated with mortality (moderate activity, 6.3%; minimal activity, 7.6%; at rest, 11.6%) and HF readmission (7.2%, 9.0%, and 9.4%). After multivariate adjustment, dyspnea at rest was associated with greater 30-day mortality and HF readmission, fewer days alive and out of the hospital, longer length of stay, and higher Medicare payments compared with dyspnea with moderate activity. In conclusion, dyspnea at rest on presentation was associated with greater mortality, readmission, length of stay, and health care costs in patients hospitalized with acute HF.
Highlights
- •
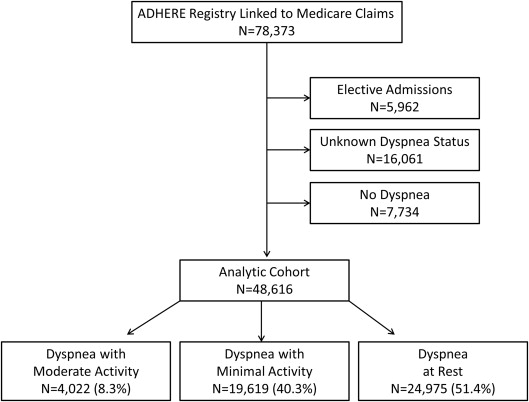
Of 48,616 patients with acute HF and dyspnea, 4,022 (8.3%) had dyspnea with moderate activity, 19,619 (40.3%) with minimal activity, and 24,975 (51.4%) at rest.
- •
Patients with dyspnea with minimal activity or at rest had greater co-morbidities, including renal insufficiency.
- •
Dyspnea severity, as assessed in clinical practice, is an independent predictor of outcomes and costs.
Heart failure (HF) is a common and costly condition and a leading cause of hospitalization worldwide. Many patients hospitalized with acute HF have dyspnea either at rest or with minimal exertion. Although dyspnea is a common presenting symptom, little is known about how it relates to patient outcomes. Investigations related to dyspnea in hospitalized patients with HF have focused primarily on symptom relief. Dyspnea relief has been used as an end point for establishing regulatory approval for therapies and in some analyses has been associated with improved outcomes. Notably, dyspnea relief has been linked with improved clinical outcomes in clinical trials of therapeutic agents, but in other trials, there has been a disconnect between dyspnea relief and clinical outcomes. Characteristics, outcomes, and associated costs in patients with acute HF in clinical practice have not been well characterized by baseline dyspnea severity.
Methods
We obtained hospitalization data from the Acute Decompensated Heart Failure National Registry (ADHERE) of patients hospitalized with acute HF. We linked the ADHERE data to Medicare inpatient and denominator files using methods described previously. We included patients ≥65 years of age who had registry hospitalizations for acute HF from January 1, 2001, to March 31, 2006, that were linked to fee-for-service Medicare claims data. Eligible patients lived in the United States at the time of the index admission and were enrolled in fee-for-service Medicare for ≥6 months before the index admission (n = 78,373). We excluded patients who were admitted on an elective basis (n = 5,962). Patients for whom dyspnea severity at admission was not documented in the registry (n = 16,061) and those who did not have dyspnea at admission (n = 7,734) were excluded from the analysis ( Figure 1 ). These excluded patients were generally similar to the study population ( Supplementary Table 1 ). Patients who died in the hospital, left against medical advice, or were discharged or transferred to another short-term hospital or hospice were excluded from the measurement of 30-day readmission and clinical status at discharge. Patients in the postdischarge cohort who enrolled in a Medicare managed care plan during the 30 days after discharge from the index hospitalization were excluded from the measurement of days alive and out of the hospital and Medicare payments.
The study variable of interest was dyspnea severity on admission (at the time of initial presentation). The dyspnea severity characterization in ADHERE was based on patients’ self-reported symptom severity (dyspnea with moderate activity, dyspnea with minimal activity, or dyspnea at rest) as obtained by the clinicians directly involved in their routine clinical care and as documented in the medical record. A specific research instrument or standardized questionnaire was not used. The outcomes of interest were mortality during the index hospitalization and at 30 days after admission, length of stay and clinical status at discharge, 30-day postdischarge days alive and out of the hospital, readmission (HF and all cause), and Medicare payments. We determined all-cause mortality on the basis of death dates in the Medicare denominator files. Length of stay and in-hospital mortality were based on Medicare claims for the index hospitalization. Clinical status at discharge was categorized as asymptomatic, improved but still symptomatic, or other or unknown, as recorded in the registry on the basis of patient report. Total days alive and out of the hospital in the 30 days after discharge were determined on the basis of the date of death in the Medicare denominator files and hospitalization dates in Medicare inpatient files. We identified readmission on the basis of subsequent inpatient Medicare claims. Readmission for HF was based on subsequent inpatient claims with a primary diagnosis of HF (International Classification of Diseases, Ninth Revision, diagnosis code 428.x, 402.x1, 404.x1, or 404.x3). We calculated time to readmission as the number of days from the index discharge date to the subsequent admission date. Medicare payments in the 30 days after discharge were determined on the basis of payments for inpatient, outpatient, and carrier claims. Payments were reported in 2010 United States dollars with inflation adjustment using the Consumer Price Index for medical care.
We described baseline characteristics of the study population by dyspnea severity at admission using frequencies with percentages for categorical variables and medians with interquartile ranges for continuous variables. We tested for differences between the groups using chi-square tests for categorical variables and Kruskal-Wallis tests for continuous variables. For variables that had low rates of missingness (i.e., <5% of records), we imputed continuous variables to the overall median value, dichotomous variables to “no,” and multichotomous variables to the most frequent categorical value. For variables with >5% missingness (i.e., smoking status, B-type natriuretic peptide level, race, and the ejection fraction), we treated the missing values as a separate category.
We present the observed outcomes by dyspnea severity at admission. For in-hospital mortality and clinical status at discharge, we tested for differences between groups using chi-square tests. For length of stay, days alive out of the hospital at 30 days, and Medicare payments at 30 days, we tested for differences between groups using Kruskal-Wallis tests. For 30-day mortality, we calculated cumulative incidence on the basis of Kaplan-Meier estimates and tested for differences between groups using log-rank tests. For readmission, we calculated cumulative incidence at 30 days on the basis of estimates from the cumulative incidence function, which accounts for the competing risk of mortality, and we tested for differences between groups using Gray tests.
We estimated the unadjusted and adjusted associations between dyspnea severity at admission and the outcomes of interest. In the unadjusted model, dyspnea severity was the only predictor. In the adjusted model, we controlled for baseline covariates, medications at discharge, and the year of the index admission. With the large number of events in each analysis, there was no overfitting problem with the adjustment variables. We used a linear mixed model for days alive out of the hospital at 30 days, Cox proportional-hazard models for 30-day mortality and readmission, generalized linear mixed models with a Poisson distribution and log link for Medicare payments, and a logistic regression model for in-hospital mortality. Finally, we assessed associations between other baseline covariates and dyspnea severity using a generalized logistic regression model. We report the estimated odds ratios associated with each characteristic for comparisons of the dyspnea categories. For all models, significance tests and confidence intervals were based on robust standard errors to account for the clustering of patients by hospital. Because of the large number of comparisons in the analysis, we used a 2-tailed α level of 0.01 to establish statistical significance, and we report 99% confidence intervals. We used SAS version 9.3 (SAS Institute Inc., Cary, North Carolina) for all analyses. The institutional review board of the Duke University Health System approved the study.
Results
Of 48,616 patients with acute HF and dyspnea, 4,022 (8.3%) had dyspnea with moderate activity, 19,619 (40.3%) had dyspnea with minimal activity, and 24,975 (51.4%) had dyspnea at rest. Thus, the group with dyspnea with moderate activity represented a comparatively lower percentage of the study population. Table 1 lists the baseline characteristics of the 3 groups. Patients with dyspnea at rest had more advanced chronic kidney disease (i.e., stages 3 to 5) than patients with dyspnea with moderate activity. The dyspnea at rest group also had the highest percentage of patients with baseline systolic blood pressure ≥140 mm Hg ( Supplementary Table 2 ).
| Characteristic | Dyspnea Severity | p Value | ||
|---|---|---|---|---|
| Moderate Activity (n = 4022) | Minimal Activity (n = 19,619) | At Rest (n = 24,975) | ||
| Age (years) | 79.6 (73.9-85.0) | 79.7 (73.9-85.1) | 80.1 (74.2-85.8) | < 0.001 |
| Men | 1864 (46.3%) | 8840 (45.1%) | 10,636 (42.6%) | < 0.001 |
| Race | < 0.001 | |||
| Black | 517 (12.9%) | 2,055 (10.5%) | 2745 (11.0%) | |
| White | 3304 (82.1%) | 16,181 (82.5%) | 20,430 (81.8%) | |
| Other/unknown | 201 (5.0%) | 1383 (7.0%) | 1800 (7.2%) | |
| Medical history | ||||
| Anemia | 2082 (51.8%) | 10,826 (55.2%) | 13,315 (53.3%) | < 0.001 |
| Atrial fibrillation | 1367 (34.0%) | 7264 (37.0%) | 8650 (34.6%) | < 0.001 |
| Coronary artery disease | 2375 (59.1%) | 12,059 (61.5%) | 15,217 (60.9%) | 0.02 |
| Chronic renal insufficiency | 949 (23.6%) | 5623 (28.7%) | 7095 (28.4%) | < 0.001 |
| Chronic obstructive pulmonary disease | 1128 (28.0%) | 6095 (31.1%) | 7965 (31.9%) | < 0.001 |
| Diabetes mellitus | 1522 (37.8%) | 8057 (41.1%) | 10,326 (41.3%) | 0.001 |
| Heart failure admission in prior 6 months | 487 (12.1%) | 2760 (14.1%) | 3706 (14.8%) | < 0.001 |
| Hyperlipidemia | 1511 (37.6%) | 7770 (39.6%) | 9216 (36.9%) | < 0.001 |
| Hypertension | 2982 (74.1%) | 14,777 (75.3%) | 18,786 (75.2%) | 0.28 |
| Myocardial infarction | 1168 (29.0%) | 6220 (31.7%) | 7977 (31.9%) | 0.001 |
| Peripheral vascular disease | 743 (18.5%) | 3804 (19.4%) | 4960 (19.9%) | 0.09 |
| Stroke or transient ischemic attack | 680 (16.9%) | 3582 (18.3%) | 4923 (19.7%) | < 0.001 |
| Smoker | < 0.001 | |||
| Never | 1832 (45.5%) | 8251 (42.1%) | 10,950 (43.8%) | |
| Former | 1551 (38.6%) | 7627 (38.9%) | 9286 (37.2%) | |
| Current | 307 (7.6%) | 1448 (7.4%) | 1909 (7.6%) | |
| Missing | 332 (8.3%) | 2293 (11.7%) | 2830 (11.3%) | |
| Devices | ||||
| Cardiac resynchronization therapy | 72 (1.8%) | 365 (1.9%) | 377 (1.5%) | 0.01 |
| Implantable cardioverter-defibrillator | 208 (5.2%) | 1143 (5.8%) | 1326 (5.3%) | 0.04 |
| Pacemaker | 738 (18.3%) | 3899 (19.9%) | 4613 (18.5%) | < 0.001 |
| Initial evaluation | ||||
| Ejection fraction | < 0.001 | |||
| ≥ 40% | 2007 (49.9%) | 9438 (48.1%) | 11,320 (45.3%) | |
| < 40% | 1417 (35.2%) | 7298 (37.2%) | 9318 (37.3%) | |
| Missing | 598 (14.9%) | 2883 (14.7%) | 4337 (17.4%) | |
| Fatigue | 1240 (30.8%) | 7475 (38.1%) | 8758 (35.1%) | < 0.001 |
| Pulmonary edema | 3385 (84.2%) | 17,224 (87.8%) | 22,931 (91.8%) | < 0.001 |
| Rales | 2632 (65.4%) | 13,805 (70.4%) | 19,266 (77.1%) | < 0.001 |
| Initial vital signs | ||||
| BNP level (pg/mL) | 739 (397-1307) | 839 (437-1440) | 924 (470-1540) | < 0.001 |
| Missing | 1705 (42.4%) | 8406 (42.8%) | 10,485 (42.0%) | |
| Pulse (bpm) | 82.0 (70.0-96.0) | 82.0 (70.0-98.0) | 86.0 (73.0-103) | < 0.001 |
| Systolic blood pressure (mm Hg) | 143 (124-165) | 142 (122-163) | 145 (124-168) | < 0.001 |
| Initial laboratory test results | ||||
| eGFR (mL/min/1.73 m 2 ) | 51.2 (36.0-67.3) | 48.2 (33.7-63.7) | 47.7 (33.3-63.6) | < 0.001 |
| Hemoglobin (g/dL) | 12.2 (10.9-13.5) | 12.1 (10.7-13.4) | 12.1 (10.8-13.5) | < 0.001 |
| Serum creatinine (mg/dL) | 1.3 (1.0-1.7) | 1.3 (1.0-1.8) | 1.3 (1.0-1.8) | < 0.001 |
| Serum sodium (mEq/L) | 139 (136-141) | 139 (136-141) | 139 (136-141) | 0.04 |
| Medication at discharge † | ||||
| ACE inhibitor or ARB | 2511 (63.8%) | 12,080 (63.6%) | 14,430 (61.3%) | < 0.001 |
| Aspirin | 1972 (50.1%) | 9222 (48.5%) | 11,297 (48.0%) | 0.05 |
| β-Blocker | 2329 (59.2%) | 11,476 (60.4%) | 14,057 (59.8%) | 0.26 |
| Clopidogrel | 510 (13.0%) | 2660 (14.0%) | 3366 (14.3%) | 0.08 |
| Diuretic | 2959 (75.2%) | 14,887 (78.3%) | 17,404 (74.0%) | < 0.001 |
| Lipid-lowering agent | 1482 (37.7%) | 6979 (36.7%) | 8233 (35.0%) | < 0.001 |
| Warfarin | 1126 (28.6%) | 5671 (29.8%) | 6286 (26.7%) | < 0.001 |
| Index hospitalization year | < 0.001 | |||
| 2001 | 86 (2.1%) | 549 (2.8%) | 743 (3.0%) | |
| 2002 | 1141 (28.4%) | 5605 (28.6%) | 7561 (30.3%) | |
| 2003 | 1353 (33.6%) | 6607 (33.7%) | 7914 (31.7%) | |
| 2004 | 980 (24.4%) | 5055 (25.8%) | 5917 (23.7%) | |
| 2005 | 420 (10.4%) | 1646 (8.4%) | 2597 (10.4%) | |
| 2006 | 42 (1.0%) | 157 (0.8%) | 243 (1.0%) | |
† Data are presented only for patients discharged alive, including 3933 patients with dyspnea with moderate activity, 19,006 patients with dyspnea with minimal activity, and 23,524 patients with dyspnea at rest.
Table 2 lists the observed outcomes on the basis of dyspnea severity at admission. Figure 2 shows the cumulative incidence of 30-day mortality and readmission on the basis of dyspnea severity at admission. There was a graded increase in the cumulative incidence of mortality from patients with dyspnea with moderate activity to patients with dyspnea with minimal activity to patients with dyspnea at rest. We observed similar trends for the readmission outcomes.
| Outcomes | Dyspnea With Moderate Activity (n = 4022) | Dyspnea With Minimal Activity (n = 19,619) | Dyspnea at Rest (n = 24,975) | p Value |
|---|---|---|---|---|
| Length of stay, median (IQR) (days) | 4.0 (3.0-6.0) | 4.0 (3.0-7.0) | 4.0 (3.0-7.0) | < 0.001 |
| In-hospital mortality | 89 (2.2%) | 613 (3.1%) | 1451 (5.8%) | < 0.001 |
| Discharged alive | 3731 (92.8%) | 18,149 (92.5%) | 22,143 (88.7%) | |
| Clinical status at discharge | < 0.001 | |||
| Asymptomatic | 2097 (56.2%) | 9074 (50.0%) | 10,856 (49.1%) | |
| Still symptomatic | 1390 (37.3%) | 7579 (41.8%) | 9371 (42.4%) | |
| Other/unknown | 242 (6.5%) | 1479 (8.2%) | 1895 (8.6%) | |
| Discharged alive, not censored at 30 days | 3729 (92.7%) | 18,132 (92.4%) | 22,122 (88.6%) | |
| Days alive and out of hospital at 30 days after discharge (days) | 30.0 (30.0-30.0) | 30.0 (29.0-30.0) | 30.0 (28.0-30.0) | < 0.001 |
| Mortality at 30 days ∗ | 254 (6.3%) | 1493 (7.6%) | 2888 (11.6%) | < 0.001 |
| All-cause readmission at 30 days after discharge † | 751 (20.1%) | 3974 (21.9%) | 5037 (22.8%) | < 0.001 |
| Heart failure readmission at 30 days † | 252 (7.2%) | 1527 (9.0%) | 1964 (9.4%) | < 0.001 |
| Medicare payments at 30 days after discharge ($) ‡ | 520 (253-2421) | 569 (264-3693) | 572 (268-4621) | < 0.001 |
∗ Presented as the number of patients (cumulative incidence per 100 patients at risk) who died within 30 days after admission to the index hospitalization.
† Presented as the number of patients (cumulative incidence per 100 patients at risk) who were readmitted within 30 days after discharge from the index hospitalization.
Stay updated, free articles. Join our Telegram channel

Full access? Get Clinical Tree


