Dosing of angiotensin-converting enzyme (ACE) inhibitors and angiotensin receptor blockers (ARBs) in patients with heart failure (HF) treated with cardiac resynchronization therapy (CRT) may affect long-term outcomes. Retrospective data were collected at baseline and follow-up for consecutive patients who had CRT implanted and attended the institutional specialist HF pacing clinic. The study end point was death from any cause or hospitalization for worsening HF 24 months after implantation. Ninety-one patients (72 men, 68 ± 12 years old) with decreased left ventricular ejection fraction (24 ± 6%) were included. At baseline 85 patients (93%) were on ACE inhibitors/ARBs. At 6 months 3 patients had died and 86 of 88 (98%) were on ACE inhibitors/ARBs. Doses were uptitrated from 55 ± 35% of target dose (TD) at baseline to 62 ± 31% TD at month 6 (p = 0.018), whereas blood pressure was unchanged. Patients treated with <50% TD of ACE inhibitors/ARBs (n = 20) at month 6 had worse 24-month event-free survival than those on 50% to 99% TD (n = 38, p = 0.011, log-rank test) or ≥100% TD (n = 30, p = 0.007, log-rank test). Failure to achieve a dose ≥50% TD of ACE inhibitors/ARBs at 6 months after CRT implantation was an independent predictor of all-cause mortality or hospitalization (hazard ratio 3.99, 95% confidence interval 1.66 to 9.62, p = 0.002) after adjustment for potential confounders including age, estimated glomerular filtration rate, diabetes and New York Heart Association class. In conclusion optimal dosing of ACE inhibitors/ARBs is an independent predictor of prognosis in patients with HF treated with CRT and it can be achieved by a structured follow-up within a specialized HF pacing clinic.
The purpose of the present study was to identify the extent to which angiotensin-converting enzyme (ACE) inhibitor or angiotensin receptor blocker (ARB) prescription doses change after cardiac resynchronization therapy (CRT) implantation and the maximal dosage achieved within the setting of a specialized heart failure (HF) pacing clinic in a tertiary cardiac center. An additional aim was to investigate whether there is a dose–response relation in outcomes within patients who have had a CRT implantation.
Methods
Data of consecutive patients who underwent implantation of a CRT pacemaker or defibrillator for standard indications (ejection fraction ≤35%, New York Heart Association class III to IV or II if they had an episode of acute decompensation in the previous 6 months, QRS duration ≥120 ms) at the Royal Brompton Hospital, London, United Kingdom from June 2005 to August 2009 were retrospectively analyzed. Only data of patients who were followed up at the dedicated HF pacing clinic were included in the final analysis. Patients were assessed at baseline and followed up at 1 month and 6 months after implantation according to the CRT pacing clinic protocol. At baseline medical treatments were revised and were optimized as possible. We defined the study end point as death from any cause or unplanned hospitalization because of worsening HF. Data on outcomes were retrospectively collected from patients’ charts. Events after 24 months were censored.
All statistical analyses were done using SPSS 16.0 for Windows (SPSS, Inc., Chicago, Illinois). Continuous variables were expressed as mean ± SD and categorical variables were expressed as absolute number and percentage. Differences in variables at months 1 and 6 compared to baseline were tested using analysis of variance for repeated measurements. Differences between groups were tested by Student’s t test or Mann–Whitney U test for normally and non-normally distributed variables, respectively. Fisher’s exact test was used for comparisons between categorical variables. Event-free survival of patients was evaluated by Kaplan–Meier analysis. Effect of various baseline and follow-up variables on survival was investigated by Cox regression analysis. Variables that had a p value ≤0.10 in univariate analysis were entered in a multivariate Cox proportional hazard model. Variables in the final model were selected by the backward stepwise method. At each step the least significant variable was discarded until all variables in the model had a p value <0.10. For all analyses a p value <0.05 was considered statistically significant.
Results
Ninety-one patients (mean age 68 ± 12 years, 72 men) were included in the study. Patients’ baseline characteristics are presented in Table 1 . At baseline 85 of 91 patients (93%) were on ACE inhibitors or ARBs. Six patients were not on any ACE inhibitor/ARB. In 3 of them (3.3% of total) ACE inhibitors/ARBs were previously prescribed but were not well tolerated because of at-rest and orthostatic hypotension. One of 91 patients (1.1%) was not on ACE inhibitors/ARBs because of severe renal failure (although on hemodialysis at the time of implantation); in the remaining 2 of 91 patients (2.2%) there was no identifiable contraindication or intolerance to ACE inhibitors or ARBs. An ACE inhibitor/ARB was prescribed at the baseline visit to the 2 patients who had no contraindication or intolerance and to the 1 patient on renal replacement therapy. To the 3 patients who were hypotensive, a small dose of ACE inhibitors/ARBs was introduced after CRT implantation and at month 6 all 3 were on an ACE inhibitor/ARB at doses of 25%, 37%, and 50% of target dose (TD), respectively. After 6 months of follow-up, all 6 patients initially not on ACE inhibitors/ARBs were still taking these agents and the doses had been successfully uptitrated.
| Variable | |
|---|---|
| Age (years) | 68 ± 12 |
| Age >75 years | 27 (30%) |
| Men/women | 72 (79%)/19 (21%) |
| Cardiac resynchronization therapy—pacemaker/defibrillator | 25 (27%)/66 (73%) |
| Ischemic cause | 51 (56%) |
| Atrial fibrillation | 24 (26%) |
| Diabetes mellitus | 20 (22%) |
| Hypertension | 25 (27%) |
| Left ventricular ejection fraction (%) | 24 ± 6 |
| New York Heart Association class | 2.9 ± 0.5 |
| QRS duration (ms) | 168 ± 25 |
| Left ventricular end-diastolic diameter (cm) | 6.8 ± 1.1 |
| Left ventricular end-systolic diameter (cm) | 5.8 ± 1.1 |
| Systolic blood pressure (mm Hg) | 115 ± 19 |
| Diastolic blood pressure (mm Hg) | 70 ± 11 |
| Urea (mmol/L) | 10 ± 6 |
| Creatinine (μmol/L) | 130 ± 51 |
| Estimated glomerular filtration rate (ml/min/1.73 m 2 ) | 52 ± 26 |
| Estimated glomerular filtration rate <30 | 10 (11%) |
| Brain natriuretic peptide (pmol/L) | 125 ± 118 |
| Angiotensin-converting enzyme inhibitors/angiotensin receptor blockers | 85 (93%) |
| β Blockers | 61 (67%) |
| Aldosterone antagonists | 58 (64%) |
| Loop diuretics | 74 (81%) |
| Thiazides | 7 (8%) |
| Digoxin | 18 (20%) |
After 6 months of follow-up, 3 patients had died. Of the remaining 88 patients, 86 were on ACE inhibitors/ARBs (98%). In 1 patient the ACE inhibitor was stopped because of worsening renal failure (estimated glomerular filtration rate 25 ml/min/1.73 m 2 ) and in the other patient the ACE inhibitor was temporarily stopped because of hyperkalemia but later a smaller dose of perindopril was restarted.
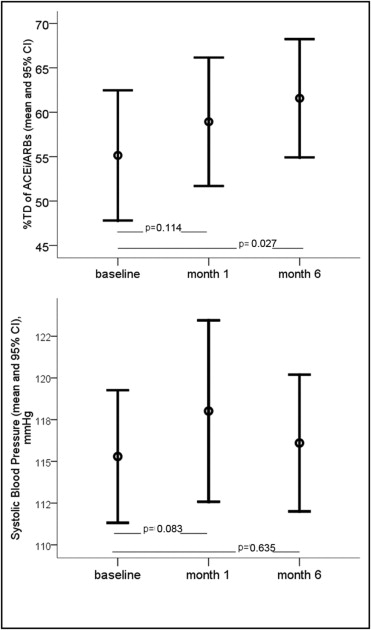
Overall, daily doses of ACE inhibitors/ARBs were uptitrated during follow-up, from a mean of 55 ± 35% TD at baseline to 59 ± 30% TD at month 1 (p = 0.114) and 62 ± 31% TD at month 6 (p = 0.027 compared to baseline). Systolic blood pressure showed a trend toward an increase 1 month after CRT implantation (from 115 ± 19 mm Hg at baseline to 118 ± 28 mm Hg, p = 0.083) and despite ACE inhibitor/ARB uptitration it remained unchanged at month 6 compared to baseline (116 ± 19 at month 6, p = 0.635). Changes in ACE inhibitor/ARB doses and in systolic blood pressure are presented in Figure 1 . The prescribed agents, their TDs, and doses achieved at baseline and follow-up are presented in Table 2 . ACE inhibitors were successfully uptitrated in most cases, whereas dosing of ARBs did not change significantly.
| TD (mg) | Baseline | Month 6 | |||||
|---|---|---|---|---|---|---|---|
| Patients | Mean Dose Achieved | Mean Percent TD Achieved | Patients | Mean Dose Achieved | Mean Percent TD Achieved | ||
| (n = 91) | (n = 88) | ||||||
| Angiotensin-converting enzyme inhibitors | |||||||
| Ramipril | 10 | 26 (28%) | 6 ± 3 | 61 ± 33 | 25 (28%) | 8 ± 3 | 77 ± 31 |
| Perindopril | 8 | 21 (23%) | 5 ± 2 | 57 ± 26 | 22 (24%) | 5 ± 2 | 64 ± 26 |
| Lisinopril | 20 | 8 (9%) | 19 ± 11 | 93 ± 53 | 5 (5%) | 12 ± 5 | 70 ± 27 |
| Enalapril | 20 | 1 (1%) | 20 ± 0 | 100 ± 0 | 1 (1%) | 20 ± 0 | 100 ± 0 |
| Total | 56 (62%) | 64 ± 35 | 53 (58%) | 71 ± 27 ⁎ | |||
| Angiotensin receptor blockers | |||||||
| Candesartan | 32 | 17 (19%) | 16 ± 8 | 48 ± 26 | 23 (25%) | 16 ± 9 | 50 ± 28 |
| Losartan | 100 | 9 (10%) | 61 ± 22 | 60 ± 21 | 7 (8%) | 59 ± 26 | 59 ± 26 |
| Valsartan | 320 | 2 (2%) | 60 ± 28 | 19 ± 9 | 2 (2%) | 40 ± 0 | 12.5 ± 0 |
| Irbesartan | 300 | 1 (1%) | 75 | 25 | 1 (1%) | 150 ± 0 | 50 ± 0 |
| Total | 29 (32%) | 50 ± 26 | 33 (36%) | 50 ± 28 † | |||
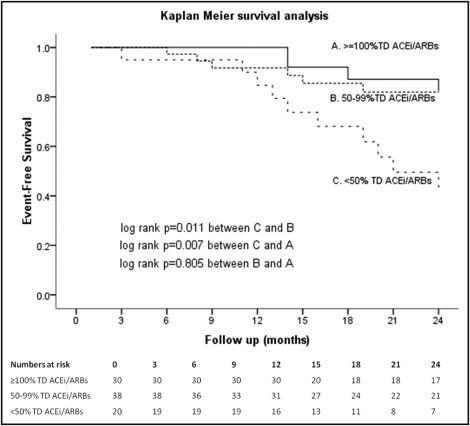
The primary end point of death from any cause or hospitalization because of worsening HF at 24 months was reached by 23 of 91 patients (25.3%). Mean time to the primary end point for the cohort of 91 patients was 13.2 ± 6.6 months. Of the 88 patients that were alive at month 6, mean time to the primary end point was 21.6 months (95% confidence interval [CI] 20.5 to 22.7). Kaplan–Meier analysis ( Figure 2 ) showed that patients who were on <50% TD of an ACE inhibitor or ARB at month 6 had a worse event-free survival (19.3 months, 95% CI 16.5 to 22.1, vs 21.9 months, 95% CI 20.3 to 23.5, p = 0.011 for patients on 50% to 99% TD and 22.9 months, 95% CI 21.6 to 24.3, p = 0.007 for patients on ≥100% TD). Event-free survival of patients on 50% to 99% TD did not differ significantly from that of patients on ≥100% TD (p = 0.805). Patients receiving <50% TD of ACE inhibitors/ARBs at month 6 tended to be older, more frequently had ischemic heart disease, had lower estimated glomerular filtration rate at baseline, showed lower rates of clinical response to CRT, and their New York Heart Association functional class was higher at 6 months after implantation ( Table 3 ). Univariate and multivariate analyses of baseline and follow-up variables using a Cox proportional hazard model is presented in Table 4 . Multivariate analysis showed that treatment with <50% TD of ACE inhibitors/ARBs at month 6 after implantation is a strong independent predictor of worse outcome (hazard ratio 3.99, 95% CI 1.66 to 9.62, p = 0.002). Event-free survival of patients on <50% or ≥50% TD of ACE inhibitors/ARBs at month 6 adjusted for age, diabetes mellitus, estimated glomerular filtration rate at baseline, New York Heart Association class at month 6, clinical response, and ACE inhibitor/ARB dose at baseline is illustrated in Figure 3 .
| Variable | Patients Receiving ≥50% TD of ACE Inhibitors/ARBs 6 Months After Implantation | Patients Receiving <50% TD of ACE Inhibitors/ARBs 6 months After Implantation | p Value |
|---|---|---|---|
| (n = 68) | (n = 20) | ||
| Age (years) | 67 ± 13 | 72 ± 6 | 0.063 |
| Men | 56 (82%) | 14 (70%) | 0.343 |
| Cardiac resynchronization therapy—pacemaker/defibrillator | 29%/71% | 19%/81% | 0.531 |
| Ischemic cause | 33 (48%) | 16 (80%) | 0.020 |
| Atrial fibrillation | 17 (25%) | 4 (20%) | 0.807 |
| Diabetes mellitus | 12 (18%) | 7 (35%) | 0.124 |
| Hypertension | 20 (29%) | 5 (25%) | 0.785 |
| New York Heart Association class | |||
| Baseline | 2.9 ± 0.6 | 2.8 ± 0.5 | 0.397 |
| 6 Months | 1.8 ± 0.5 | 2.3 ± 0.6 | 0.001 |
| Clinical response | 50 (73%) | 8 (40%) | 0.022 |
| Left ventricular ejection fraction baseline (%) | 24 ± 6 | 24 ± 6 | 0.819 |
| QRS duration baseline (ms) | 167 ± 24 | 165 ± 29 | 0.651 |
| Brain natriuretic peptide baseline (pmol/L) | 105 ± 86 | 171 ± 184 | 0.274 |
| Glomerular filtration rate (ml/min/1.73 m 2 ) | |||
| Baseline | 56 ± 27 | 42 ± 19 | 0.032 |
| 6 Months | 56 ± 26 | 49 ± 22 | 0.338 |
| Systolic blood pressure at 6 months (mm Hg) | 116 ± 19 | 115 ± 21 | 0.714 |
| Diastolic blood pressure at 6 months (mm Hg) | 71 ± 12 | 70 ± 9 | 0.795 |
| β Blockers at 6 months | 55 (81%) | 15 (75%) | 0.544 |
| Variable | Univariate Analysis | Multivariate Analysis | ||||
|---|---|---|---|---|---|---|
| HR | 95% CI | p Value | HR | 95% CI | p Value | |
| Age (by year increase) | 1.036 | 0.992–1.082 | 0.109 | 1.043 | 0.987–1.102 | 0.133 |
| Male gender | 1.291 | 0.509–3.277 | 0.590 | |||
| Ischemic cause | 1.199 | 0.519–2.770 | 0.671 | |||
| New York Heart Association class (by 1-class increase) | 1.043 | 0.475–2.291 | 0.916 | |||
| Atrial fibrillation | 1.688 | 0.715–3.984 | 0.232 | |||
| Diabetes | 2.337 | 0.928–5.882 | 0.072 | 1.933 | 0.780–4.794 | 0.155 |
| Hypertension | 1.866 | 0.804–4.327 | 0.146 | |||
| QRS duration (by 1-ms increase) | 0.995 | 0.979–1.012 | 0.582 | |||
| Left ventricular ejection fraction (by 1% increase) | 0.987 | 0.919–1.059 | 0.711 | |||
| Left ventricular end-diastolic diameter (by 1-cm increase) | 0.964 | 0.668–1.391 | 0.844 | |||
| Left ventricular end-systolic diameter (by 1-cm increase) | 0.931 | 0.642–1.350 | 0.706 | |||
| Angiotensin-converting enzyme inhibitors/angiotensin receptor blockers | ||||||
| Percent target dose at baseline (by 1% increase) | 0.987 | 0.974–1.000 | 0.049 | 0.990 | 0.974–1.006 | 0.205 |
| <50% target dose at month 6 | 3.758 | 1.561–9.047 | 0.003 | 3.994 | 1.658–9.621 | 0.002 |
| Glomerular filtration rate baseline (by 1-ml/min increase) | 0.981 | 0.959–1.003 | 0.094 | 0.993 | 0.967–1.020 | 0.603 |
| New York Heart Association class at month 6 (by 1-class increase) | 1.825 | 0.971–3.431 | 0.062 | 1.303 | 0.614–2.747 | 0.491 |
| Clinical response at month 6 | 0.447 | 0.186–1.076 | 0.072 | 0.852 | 0.289–2.510 | 0.771 |
| β Blockers (any dose) at baseline | 1.058 | 0.448–2.500 | 0.897 | |||
| β Blockers (any dose) at month 6 | 0.618 | 0.237–1.607 | 0.323 | |||
| β Blockers >50% target dose at month 6 | 0.682 | 0.346–2.001 | 0.682 | |||
| Aldosterone antagonist at month 6 | 0.646 | 0.269–1.554 | 0.329 | |||
Stay updated, free articles. Join our Telegram channel

Full access? Get Clinical Tree


