Statins may have nephroprotective as well as cardioprotective effects in patients with cardiovascular disease. In the Treating to New Targets (TNT) study (NCT00327691), patients with coronary heart disease (CHD) were randomized to atorvastatin 10 or 80 mg/day and followed for 4.9 years. The relation between intrastudy change in estimated glomerular filtration rate (eGFR) from baseline and the risk of major cardiovascular events (MCVEs, defined as CHD death, nonfatal non–procedure-related myocardial infarction, resuscitated cardiac arrest, or fatal or nonfatal stroke) was assessed among 9,500 patients stratified by renal function: improving (change in eGFR more than +2 ml/min/1.73 m 2 ), stable (−2 to +2 ml/min/1.73 m 2 ), and worsening (less than −2 ml/min/1.73 m 2 ). Compared with patients with worsening renal function (1,479 patients, 15.6%), the rate of MCVEs was 28% lower in patients with stable renal function (2,241 patients, 23.6%) (hazard ratio [HR] 0.72; 95% confidence interval [CI] 0.60 to 0.87; p = 0.0005) and 64% lower in patients with improving renal function (5,780 patients, 60.8%; HR 0.36; 95% CI 0.30 to 0.43; p <0.0001). For each 1 ml/min/1.73 m 2 increase in eGFR, the absolute reduction in the rate of MCVEs was 2.7% (HR 0.973; 95% CI 0.967 to 0.980; p <0.0001). An absolute MCVE rate reduction per 1 ml/min/1.73 m 2 increase in eGFR of 2.0% was reported with atorvastatin 10 mg and 3.3% with atorvastatin 80 mg. In conclusion, intrastudy stabilization or increase in eGFR in atorvastatin-treated patients with CHD from the TNT study was associated with a reduced rate of MCVEs. Statin-treated CHD patients with progressive renal impairment are at high risk for future cardiovascular events.
Cardiovascular disease (CVD) is associated with a progressive decrease in renal function and development of chronic kidney disease (CKD). Additionally, rapid declines in renal function correlate with increased cardiovascular (CV) mortality, independent of baseline estimated glomerular filtration rate (eGFR). Therefore, change in eGFR over time may be a more potent predictor of CV outcomes than baseline renal function in patients with CVD. Clinical trials in patients with CVD or its risk factors have suggested that statins may stabilize or improve renal function. However, the relation between statin-associated stabilization or improvement of renal function and CV outcomes has not been analyzed. In post hoc analyses of the Treating to New Targets (TNT) study, we noted dose-dependent improvements in renal function and significant reductions in CV events in atorvastatin-treated patients with coronary heart disease (CHD) with or without CKD. Here, we examined the effect of atorvastatin on renal function over time to assess the relation between directional change in eGFR and new CV events.
Methods
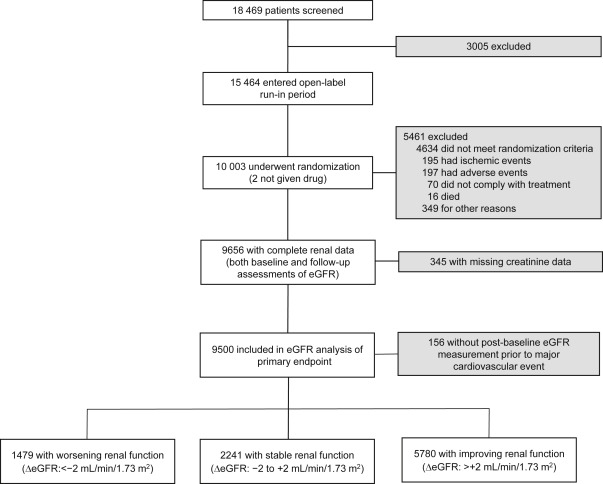
The TNT study was a prospective, double-blind, parallel-group study conducted from April 1998 to August 2004. Eligible patients were men and women aged 35 to 75 years with clinically evident CHD, defined as previous myocardial infarction (MI), angina with objective evidence of atherosclerotic CHD, or previous coronary revascularization procedure. Patients with nephrotic syndrome were excluded. No protocol-specific exclusions were based on kidney function or baseline creatinine concentration, although such exclusions could occur at the investigator’s discretion. After an 8-week open-label treatment period with atorvastatin 10 mg/day (baseline), patients with a mean low-density lipoprotein cholesterol (LDL-C) ≤3.4 mmol/L (130 mg/dl) were randomized to atorvastatin 10 or 80 mg/day ( Figure 1 ).
Only those patients with both a baseline and at least 1 post-baseline serum creatinine measurement were included in this post hoc analysis. Serum creatinine levels were measured at baseline and after 12, 24, 36, 48, 60, and 72 months of treatment using the modified alkaline picrate method of Jaffé. Samples were analyzed by a central study laboratory blinded to treatment assignment. Standards by the College of American Pathologists were used for internal quality assurance and external calibration and validation to ensure accuracy and reproducibility of the creatinine measurement throughout the study. To provide consistency with previous renal analyses of the TNT data, eGFR was determined using the 4-component Modification of Diet in Renal Disease (MDRD) equation and staged according to Kidney Disease Outcomes Quality Initiative guidelines.
We used a last observation carried forward (LOCF) analysis to determine the final eGFR measurement. On-treatment change in eGFR was stratified into 1 of 3 categories based on predefined clinical classifications of change in renal function over time: improving (change in eGFR more than +2 ml/min/1.73 m 2 ), stable (−2 to +2 ml/min/1.73 m 2 ), or worsening (less than −2 ml/min/1.73 m 2 ). The primary efficacy outcome was time to occurrence of a major cardiovascular event (MCVE; CHD death, nonfatal non–procedure-related MI, resuscitated cardiac arrest, or fatal or nonfatal stroke). The relation between change in eGFR and MCVEs was assessed by a multivariable and time-dependent Cox proportional hazards model, which included change from baseline to the end of study or last available eGFR (continuous scale) as the time-dependent independent variable adjusting for baseline factors including eGFR, age, gender, smoking status, body mass index (BMI), LDL-C, and history of hypertension (or antihypertensive use), diabetes (or antidiabetic medication use), coronary artery bypass graft (CABG) surgery, percutaneous coronary intervention, angina, cerebrovascular disease, peripheral vascular disease (PVD), congestive heart failure, and arrhythmia. We also carried out 2 additional Cox proportional hazards analyses: a multivariable model that included change in eGFR from baseline to year 1 and a time-dependent model that included all changes in eGFR from baseline to the first event or end of study as the time-dependent independent variable. Both models adjusted for baseline eGFR, change in LDL-C, and treatment. Comparisons of baseline characteristics were based on 1-way analysis of variance with pairwise comparison for continuous variables, and Fisher’s exact test for overall test and logistic regression analysis with pairwise comparisons for categorical variables. Changes in eGFR from baseline to final measurement were compared by an analysis of covariance model adjusting for baseline eGFR. A similar model compared change from baseline to month 3 in LDL-C, high-density lipoprotein cholesterol (HDL-C), and triglycerides. Hazard ratios (HRs) and 95% confidence intervals (CIs) were calculated using a Cox proportional hazards model. Two-sided log-rank p values <0.05 were regarded as significant. All analyses were performed using SAS (version 9.12 or later).
Results
In TNT, 10,001 patients were randomly assigned to double-blind treatment with either atorvastatin 10 or 80 mg/day with a median follow-up of 4.9 years. Of the 9,656 patients with both baseline and post-baseline eGFR measurements, 67.8% (n = 6,549) had an eGFR ≥60 ml/min/1.73 m 2 , whereas 32.2% (n = 3,107) had an eGFR <60 ml/min/1.73 m 2 (predominantly CKD stage 3); the baseline characteristics of this TNT renal cohort have been previously reported. A total of 156 patients experienced an MCVE before the first post-baseline eGFR assessment and were excluded, leaving 9,500 patients eligible for this analysis ( Figure 1 ).
In this TNT renal subgroup, 417 patients (8.8%) receiving atorvastatin 10 mg and 340 patients (7.1%) receiving atorvastatin 80 mg experienced an MCVE, corresponding to a 19% reduction in MCVE risk in patients receiving atorvastatin 80 versus 10 mg (HR 0.81; 95% CI 0.70 to 0.93; p = 0.0030). Mean (±SD) eGFR at baseline was 65.6 ± 11.4 ml/min/1.73 m 2 in the atorvastatin 10-mg group and 65.0 ± 11.2 ml/min/1.73 m 2 in the atorvastatin 80-mg group. As seen in the total TNT renal cohort, mean eGFR increased progressively from baseline in both treatment groups. Overall, mean eGFR rose from 65.3 ± 11.3 ml/min/1.73 m 2 at baseline to 69.7 ± 14.6 ml/min/1.73 m 2 at study end, an increase of 4.4 ± 9.8 ml/min/1.73 m 2 (+6.7%) and a shift toward higher eGFR values with a broader distribution, as shown for the total renal cohort ( Figure 2 ). Mean eGFR increased by 3.6 ± 9.8 ml/min/1.73 m 2 (+5.5%) in the atorvastatin 10-mg arm and 5.2 ± 9.8 ml/min/1.73 m 2 (+8.0%) in the atorvastatin 80-mg arm. The difference in least-squares mean change in eGFR from baseline between the treatment groups of 1.6 ml/min/1.73 m 2 was significant (95% CI 1.20 to 1.99; p <0.0001). In the total TNT renal cohort (n = 9,656), this increase in eGFR was observed in both treatment groups regardless of baseline CKD status.

In the present analysis (n = 9,500), change from baseline eGFR was significantly associated with MCVEs, major coronary events, all-cause, and CV mortality. Overall, a 1 ml/min/1.73 m 2 increase in eGFR was associated with a 2.7% absolute reduction in the rate of MCVEs (HR 0.973; 95% CI 0.967 to 0.980; p <0.0001). Results from the 1-year eGFR change sensitivity analysis had a lower level of predictability and a marginally insignificant effect (HR per 1 ml/min/1.73 m 2 increase, 0.990; 95% CI 0.979 to 1.002; p = 0.090). Using the time-dependent model, changes in renal function significantly predicted MCVEs (HR per 1 ml/min/1.73 m 2 increase, 0.965; 95% CI 0.959 to 0.972; p <0.001) to a similar extent as the original model.
Change in eGFR was associated with CV end points for both atorvastatin 10- and 80-mg treatments, but the reduction in the rate of events associated with increasing eGFR was significantly greater in patients receiving atorvastatin 80 mg (absolute event rate reduction per 1 ml/min/1.73 m 2 increase in eGFR: 2.0% with atorvastatin 10 mg; 3.3% with atorvastatin 80 mg; interaction p = 0.0107). This corresponds to a 7.1% absolute reduction in MCVE rate for the observed increase of 3.6 ml/min/1.73 m 2 in eGFR with atorvastatin 10 mg and a 16.2% reduction in MCVE rate for the 5.2 ml/min/1.73 m 2 increase in eGFR with atorvastatin 80 mg.
Classification of the directional change in eGFR (baseline to last observation) identified 1,479 patients (15.6%) with worsening renal function, 2,241 patients (23.6%) with stable renal function, and 5,780 patients (60.8%) with improving renal function over 5 years of follow-up. Subjects with worsening renal function were significantly older and more likely women, and had a higher BMI, greater likelihood of hypertension or diabetes, and higher prevalence of CABG, PVD, and cerebrovascular disease at baseline than those with stable or improving renal function ( Table 1 ).
| Baseline characteristic (at randomization) | Change in estimated glomerular filtration rate (ml/min/1.73 m 2 ) | ||
|---|---|---|---|
| Worsening (<−2) (n=1479) | Stable (−2 to +2) (n=2241) | Improving (>+2) (n=5780) | |
| Men | 1113 (75%) | 1761 (79%) ∗ | 4829 (84%) ∗ |
| Mean age (years) | 63.5±8.8 | 61.2±8.8 ∗ | 60.3±8.7 ∗ |
| White | 1378 (93%) | 2100 (94%) | 5471 (95%) ∗ |
| Current smoker | 201 (14%) | 322 (14%) | 713 (12%) |
| Systolic blood pressure (mmHg) | 135.1±18.1 | 131.2±16.5 ∗ | 129.3±16.3 ∗ |
| Diastolic blood pressure (mmHg) | 78.1±9.7 | 78.0±9.5 | 77.9±9.4 |
| Low-density lipoprotein cholesterol (mmol/l [mg/dl]) | 2.52±0.46 [97.6±17.6] | 2.51±0.44 [97.0±17.2] | 2.52±0.46 [97.6±17.6] |
| High-density lipoprotein cholesterol (mmol/l [mg/dl]) | 1.22±0.30 [47.2±11.5] | 1.24±0.28 [47.9±10.9] ∗ | 1.22±0.28 [47.2±10.8] |
| Total cholesterol (mmol/l [mg/dl]) | 4.54±0.64 [175.4±24.6] | 4.50±0.60 [173.9±23.1] | 4.52±0.62 [174.7±23.8] |
| Triglycerides (mmol/l [mg/dl]) | 1.74±0.83 [154.3±73.4] | 1.65±0.77 [146.1±68.4] ∗ | 1.70±0.79 [150.3±69.6] ∗ |
| MDRD estimated glomerular filtration rate (ml/min/1.73 m 2 ) | 65.0±13.7 | 68.3±11.1 ∗ | 64.2±10.5 ∗ |
| Body mass index (kg/m 2 ) | 29.1±5.1 | 28.4±4.7 ∗ | 28.4±4.3 ∗ |
| Chronic kidney disease † | 542 (37%) | 529 (24%) ∗ | 1978 (34%) |
| Angina pectoris | 1214 (82%) | 1805 (81%) | 4725 (82%) |
| Myocardial infarction | 864 (58%) | 1294 (58%) | 3352 (58%) |
| Coronary angioplasty | 762 (52%) | 1211 (54%) | 3170 (55%) ∗ |
| Coronary artery bypass graft | 779 (53%) | 1039 (46%) ∗ | 2588 (45%) ∗ |
| Hypertension | 995 (67%) | 1220 (54%) ∗ | 2918 (50%) ∗ |
| Diabetes mellitus | 388 (26%) | 300 (13%) ∗ | 706 (12%) ∗ |
| Peripheral vascular disease | 272 (18%) | 260 (12%) ∗ | 571 (10%) ∗ |
| Congestive heart failure | 215 (15%) | 151 (7%) ∗ | 349 (6%) ∗ |
| Cerebrovascular disease | 109 (7%) | 117 (5%) ∗ | 252 (4%) ∗ |
∗ p <0.05 versus patients with worsening renal function.
Mean eGFR in patients whose renal function worsened was significantly lower at baseline versus those whose renal function remained stable but significantly higher than those with improving renal function ( Table 2 ). A higher proportion of patients with improving renal function, and a lower proportion of those with worsening or stable renal function, were assigned to atorvastatin 80 mg, and this trend was significant across renal subgroups ( Table 2 ). Compared with the subgroup with worsening renal function, the relative risk of MCVEs was 28% lower in patients with stable renal function and 64% lower in patients with improving renal function ( Table 2 ; Figure 3 ). We confirmed these results using a predictive analysis using year 1 change in eGFR ( Figure 4 ).
| Change in estimated glomerular filtration rate (ml/min/1.73 m 2 ) | |||||
|---|---|---|---|---|---|
| Worsening (<−2) (n=1479) | Stable (−2 to +2) ∗ (n=2241) | Improving (>+2) ∗ (n=5780) | |||
| Number (%) of patients with primary end point | 208 (14.1%) | 235 (10.5%) | 314 (5.4%) | ||
| Hazard ratio (95% confidence interval) for primary end point | 1.00 | 0.72 (0.60, 0.87) | p=0.0005 | 0.36 (0.30, 0.43) | p<0.0001 |
| Serum creatinine (μmol/l [mg/dl]) | |||||
| Baseline | 104.3±22.1 [1.18±0.25] | 99.9±15.9 [1.13±0.18] | p<0.0001 | 107.0±16.8 [1.21±0.19] | p<0.0001 |
| Change from baseline † | 20.3±31.8 [0.23±0.36] | –0.18±4.24 [–0.002±0.048] | p<0.0001 | –14.1±8.0 [–0.16±0.09] | p<0.0001 |
| Estimated glomerular filtration rate (ml/min/1.73 m 2 ) | |||||
| Baseline | 65.0±13.7 | 68.3±11.1 | p<0.0001 | 64.2±10.5 | p=0.0203 |
| Change from baseline ‡ | –10.9±6.9 | –0.98±0.41 | p<0.0001 | 10.3±5.9 | p <0.0001 |
| Lipids: Change from baseline (mmol/l [mg/dl]) § | |||||
| Low-density lipoprotein cholesterol | –0.25±0.55 [–9.7±21.3] | –0.26±0.53 [–10.1±20.5] | p=0.2892 | –0.34±0.55 [–13.1±21.3] | p<0.0001 |
| High-density lipoprotein cholesterol | –0.001±0.147 [–0.04±5.68] | 0.005±0.142 [0.19±5.49] | p=0.0906 | –0.004±0.139 [–0.15±5.38] | p=0.5485 |
| Triglycerides | –0.08±0.57 [–7.1±50.4] | –0.09±0.60 [–8.0±53.1] | p=0.0728 | –0.14±0.59 [–12.4±52.2] | p<0.0001 |
| Atorvastatin 10 mg | 833 (56.3%) | 1185 (52.9%) | 2719 (47.0%) | ||
| Atorvastatin 80 mg | 646 (43.7%) | 1056 (47.1%) | 3061 (53.0%) | ||
| Overall p-value (trend) ¶ | p<0.0001 | ||||
Stay updated, free articles. Join our Telegram channel

Full access? Get Clinical Tree


