We used virtual histology and intravascular ultrasound (VH-IVUS) to evaluate the relation between aortic knob calcium (AKC) and plaque components in diabetic patients. The presence of AKC was assessed by posteroanterior view of chest x-ray or fluoroscopy at the time of coronary angiography. A total of 137 de novo coronary culprit lesions in 137 consecutive diabetic patients were studied and coronary plaque components were analyzed using VH-IVUS according to the presence (n = 45) or absence (n = 92) of AKC. Patients with AKC were significantly older (68 ± 8 vs 62 ± 9 years, p <0.001) and had significantly higher high-sensitivity C-reactive protein levels (1.97 ± 1.33 vs 0.48 ± 1.35 mg/dl, p = 0.005) compared to patients without AKC. Absolute and percent necrotic core (NC) volumes (30 ± 26 vs 20 ± 19 mm 3 , p = 0.003; 23.4 ± 10.3% vs 17.4 ± 8.9%, p = 0.005, respectively) and absolute and percent dense calcium (DC) volumes (17 ± 12 vs 11 ± 12 mm 3 , p = 0.010; 13.3 ± 7.3% vs 9.6 ± 7.9%, p = 0.011, respectively) were significantly greater in lesions with AKC compared to those without AKC. Multivariable analysis showed that age (odds ratio [OR] 1.233, 95% confidence interval [CI] 1.121 to 1.355, p <0.001), high-sensitivity C-reactive protein (OR 1.871, 95% CI 1.090 to 2.943, p = 0.007), absolute DC volume (OR 1.020, 95% CI 1.050 to 1.178, p = 0.003), and absolute NC volume (OR 1.026, 95% CI 1.057 to 1.199, p <0.001) were independent predictors of AKC. In conclusion, diabetic patients with AKC were older, had greater NC- and DC-containing plaques, and higher inflammatory status compared to diabetic patients without AKC.
The aortic knob is a radiographic structure that is formed by the foreshortened aortic arch and a portion of the descending aorta. Previously 1 study reported that aortic calcium occurs 6 to 10 times more often than that of the coronary artery. Aortic wall calcium has been known to be associated with various atherosclerotic risk factors such as old age, postmenopausal state, diabetes mellitus, hypertension, smoking, renal failure, and peripheral artery disease, and associated with various serum markers, such as cholesterol, and C-reactive protein (CRP). Several studies have demonstrated a relation between degree of coronary artery calcium and severity of atherosclerosis and clinical events. Similar relations between vascular calcium and cardiovascular events have been demonstrated in the aortic arch and the thoracic aorta. One study has demonstrated that the aortic knob width and prevalence of aortic knob calcium (AKC) are significantly correlated with severity of coronary artery disease. However, thus far, no study has examined the relation between aortic calcification and coronary plaque characteristics in diabetic patients. Therefore, the aim of this study was to assess the relation between AKC and coronary plaque characteristics using virtual histology and intravascular ultrasound (VH-IVUS) in patients with diabetes mellitus.
Methods
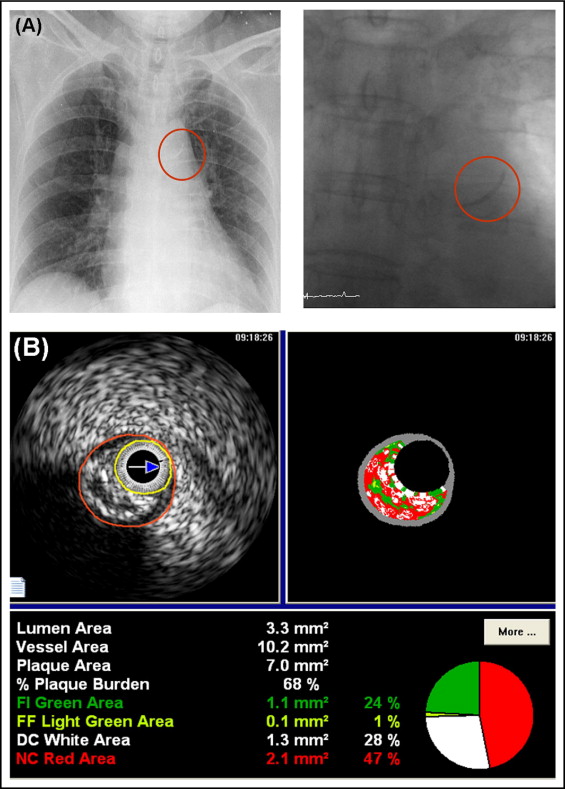
This study was a retrospective, single-center study. The presence of AKC was assessed by posteroanterior view of chest x-ray or fluoroscopy at the time of coronary angiography ( Figure 1 ). Diabetes mellitus was defined as use of oral hypoglycemic agents or insulin to lower blood glucose levels or known fasting blood glucose values ≥126 mg/dl or postprandial 2-hour blood glucose values ≥200 mg/dl. A total of 1,143 diabetic patients were admitted to the Heart Center of Chonnam National University Hospital for coronary angiography from October 2006 to September 2008. Of these, VH-IVUS was performed in 177 patients. We excluded 12 patients who underwent balloon angioplasty before IVUS, 15 patients who underwent VH-IVUS for in-stent restenosis lesions, and 13 patients in whom adequate IVUS images could not be obtained. We identified 137 patients who underwent preintervention VH-IVUS imaging. The protocol was approved by the institutional review board. Hospital records of patients were reviewed to obtain information on clinical demographics.
Peripheral blood samples were obtained before coronary angiography using direct venipuncture. Blood samples were centrifuged, and serum was removed and stored at −70°C until the assay could be performed. Absolute creatine kinase-MB levels were determined by radioimmunoassay (Dade Behring, Inc., Miami, Florida). Cardiac-specific troponin I levels were measured by a paramagnetic particle, chemiluminescent immunoenzymatic assay (Beckman, Coulter, Inc., Fullerton, California). Serum levels of total cholesterol, triglyceride, low-density lipoprotein cholesterol, and high-density lipoprotein cholesterol were measured by standard enzymatic methods. High-sensitivity (hs) CRP was analyzed turbidimetrically with sheep antibodies against human CRP; this has been validated against the Dade-Behring method.
Coronary angiogram was analyzed with a validated quantitative coronary angiographic system (Phillips H5000 or Allura DCI program, Philips Medical Systems, Eindhoven, The Netherlands). With the outer diameter of the contrast-filled catheter as the calibration standard, minimal lumen diameter and reference diameter were measured in diastolic frames from orthogonal projections.
All preintervention gray-scale and VH–IVUS examinations were performed after intracoronary administration of nitroglycerin 200 μg. A 20-MHz, 2.9-Fr IVUS imaging catheter (Eagle Eye, Volcano Corp., Rancho Cordova, California) was advanced >10 mm beyond the lesion, and automated pullback was performed to a point >10 mm proximal to the lesion at a speed of 0.5 mm/s. Quantitative volumetric gray-scale and VH-IVUS analyses were performed across the entire lesion segment, and cross-sectional analysis was performed at minimum lumen sites and largest necrotic core (NC) sites. Conventional quantitative volumetric gray-scale IVUS analysis was performed according to the American College of Cardiology Clinical Expert Consensus Document on Standards for Acquisition, Measurement and Reporting of Intravascular Ultrasound Studies. External elastic membrane and lumen cross-sectional areas were measured. Plaque plus media cross-sectional area was calculated as external elastic membrane minus lumen cross-sectional area, and plaque burden was calculated as plaque plus media divided by external elastic membrane cross-sectional area. Soft plaque was less bright compared to the reference adventitia. Fibrotic plaque was as bright as or brighter than the reference adventitia without acoustic shadowing. Calcified plaque was hyperechoic with shadowing. A calcified lesion contained >90° of circumferential lesion calcium. When there was no dominant plaque composition, the plaque was classified as mixed. Proximal and distal references were single slices with the largest lumen and smallest plaque burden within 10 mm proximally and distally, but before any large side branch. VH-IVUS analysis classified the color-coded tissue into 4 major components: green (fibrotic), yellow-green (fibrofatty), white (dense calcium [DC]), and red (NC) ( Figure 1 ). VH-IVUS analysis was reported in absolute amounts and as percent plaque area or volume.
SPSS 15.0 for Windows (SPSS, Inc., Chicago, Illinois) was used for all analyses. Continuous variables were presented as mean ± 1 SD; comparisons were conducted by Student’s t test or Wilcoxon rank-sum test if the normality assumption was violated. Discrete variables were presented as percentages and frequencies; comparisons were conducted by chi-square statistics or Fisher’s exact test as appropriate. Multivariable logistic regression analysis was performed to identify independent predictors of AKC. A p value <0.05 was considered statistically significant.
Results
Baseline characteristics are presented in Table 1 . Diabetic patients with AKC were significantly older, had more family history of coronary artery disease, higher serum creatinine and hs-CRP, and lower high-density lipoprotein cholesterol levels compared to diabetic patients without AKC.
| Variable | AKC | p Value | |
|---|---|---|---|
| Yes | No | ||
| (n = 45) | (n = 92) | ||
| Age (years) | 68 ± 8 | 62 ± 9 | <0.001 |
| Men | 27 (60%) | 51 (55%) | 0.6 |
| Clinical presentation | 0.7 | ||
| Stable angina pectoris | 18 (40%) | 38 (41%) | |
| Unstable angina pectoris | 13 (29%) | 27 (29%) | |
| Non–ST-segment elevation myocardial infarction | 7 (16%) | 18 (20%) | |
| ST-segment elevation myocardial infarction | 7 (16%) | 9 (10%) | |
| Hypertension | 25 (56%) | 58 (63%) | 0.4 |
| Smoker | 18 (40%) | 38 (41%) | 0.8 |
| Family history of coronary artery disease | 5 (11%) | 0 (0%) | 0.001 |
| Previous myocardial infarction | 1 (2%) | 8 (7%) | 0.2 |
| Previous percutaneous coronary intervention | 3 (7%) | 12 (13%) | 0.3 |
| Ejection fraction (%) | 62 ± 10 | 61 ± 7 | 0.7 |
| White blood cell count (10 3 /mm 3 ) | 7.5 ± 2.2 | 7.2 ± 1.9 | 0.4 |
| Hemoglobin (g/dl) | 12.9 ± 1.7 | 13.3 ± 2.1 | 0.2 |
| Platelet count (10 3 /mm 3 ) | 215 ± 83 | 220 ± 49 | 0.6 |
| Glucose (mg/dl) | 179 ± 48 | 168 ± 51 | 0.2 |
| Creatine kinase-MB (U/dl) | 9.2 ± 10.4 | 7.2 ± 8.8 | 0.2 |
| Troponin I (ng/ml) | 2.9 ± 8.6 | 2.0 ± 4.5 | 0.4 |
| Creatinine (mg/dl) | 1.3 ± 0.7 | 1.1 ± 0.6 | 0.026 |
| Fibrinogen (mg/dl) | 301 ± 103 | 271 ± 72 | 0.13 |
| High-sensitivity C-reactive protein (mg/dl) | 1.97 ± 1.33 | 0.48 ± 1.35 | 0.005 |
| Total cholesterol (mg/dl) | 184 ± 36 | 185 ± 52 | 1.0 |
| Triglyceride (mg/dl) | 119 ± 58 | 102 ± 36 | 0.073 |
| Low-density lipoprotein cholesterol (mg/dl) | 121 ± 34 | 118 ± 44 | 0.8 |
| High-density lipoprotein cholesterol (mg/dl) | 44 ± 10 | 48 ± 12 | 0.022 |
Angiographic findings are presented in Table 2 . There were no significant differences in culprit vessel, angiographic lesion type, incidences of multivessel disease, and angiographically detectable culprit site coronary calcium, Thrombolysis In Myocardial Infarction flow grade, and quantitative coronary angiographic data between patients with AKC and those without AKC.
| Variable | AKC | p Value | |
|---|---|---|---|
| Yes | No | ||
| (n = 45) | (n = 92) | ||
| Culprit coronary artery | 0.2 | ||
| Left main | 4 (9%) | 6 (7%) | |
| Left anterior descending | 19 (42%) | 25 (27%) | |
| Left circumflex | 11 (24%) | 25 (27%) | |
| Right | 11 (24%) | 36 (39%) | |
| American College of Cardiology/American Heart Association lesion type | 0.5 | ||
| B1 | 8 (18%) | 25 (27%) | |
| B2 | 23 (51%) | 44 (48%) | |
| C | 14 (31%) | 23 (25%) | |
| Multivessel disease | 35 (78%) | 61 (66%) | 0.17 |
| Culprit lesion calcium | 20 (44%) | 30 (33%) | 0.18 |
| Thrombolysis In Myocardial Infarction flow grade | 0.6 | ||
| 1 | 3 (7%) | 3 (3%) | |
| 2 | 6 (13%) | 16 (17%) | |
| 3 | 36 (80%) | 73 (79%) | |
| Reference diameter (mm) | 3.34 ± 0.61 | 3.25 ± 0.56 | 0.5 |
| Preminimal luminal diameter (mm) | 1.13 ± 0.68 | 1.25 ± 0.53 | 0.4 |
| Percent diameter stenosis (%) | 67 ± 15 | 61 ± 15 | 0.075 |
Gray-scale IVUS findings are listed in Table 3 . There were no significant differences in IVUS parameters at proximal and distal references between patients with AKC and those without AKC. At minimum lumen sites and largest NC sites, plaque burden was significantly greater and there were trends toward smaller lumen cross-sectional areas and greater plaque plus media cross-sectional areas in lesions of patients with AKC compared to those without AKC.
| Variable | AKC | p Value | |
|---|---|---|---|
| Yes | No | ||
| (n = 45) | (n = 92) | ||
| Proximal reference | |||
| External elastic membrane cross-sectional area (mm 2 ) | 19.8 ± 7.6 | 19.6 ± 6.3 | 0.9 |
| Lumen cross-sectional area (mm 2 ) | 12.1 ± 6.7 | 12.1 ± 7.2 | 1.0 |
| Plaque plus media cross-sectional area (mm 2 ) | 7.7 ± 3.7 | 7.5 ± 3.2 | 0.8 |
| Plaque burden (%) | 38 ± 9 | 38 ± 8 | 0.6 |
| Distal reference | |||
| External elastic membrane cross-sectional area (mm 2 ) | 14.8 ± 6.3 | 15.4 ± 6.5 | 0.6 |
| Lumen cross-sectional area (mm 2 ) | 9.4 ± 3.9 | 9.8 ± 4.3 | 0.6 |
| Plaque plus media cross-sectional area (mm 2 ) | 5.4 ± 2.8 | 5.8 ± 3.0 | 0.4 |
| Plaque burden (%) | 36 ± 6 | 37 ± 8 | 0.5 |
| Minimum lumen site | |||
| External elastic membrane cross-sectional area (mm 2 ) | 16.4 ± 6.1 | 16.1 ± 5.7 | 0.8 |
| Lumen cross-sectional area (mm 2 ) | 5.2 ± 2.7 | 6.2 ± 3.6 | 0.087 |
| Plaque plus media cross-sectional area (mm 2 ) | 11.2 ± 5.0 | 9.9 ± 3.8 | 0.088 |
| Plaque burden (%) | 68 ± 11 | 61 ± 13 | 0.002 |
| Largest necrotic core site | |||
| External elastic membrane cross-sectional area (mm 2 ) | 18.3 ± 7.6 | 18.0 ± 6.5 | 0.8 |
| Lumen cross-sectional area (mm 2 ) | 6.4 ± 4.1 | 7.6 ± 4.3 | 0.14 |
| Plaque plus media cross-sectional area (mm 2 ) | 11.9 ± 5.0 | 10.4 ± 3.8 | 0.081 |
| Plaque burden (%) | 66 ± 10 | 59 ± 11 | 0.003 |
| Intravascular ultrasound lesion length (mm) | 28 ± 11 | 25 ± 10 | 0.2 |
| Plaque type | 0.4 | ||
| Soft | 4 (9%) | 8 (9%) | |
| Fibrotic | 18 (40%) | 50 (54%) | |
| Calcified | 11 (24%) | 15 (16%) | |
| Mixed | 12 (27%) | 19 (21%) | |
| Volumetric analysis | |||
| External elastic membrane volume (mm 3 ) | 386 ± 301 | 487 ± 859 | 0.4 |
| Lumen volume (mm 3 ) | 176 ± 152 | 204 ± 158 | 0.3 |
| Plaque volume (mm 3 ) | 210 ± 158 | 203 ± 149 | 0.8 |
Stay updated, free articles. Join our Telegram channel

Full access? Get Clinical Tree


