Recurrent Ventricular Tachycardia
This chapter will be divided into discrete sections: (a) definitions; (b) pathophysiologic substrates and mechanisms of tachycardias; and (c) electrophysiologic studies (EPS)—modes of initiation, response to stimulation, effects of drugs, and localizing the origin of ventricular tachycardia (VT). VTs encompass a spectrum of arrhythmias that range from nonsustained, asymptomatic VT to sustained arrhythmias, which can produce hemodynamic compromise and cardiac arrest. These tachycardias may be uniform in morphology (i.e., monomorphic) or polymorphic. VT most often occurs in the setting of some form of cardiac disease. Although chronic ischemic heart disease, especially that associated with prior infarction and aneurysm formation, is the most common cardiac disorder associated with VT (particularly sustained, monomorphic VT), these arrhythmias can occur in patients with a variety of disorders, such as cardiomyopathy, congenital and valvular heart disease, drug toxicity, metabolic disorders, long QT interval syndromes, or even in structurally normal hearts. In contrast to patients with monomorphic sustained VT, which is primarily associated with coronary artery disease (≈90%), patients presenting with nonsustained arrhythmias (monomorphic or polymorphic) and cardiac arrest are more heterogeneous groups. Occasionally, any of these forms of VT can occur in patients with normal hearts.
Sustained monomorphic VT can be characterized by electrophysiologic techniques. The results of electrophysiologic testing in patients with nonsustained VT, polymorphic VT, and status post cardiac arrest are more difficult to interpret. In patients with coronary artery disease, particularly when associated with prior infarction, most VTs, regardless of the duration or morphology, appear to have a similar pathophysiologic substrate, and probably a similar mechanism. The evidence supporting this includes the ability to change either nonsustained monomorphic VT or polymorphic VT into sustained uniform VT by different modes of programmed stimulation and/or by the addition of drugs that slow conduction. These and other observations concerning mechanism are discussed in detail later in this chapter.
Over the past four decades, electrophysiologic studies have been responsible for a greater understanding of ventricular arrhythmias. This has led to major advances in their pharmacologic and nonpharmacologic therapy. The present chapter discusses the methods of studying ventricular arrhythmias.
Much of this chapter concentrates on electrophysiologic studies of sustained monomorphic VT. In addition, the application of electrophysiologic studies to patients who present with nonsustained VT or cardiac arrest is addressed. It is imperative that clinicians and clinical investigators recognize that the study of ventricular arrhythmias is still evolving. The clinical application of electrophysiologic studies has been established only for ventricular arrhythmias in patients with chronic ischemic heart disease and for those patients with nonsustained and sustained monomorphic VTs in the absence of coronary artery disease. The role of electrophysiologic studies in evaluating nonsustained and/or polymorphic arrhythmias associated with metabolic disorders, drug toxicity, cardiomyopathy, and so on is not yet established. A discussion of our current level of understanding of this issue is included and detailed later.
The expanded use of implantable cardioverter-defibrillators (ICDs) based on ejection fraction alone and the invasive nature of EPS is responsible for the apparent diminished interest in trying to understand the underlying mechanisms of ventricular arrhythmias.
The principal goals of the electrophysiologic study in the evaluation of VT are (a) confirming the diagnosis of VT, (b) defining the mechanism of arrhythmia, (c) localizing the site of origin, and (d) evaluating the efficacy of pharmacologic or nonpharmacologic (pacemaker, defibrillator, or ablation by either catheter or surgery) therapeutic methods. In this chapter we deal with the first three goals. The last goal is discussed in subsequent chapters.
Definitions of Ventricular Tachycardias
The definitions employed by electrophysiology laboratories are arbitrary but provide a useful framework for both the clinician and the electrophysiologist to distinguish “pathologic” responses from “normal” expected responses.1,2,3
Morphology
Monomorphic VT has a single, stable QRS morphology. Polymorphic or multiform VT has a changing QRS morphology. How often the complexes must change to qualify as polymorphic
is unsettled. For practical purposes, we consider a tachycardia polymorphic if it has no constant morphology for more than five complexes, has no clear isoelectric baseline, or has QRS complexes that are asynchronous in multiple simultaneously recorded leads. Polymorphic VT may be seen with long or normal QT intervals. The term torsade de pointes was originally meant to be employed for a clinical syndrome that includes polymorphic tachycardia and long QT intervals, due to reversible causes such as hypokalemia, bradycardia, or drug toxicity.4,5 These arrhythmias must be distinguished from polymorphic tachycardias with normal QT intervals and those associated with hereditary long QT intervals. Regardless of the cause, polymorphic VT frequently degenerates into ventricular fibrillation (VF). Rapid sustained monomorphic VT can also degenerate into VF, frequently following a stage of polymorphic tachycardia. This is a fairly common mechanism of sudden cardiac death recorded by Holter monitor.6,7,8 This observation suggests a link between monomorphic sustained VT and VF and provides a rationale for using suppression of induced VT as a goal for therapy in patients with cardiac arrest (see Chapter 12).
is unsettled. For practical purposes, we consider a tachycardia polymorphic if it has no constant morphology for more than five complexes, has no clear isoelectric baseline, or has QRS complexes that are asynchronous in multiple simultaneously recorded leads. Polymorphic VT may be seen with long or normal QT intervals. The term torsade de pointes was originally meant to be employed for a clinical syndrome that includes polymorphic tachycardia and long QT intervals, due to reversible causes such as hypokalemia, bradycardia, or drug toxicity.4,5 These arrhythmias must be distinguished from polymorphic tachycardias with normal QT intervals and those associated with hereditary long QT intervals. Regardless of the cause, polymorphic VT frequently degenerates into ventricular fibrillation (VF). Rapid sustained monomorphic VT can also degenerate into VF, frequently following a stage of polymorphic tachycardia. This is a fairly common mechanism of sudden cardiac death recorded by Holter monitor.6,7,8 This observation suggests a link between monomorphic sustained VT and VF and provides a rationale for using suppression of induced VT as a goal for therapy in patients with cardiac arrest (see Chapter 12).
Duration
Most laboratories consider a tachycardia sustained if it lasts ≥30 seconds. Because many tachycardias require therapy before 30 seconds, some investigators have used 15 seconds as the duration required for a “sustained” VT. In point of fact, most tachycardias that last 15 seconds continue for 30 seconds. The requirement of a specified duration has practical significance with the development of ICDs, which can be programmed to deliver antitachycardia pacing (ATP), cardioversion, or defibrillation based on the duration of VT.
The number of complexes required to define a clinically relevant induced nonsustained VT is not established. Three consecutive complexes at a rate greater than 100 is sufficient for the diagnosis of a nonsustained VT noted on Holter monitor or on standard ECG. In the electrophysiology laboratory, we require five or six consecutive, nonbundle branch reentrant complexes, regardless of morphology, to qualify as a nonsustained VT. The frequency (≈50%) of bundle branch reentry in normal subjects in response to a single programmed ventricular extrastimulus (VES) (see Chapter 2) mandates our discounting such complexes. These bundle branch reentrant complexes have no relevance to clinical nonsustained VT. Repetitive polymorphic responses are also very common (up to 50%), particularly when multiple (≥3) extrastimuli are used with extremely short coupling intervals (<180 msec). The clinical significance of induced nonsustained polymorphic tachycardia is questionable and requires further evaluation to determine its relevance (to be discussed in subsequent paragraphs).
Classification of Ventricular Tachycardia QRS Complexes
Monomorphic VT is usually classified as having either an LBBB or RBBB pattern based on a QRS morphology in lead V1.9,10 Left bundle branch block (LBBB) morphologies include a QS, rS, or a qrS in V1. RBBB patterns are defined by rsR´, qR, RR´, RS, or monophasic R waves in V1.9,10 The clinical significance and results of electrophysiologic evaluations for these tachycardias are discussed in subsequent paragraphs. Patients may have more than one monomorphic VT, which can evolve one from the other or can occur individually at separate times.
Diagnosis of Ventricular Tachycardia
Several electrocardiographic observations have been proposed as diagnostic of VT. These have been recently reviewed by Miller et al.11 These include (1) QRS complexes exceeding 0.14 seconds in duration for RBBB VTs and 0.16 seconds for LBBB VTs in the absence of drugs, (2) a superior frontal plane QRS axis in RBBB VTs and a right inferior axis in LBBB VTs, (3) evidence of atrioventricular (A-V) dissociation, and (4) specific morphologic features of the QRS (Table 11-1).12,13,14 Recently Vereckei et al.15 have evaluated the use of aVR as a single lead for VT diagnosis. They reported good sensitivity and specificity, but I have not found it significantly better than V1–2 criteria. Although all of these criteria have limitations, the presence of any of these criteria can correctly identify VT in more than 90% of the patients. Morphologic criteria are particularly important in the diagnosis of rapid VT (>180 bpm), as A-V dissociation, fusion complexes, or sinus captures are often absent.
With the use of intracardiac recording techniques, it has become clear that most of the preceding electrocardiographic features are not pathognomonic of VT. VT can be relatively narrow (even narrower than the sinus complex), and in ≈5% of VT the QRS may be <120 msec. Furthermore, A-V dissociation can be seen with supraventricular rhythms, fusion complexes can result from two ventricular ectopic foci, and morphologic and/or axis characteristics established for patients with normal
QRS complexes in sinus rhythm are less specific in the presence of underlying conduction disturbances (≥30% of patients with VT and coronary artery disease). In such instances, intracardiac recording and stimulation techniques may be the only method by which the diagnosis of VT can be established definitively. Although some investigators have advocated the use of adenosine to facilitate the diagnosis of VT versus SVT, I strongly disagree. Because of the possibility of adenosine producing a coronary steal syndrome, which can cause VT to degenerate to VF, I do not believe adenosine should be given in the absence of the knowledge of the coronary anatomy.
QRS complexes in sinus rhythm are less specific in the presence of underlying conduction disturbances (≥30% of patients with VT and coronary artery disease). In such instances, intracardiac recording and stimulation techniques may be the only method by which the diagnosis of VT can be established definitively. Although some investigators have advocated the use of adenosine to facilitate the diagnosis of VT versus SVT, I strongly disagree. Because of the possibility of adenosine producing a coronary steal syndrome, which can cause VT to degenerate to VF, I do not believe adenosine should be given in the absence of the knowledge of the coronary anatomy.
Table 11-1 Characteristics of Wide Complex Tachycardia Favoring Diagnosis of VT | |
|---|---|
|
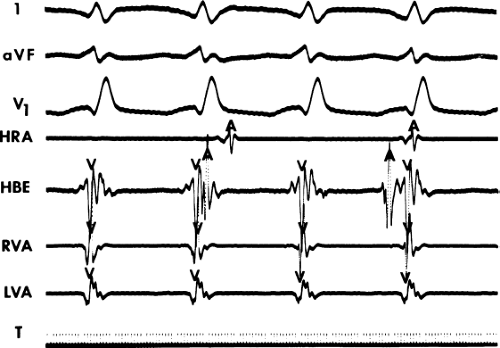 FIGURE 11-1 Intracardiac recording during ventricular tachycardia. From top to bottom: ECG leads 1, aVF, and V1, and electrograms from the high-right atrium (HRA), His bundle region (HBE), right ventricular apex (RVA), and left ventricular apex (LVA). T, time line. Note the absence of His bundle deflections and variable retrograde conduction. (From Josephson ME, Horowitz LN, Farshidi A, et al. Recurrent sustained ventricular tachycardia. 2. Endocardial mapping. Circulation 1978;57:440.) |
Use of His Bundle Recordings in Diagnosing Ventricular Tachycardia
The ability to directly record His bundle activity has permitted more precise differentiation of those events occurring proximal rather than distal to the His bundle. In the absence of pre-excitation a supraventricular impulse must pass through the His bundle and the specialized ventricular conducting system before initiating depolarization of the ventricles. This produces the normal H-V interval of 35 to 55 msec. It seems reasonable, therefore, to use the relationship of the His bundle deflection to the QRS as an immediate clue to the diagnosis of VT.
During VT, in many patients, no consistent His bundle deflections are noted (Fig. 11-1). This may result because no engagement of the His–Purkinje system by the ventricular impulse occurs (probably uncommon), or because retrograde His bundle activation occurs during ventricular activation and is obscured by the large ventricular deflection in the His bundle recording. His deflections can usually be observed if attention is given to catheter position. One may identify His bundle activity before ventricular activation (in this instance, the H-V interval is shorter than normal; e.g., 20 msec), or just after the onset of ventricular depolarization to produce a short V-H interval (Fig. 11-2). His potentials may also be seen in the terminal part of the QRS or following the QRS complex (Fig. 11-3). Intermittent conduction to the His bundle usually has a 2:1 pattern (Fig. 11-4), but Wenckebach patterns may also be observed (Fig. 11-5).
If His bundle deflections are not seen, one must differentiate the absence of retrograde activation of the His–Purkinje
system from retrograde activation that is obscured by the large amplitude of the ventricular electrogram. This can be fortuitously observed if a sinus impulse conducts antegradely to the His bundle producing a clear His deflection. Atrial pacing and/or atrial extrastimuli can be used to evaluate the presence of retrograde His–Purkinje activation during VT. Supraventricular capture of the His bundle may occur in the absence (Fig. 11-6) or presence (Fig. 11-7) of ventricular fusion or sinus captures. In these instances, linking of the His bundle potential to atrial activation proves that they are due to antegrade depolarization and are unrelated to the tachycardia. A changing A-H interval and/or failure to observe antegrade His deflections during VT (with proper catheter position) with A-V dissociation suggest that retrograde conduction through the His–Purkinje system is occurring and producing concealment in the A-V node.
system from retrograde activation that is obscured by the large amplitude of the ventricular electrogram. This can be fortuitously observed if a sinus impulse conducts antegradely to the His bundle producing a clear His deflection. Atrial pacing and/or atrial extrastimuli can be used to evaluate the presence of retrograde His–Purkinje activation during VT. Supraventricular capture of the His bundle may occur in the absence (Fig. 11-6) or presence (Fig. 11-7) of ventricular fusion or sinus captures. In these instances, linking of the His bundle potential to atrial activation proves that they are due to antegrade depolarization and are unrelated to the tachycardia. A changing A-H interval and/or failure to observe antegrade His deflections during VT (with proper catheter position) with A-V dissociation suggest that retrograde conduction through the His–Purkinje system is occurring and producing concealment in the A-V node.
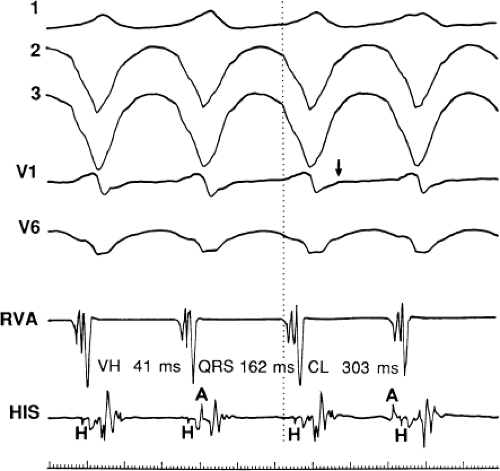 FIGURE 11-2 Ventricular tachycardia with a short V-H interval. Five surface ECGs are shown with electrograms from the RVA and His bundle region (HIS). Note that the His bundle activation occurred 41 msec after the onset of QRS. Retrograde block in the A-V node is present because atrial activation is dissociated from the tachycardia. See text for discussion. |
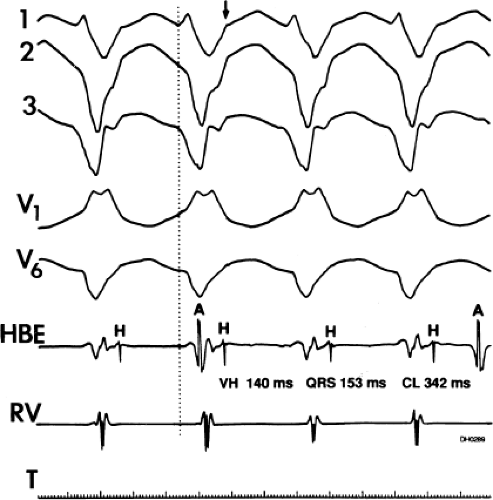 FIGURE 11-3 Ventricular tachycardia (VT) with a long V-H interval. VT with a right bundle branch block superior axis is shown with five ECG leads and intracardiac recordings from the HBE and right ventricle (RV). T is shown on the bottom. The dotted vertical line marks the onset of the QRS and the vertical arrow marks the offset. Note that the V-H interval during the tachycardia is seen 140 msec following the ORS. The QRS is 153 msec in duration, and the cycle length of the tachycardia is 342 msec. See text for discussion. |
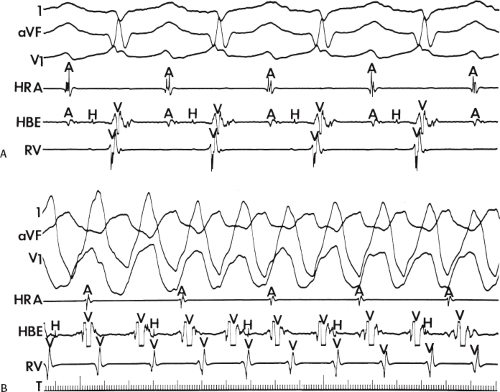 FIGURE 11-4 Two to one retrograde activation of the His bundle. Three surface leads and electrograms from the HRA, HBE, and RV are shown. A: Sinus rhythm is present. B: VT is present. Note that during VT 2:1 retrograde conduction to the His bundle is observed without conduction through the A-V node to the atrium. |
It is often difficult to determine whether the recorded His deflection is antegrade or retrograde—or for that matter whether an apparent His bundle deflection is really a right bundle branch potential. Two techniques that may be used to clarify the situation are (a) recording right and left bundle branch potentials to demonstrate that their activation begins before His bundle activation and (b) His bundle pacing producing a longer H-V interval than the one noted during the tachycardia. Both of these are extremely difficult to do but can help define the mechanism of His bundle activation and the tachycardia origin. The role of the
His–Purkinje system in the genesis of VT is discussed in subsequent paragraphs.
His–Purkinje system in the genesis of VT is discussed in subsequent paragraphs.
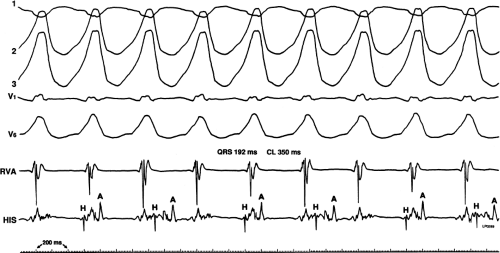 FIGURE 11-5 Retrograde Wenckebach in the His–Purkinje system. VT is present. Five surface ECG leads are shown with electrograms from the RVA and His bundle region. The second, third, and fourth QRS complexes are associated with short V-H interval, a longer V-H interval, and no V-H interval as block occurs between the ventricle and the His bundle recording. The pattern is repeated in the next three complexes. Thus, 3:2 retrograde conduction to the His bundle is present. Note that this occurs without a change in the QRS morphology and duration or the VT cycle length. |
Limitations of His Bundle Recordings for the Diagnosis of Ventricular Tachycardia
Certain pitfalls are inherent in the use of His bundle recordings for the diagnosis of VT, as described in the following paragraphs.
(1) The inability to record His bundle potentials during the tachycardia most commonly reflects improper catheter position; therefore, verification of proper catheter position is mandatory. The simplest methods for verifying proper catheter position include the following: (a) the immediate appearance of His bundle deflections on termination of the tachycardia, or conversely, disappearance of the His bundle deflection on initiation of the tachycardia, without catheter manipulation; (b) spontaneously occurring or induced supraventricular capture of the His–Purkinje system (with or without ventricular capture) during the tachycardia with the sudden appearance of His bundle deflections; and (c) in the presence of supraventricular capture, H-V intervals comparable to those during sinus rhythm (Figs. 11-6 and 11-7). We have found that the use of more closely spaced bipolar electrodes (l to 5 mm apart) facilitate identification of His bundle activity when it occurs within the ventricular electrogram. Using bipolar recordings
with an interelectrode distance of 5 mm, we have recorded His–Purkinje activity during the tachycardia in approximately 80% of patients.16
with an interelectrode distance of 5 mm, we have recorded His–Purkinje activity during the tachycardia in approximately 80% of patients.16
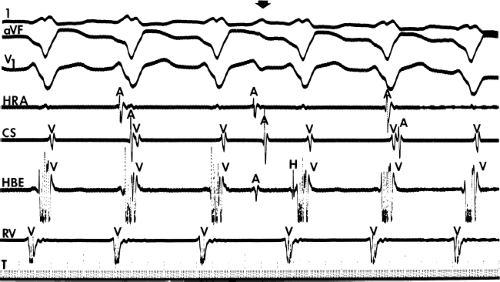 FIGURE 11-6 Antegrade depolarization of the His bundle during VT. From top to bottom. ECG leads 1, aVF, and V1, and electrograms from the HRA, coronary sinus (CS), HBE, and RVA. VT with A-V dissociation is present. The second atrial impulse (A) conducts through the His bundle but fails to alter the tachycardia. The first and third sinus complexes block in the A-V node due to retrograde concealment. T, time line. |
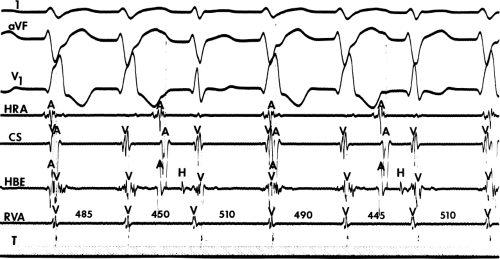 FIGURE 11-7 Intermittent supraventricular capture of the His bundle and ventricle during VT. VT is present, having a right bundle branch block morphology with left axis deviation. Intracardiac recordings from the HRA, CS, HBE, and RVA are shown along with T. Following the second VT complex, the sinus impulse captures the His bundle and part of the ventricle to produce a supraventricular fusion. The next VT cycle returns on time. Two complexes later, another supraventricular fusion is observed, again without influencing the tachycardia. This demonstrates lack of requirement of the His bundle for perpetuation of the tachycardia. See text for discussion. |
If His deflections are not spontaneously observed during the tachycardia, because of either poor position or obscuration of the His deflection by the ventricular electrogram, rapid atrial pacing can be used to clarify the issue in some cases. If rapid atrial pacing can produce supraventricular capture during the tachycardia—that is, changing the QRS to a sinus QRS—this is diagnostic of VT, regardless of whether the His deflection is seen (proper catheter position) or is not seen (inappropriate catheter position) (Fig. 11-8). Atrial pacing is an active maneuver that may be useful in diagnosing VT even in the absence of recording His bundle electrograms.
(2) The mere presence of the His bundle deflection before the QRS complex with a “normal” H-V interval is not absolutely reliable evidence that the arrhythmia has a supraventricular origin. The “H-V” interval during VT is usually less than that observed during sinus rhythm; hence, if infranodal conduction delay is present during sinus rhythm, the VT may exist in the presence of an apparently “normal” H-V interval (i.e., 35 to 55 msec), but it will be less than the H-V interval during sinus rhythm. Thus, knowledge of A-V conduction during sinus rhythm may be necessary to define what is a “normal” H-V interval during the tachycardia.
The occurrence of an “H-V” (His deflection before the QRS) or a V-H (His deflection after the QRS) interval less than that recorded during sinus rhythm, in the absence of pre-excitation, implies the presence of retrograde activation of the His bundle. It further implies that retrograde conduction time from the “origin” or exit of the tachycardia (as defined by the onset of the QRS) to the His bundle is less than “antegrade” conduction time to depolarize the ventricular myocardium. Some investigators16,17 suggest that the site of origin of such a tachycardia is within the His–Purkinje system. These rhythms have generally been referred to as fascicular rhythms,16,17 although proof that they originate in the fascicles of the conducting system and differ from other forms of VT is often lacking. As stated earlier, pre-excited tachycardia using either an A-V or nodoventricular bypass tract must be excluded (see Chapter 10).
Two specific circumstances may produce confusing data. The first is a reentrant VT occurring in the setting of a prior infarction. Because ventricular activation (albeit slow enough not to be apparent on the surface ECG) is occurring in diastole, the His–Purkinje system could be activated during this time giving rise to a short V-H or possibly a normal “H-V” interval during the tachycardia. This is schematically shown in Figure 11-9. The time to conduct retrogradely to the His bundle may theoretically be less than the time required to exit from the circuit and produce the onset of the QRS, thereby producing an “H-V” interval. Such tachycardias, which are rare, have “narrow” QRS complexes (Fig. 11-10). It is not rare for a tachycardia to have a V-H interval less than the antegrade H-V interval (Fig. 11-11). In these instances, the tachycardia does not reflect a fascicular tachycardia but reflects engagement of the His–Purkinje system before the onset of the QRS. Retrograde conduction time over the His–Purkinje system is actually much greater than the “V-H” observed during the tachycardia. Depending on the relative conduction time up the His–Purkinje system and through slowly conducting
muscle to give rise to the QRS, the His deflection can occur before, during, or after the QRS.
muscle to give rise to the QRS, the His deflection can occur before, during, or after the QRS.
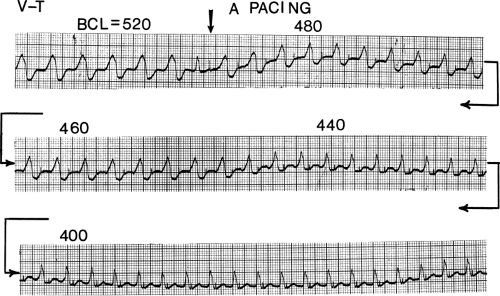 FIGURE 11-8 Use of atrial pacing during a wide complex tachycardia to diagnose VT. VT is present on the upper left with a left bundle branch block pattern at a cycle length of 520 msec. Atrial pacing is begun (arrow) at a cycle length of 480 msec, which is gradually reduced to 400 msec. As the atrial-paced cycle length decreases, a greater degree of ventricular activation is produced via the normal conducting system. Finally, at 400 msec, the QRS is totally normalized. The ability to normalize the QRS with atrial pacing during a wide complex rhythm is diagnostic of VT. See text for discussion. BCL, basic cycle length. |
The second circumstance that can give rise to VT having an H-V interval greater than or equal to the H-V during sinus rhythm is bundle branch reentrant VT.18,19 The mechanism, which is the same as isolated bundle branch reentry discussed in Chapter 2, is discussed in more detail in subsequent paragraphs. When bundle branch reentrant VT has an LBBB morphology, retrograde conduction occurs over the left bundle system with antegrade conduction over the right bundle branch. The His deflection typically occurs before the right bundle deflection with an H-V interval approximating the H-V interval during sinus rhythm. The “H-V” interval may be longer than sinus if there is antegrade conduction delay down the RBB. Theoretically, if there is prolonged retrograde conduction over the His–Purkinje system, producing a markedly delayed His deflection (very long V-H), the “in parallel” activation of the His bundle would appear as a “normal” H-V interval. In this case, one must demonstrate that the His deflection is not a requisite for subsequent ventricular activation and thus is not a reflection of bundle branch reentry. Certain criteria are necessary for the diagnosis of bundle branch reentry, all of which provide
some demonstration that retrograde conduction to the His bundle over one bundle branch subsequently leads to antegrade conduction over the contralateral bundle branch to cause the subsequent QRS. Thus, in cases of bundle branch reentry having an LBBB morphology, right ventricular septal activation must precede left ventricular activation. An example of a tachycardia with a His bundle before each QRS that was wrongly considered to be due to bundle branch reentry is shown in Figure 11-12. In this instance, the H-V interval measured to the QRS or to the right ventricular electrogram was greater than 75 msec and exceeded that during sinus rhythm; however, the electrogram recording from the left ventricular apex preceded right ventricular septal activation by 45 msec, therefore excluding bundle branch reentry. For bundle branch reentry with LBBB morphology to occur, the right ventricle must be activated before the left ventricle. The opposite is true for bundle branch reentry with an RBBB pattern. The mechanisms of bundle branch reentry and its variants are discussed in greater detail later in this chapter.
some demonstration that retrograde conduction to the His bundle over one bundle branch subsequently leads to antegrade conduction over the contralateral bundle branch to cause the subsequent QRS. Thus, in cases of bundle branch reentry having an LBBB morphology, right ventricular septal activation must precede left ventricular activation. An example of a tachycardia with a His bundle before each QRS that was wrongly considered to be due to bundle branch reentry is shown in Figure 11-12. In this instance, the H-V interval measured to the QRS or to the right ventricular electrogram was greater than 75 msec and exceeded that during sinus rhythm; however, the electrogram recording from the left ventricular apex preceded right ventricular septal activation by 45 msec, therefore excluding bundle branch reentry. For bundle branch reentry with LBBB morphology to occur, the right ventricle must be activated before the left ventricle. The opposite is true for bundle branch reentry with an RBBB pattern. The mechanisms of bundle branch reentry and its variants are discussed in greater detail later in this chapter.
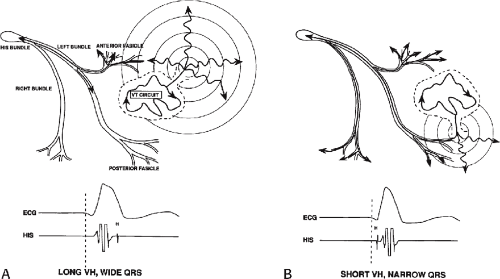 FIGURE 11-9 Relationship of V-H interval to differences in conduction time to the His–Purkinje system and to the rest of the ventricular myocardium. A: A VT circuit is schematically shown surrounded by diseased tissue through which the impulse must propagate slowly before reaching the His–Purkinje system. This results in a long V-H interval. B: The schema shows that propagation of the impulse from the reentrant circuit to the His–Purkinje system is more rapid than that to the remainder of the myocardium, resulting in a short V-H interval. See text for discussion. |
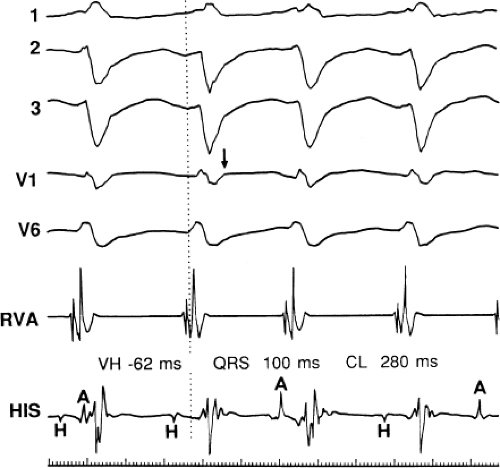 FIGURE 11-10 Ventricular tachycardia with the His bundle activated before the QRS. VT with a left bundle branch block left axis morphology is shown. During the tachycardia, the His deflection is seen 62 msec before the QRS (H-V = 62 or V-H = − 62). A-V dissociation is also present. In this instance, conduction to the His–Purkinje was far more rapid than that to the ventricular myocardium, resulting in early His–Purkinje activation. The His–Purkinje system then is used to activate distal ventricular myocardium, producing a narrow QRS. See text for discussion. |
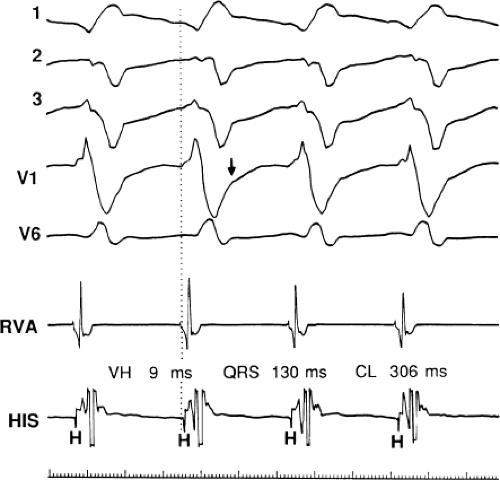 FIGURE 11-11 Ventricular tachycardia with a short V-H interval. VT with a left bundle branch block left axis deviation is seen with His bundle activation occurring 9 msec following the onset of the QRS. See text for discussion. |
Pathophysiologic Substrate for Ventricular Tachyarrhythmias
Nonsustained VT, hemodynamically tolerated sustained monomorphic VT, and arrhythmias producing cardiac arrest can have different anatomic and electrophysiologic substrates. These differences make it mandatory that these arrhythmias not be lumped together in terms of response to stimulation, effects of pharmacologic therapy, effectiveness of ablation, and clinical outcome.
Anatomic Substrate
The most common anatomic substrate for all these arrhythmias is chronic coronary artery disease, usually associated with prior infarction. Arrhythmias that are due to coronary artery disease are the only ones for which we have a reasonable understanding of the pathophysiologic substrate required for their genesis. Although sustained uniform monomorphic tachycardia may occur in the presence of either hypertrophic or idiopathic dilated cardiomyopathy, or even in patients with normal hearts, it is relatively uncommon. In these instances, the pathophysiologic basis for the arrhythmia is not well understood although patchy or segmental fibrosis is a common denominator. Arrhythmogenic right ventricular dysplasia has similar pathology as infarction, but it starts on the epicardium and additionally has fatty infiltration of the myocardium. Catecholamine-mediated triggered tachycardias due to delayed afterdepolarizations (DADs) are focal arrhythmias that can occur in the presence or absence of structural heart disease. In our experience, cardiac arrest that is due to polymorphic VT and/or VF is 10 times as common as hemodynamically tolerated monomorphic sustained VT in patients with either dilated or hypertrophic cardiomyopathies. This is an underestimate because it only includes survivors of cardiac
arrest. This may occur because in most cases there is patchy fibrosis instead of the large areas of contiguous scar seen in infarction.
arrest. This may occur because in most cases there is patchy fibrosis instead of the large areas of contiguous scar seen in infarction.
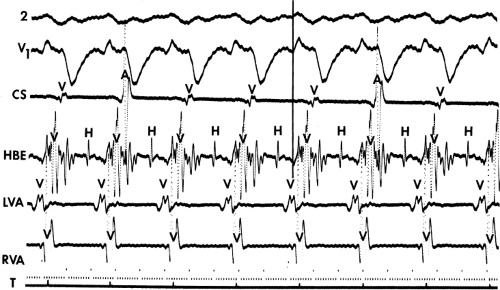 FIGURE 11-12 Ventricular tachycardia with an apparent normal H-V interval mimicking bundle branch reentry. During VT with a left bundle branch block and left axis morphology, the His bundle is activated 75 msec before the QRS, which was similar to the HV in sinus rhythm. However, analysis of activation at the left ventricular apical septum (LVA), demonstrates that ventricular activation begins in the left ventricle. Thus, bundle branch reentry is impossible as the mechanism for this arrhythmia. See text for discussion. |
Regardless of the underlying cardiac pathophysiology, sustained monomorphic tachycardia can be studied electrophysiologically such that interpretation of the mechanism and development of therapy is possible. Nonsustained VT is found in patients with a variety of disorders; thus, the pathophysiologic substrate for this arrhythmia is variable, and the utility of programmed stimulation for spontaneous VT in these different disorders depends on the underlying substrate. Because the pathophysiologic substrate for arrhythmias associated with cardiomyopathies (with the exception of arrhythmogenic right ventricular dysplasia) or those in normal hearts is poorly understood, the role of programmed stimulation to study patients with cardiac arrest or nonsustained VT in such patients is not established. However, I believe that the induction of sustained monomorphic VT is probably clinically significant regardless of the underlying pathology.
Electrophysiologic studies are most useful in patients with coronary artery disease and prior infarction. The pathologic substrate for patients with ventricular tachyarrhythmias associated with coronary artery disease is usually a prior myocardial infarction resulting in wall motion abnormalities.20,21,22,23 The greater the wall motion abnormalities, the higher the incidence of aneurysm formation, and the lower the ejection fraction, the more likely is the development of a sustained uniform VT. Patients who present with cardiac arrest appear to fall into two groups. Most commonly, these patients have prior infarction, although usually with less wall motion abnormalities and depression of myocardial function than patients with sustained uniform VT. Occasionally, patients have multiple prior myocardial infarctions. Although some investigators22 suggest more severe ventricular dysfunction in patients with cardiac arrest than in those with sustained uniform VT, this is neither our experience nor that of others.23 The second group of patients who present with a cardiac arrest are those who have severe coronary artery disease and relatively normal ventricular function; in this group the arrest is most likely due to acute ischemia. Electrophysiologic studies appear less useful in this latter group. Nonsustained VT, particularly when uniform, may occur in patients with normal ventricular function, with or without severe coronary disease, or in patients with severely abnormal ventricular function associated with multiple prior infarctions and/or ventricular aneurysms. In my experience, patients with prior infarction and uniform VT have the lowest ejection fractions (27%), while those with cardiac arrest and nonsustained VT have higher ejection fractions (35% and 39%, respectively). For nonsustained VT, this reflects a selection bias for patients with prior infarction and lower ejection fractions, because we tend not to treat, or study, patients with nonsustained VT and higher ejection fractions because they have a good progress. Thus, patients with cardiac arrest and nonsustained VT who are studied in our laboratory are anatomically similar. In the general population of patients with asymptomatic nonsustained VT, the majority will have normal left ventricular function. Our patient population is clearly selected so that we study patients with lower ejection fractions, recognizing that lower ejection fraction per se places a person at high risk for sudden death.
Although nonsustained VT can occur with and without prior myocardial infarction, patients who present with cardiac arrest or sustained monomorphic VT usually have had a prior infarction. The extent of infarction, and perhaps location involving the septum, may be the two important prognostic factors associated with these malignant sustained ventricular arrhythmias.21,24
Of the first 1,050 consecutive patients we studied with coronary artery disease who presented with sustained uniform VT, ≈25% had their first episode within the first year following myocardial infarction. Subsequently, we have noted a consistent 3% to 5% per year incidence of VT occurrence over the next 15 years. We have seen at least 45 patients whose first episode of sustained uniform VT occurred >15 years following their first infarction. In my experience, late occurring sustained monomorphic VT most often occurs following inferior wall myocardial infarction. I have seen a patient with his first episode of VT occurring 40 years after an inferior wall infarction. The clinical status does not distinguish those patients developing VT early and late from one another; that is, both have a high incidence of large infarction, severe ventricular dysfunction, the presence of an aneurysm, and significant coronary artery disease.25 Clinical status does appear to an important factor in recurrent episodes of VT. Recurrences seem to be more frequent in the setting of overt heart failure, possibly because of electrolyte imbalance, high catecholamine state (increased calcium-mediated triggered activity acting as VT triggers), and drug toxicity.
The cycle lengths of the tachycardias occurring early after infarction, however, tend to be faster, and the tachycardia is more poorly tolerated. This may reflect evolving scar formation, which when ultimately completed, may be related to longer tachycardia cycle lengths, owing to abnormalities of conduction with which it is associated (see following discussion). Nonetheless, Roy et al.26 demonstrated that tachycardias initiated 2 weeks after infarction (even if they had not been present clinically) can be replicated by programmed stimulation a year later. Thus, some components of the anatomic substrate must be relatively fixed once infarction has occurred. This is supported by inducibility at 10 and 100 days in an Ovine infarction model.27 Moreover the ability of programmed stimulation to predict risk of sudden cardiac arrest and survival postinfarction lead credence to this hypothesis.28 Since the introduction of thrombolysis and primary angioplasty for acute infarction, the incidence of sustained monomorphic VT has decreased remarkably. Only 1% of patients will experience an episode of sustained, tolerated VT in the year following infarction.
It is more difficult to assess the time from myocardial infarction when cardiac arrest or nonsustained VT occurs. As noted previously, nonsustained VT occurs with or without infarction, and one cannot truly estimate the incidence or timing of this arrhythmia with the degree of coronary stenosis and the presence of infarction or ischemia-induced myocardial dysfunction. Attempts to make these correlations are fraught with selection and/or entry bias, which is inherent in selecting patients from catheterization laboratories, coronary care units, or exercise laboratories. Similarly, patients studied following cardiac arrest are a selected group of survivors, and as such may not reflect the timing from infarction to cardiac arrest of nonsurvivors. However, this may indicate some of the characteristics of those patients likely to survive. Of more than 1,100 selected survivors of cardiac arrest associated with coronary artery disease who we have studied, the highest incidence (≈50%) of cardiac arrest occurred in the first 6 to 12 months following infarction. After the first year following infarction, the incidence of cardiac arrest decreases rapidly, such that within 3 years the incidence is low. This is in contrast to patients who will present with sustained monomorphic VT, among whom onset of the arrhythmia appears later (median ≈15 months). In the thrombolytic and primary angioplasty era, the timing of these events has not changed, but, as stated above, their frequency has been significantly reduced. The incidence of sudden cardiac death has been reduced less than that of sustained monomorphic VT. I believe this is due to a shift in patients from those who would have previously developed monomorphic VT to more presenting with cardiac arrest due to preservation of myocardium by early reperfusion.
The pathophysiologic substrate in disease states other than coronary artery disease is less clear. Hypertrophy and fibrosis characterize myopathic ventricles. Hypertrophy is associated with calcium overload, increased action potential duration (APD), a decrease in gap junctions, and alterations in their location, etc., all of which are potentially arrhythmogenic. These have been recently reviewed.29
Electrophysiologic Substrate
The clinically measurable electrophysiologic consequences of infarction that are potentially arrhythmogenic include abnormalities of conduction and refractoriness, heterogeneity of conduction and refractoriness, enhanced automaticity, and areas of inexcitability. We found that abnormalities of conduction are most prominent. We described abnormalities of conduction in terms of patterns of endocardial activation and electrogram characteristics using filtered bipolar electrograms recorded by catheter and intraoperative mapping techniques during sinus rhythm in patients with nonsustained and sustained VTs to distinguish them from patients with normal ventricles and those with prior infarction but no ventricular arrhythmias.30,31,32,33,34,35,36 We used filtered bipolar recordings to magnify near field signals and diminish far field signals (Fig. 11-13). We elected to look at the electrogram characteristics because of the observation that the VT often occurred at sites that demonstrated markedly abnormal electrograms manifesting multiple components, low-amplitude, prolonged duration, frequently occurring after the end of the QRS, and isolated late potentials (Fig 11-14). The areas of latest activation in sinus rhythm often become mid-diastolic activity during the VT (Fig 11-15). This observation led us to study ventricular activation and characterize electrograms in patients having sustained and nonsustained VTs.
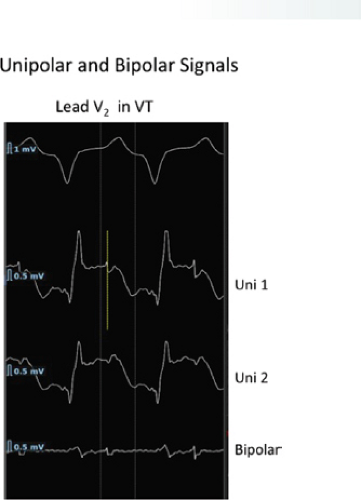 FIGURE 11-13 Use of bipolar recordings to reduce the far field signals recorded with unipolar recordings. Unipolar (top) and bipolar (bottom) signals recorded with the Rhythmia mapping system. The bipolar signal removes the large farfield signal recorded in the two unipolar electrograms from which the bipolar signal is derived. The amplitude of the sharp, nearfield signal is minimally altered. |
We developed criteria for normal, abnormal, and fractionated electrograms using bipolar signals recorded with a Bard Josephson catheter (see Fig. 1-1 bottom catheter) with a 2-mm tip and 1-mm ring electrode and both a 5- or 10-mm interelectrode distance according to our left ventricular mapping schema (Fig. 11-16).30,31 Filtering was 30 to 500 Hz. Normal electrograms had sharp, biphasic, or triphasic spikes with amplitudes of ≥3 mV, durations of ≤70 msec, and/or an amplitude/duration ratio of ≥0.046. We considered all other electrograms abnormal. We considered an electrogram fractionated if it had an amplitude of ≤0.5 mV, a duration of ≥133 msec, and/or an amplitude/duration ratio of ≤0.005. We defined fractionated electrograms as abnormal electrograms that fell outside the 95% confidence limits of amplitude and duration of all abnormal electrograms. We defined an electrogram as late if any component extended beyond the end of the QRS. Examples of these electrograms are shown in Figure 11-17. The most common abnormalities were low voltage and increase in electrogram duration, both of which appear to be nonspecific markers of infarction or even poor contact. Multicomponent and fractionated electrograms, isolated late potentials and late electrograms were more closely related to arrhythmogenic sites; but the positive predictive value was only ∼30%.31 Only 14% of “sites of origin” came from sites that demonstrated normal electrograms. It should be obvious that since mapping catheters have different size electrode (tip and ring), normal and abnormal electrogram characteristics need to be defined for each catheter. Subsequent intraoperative studies using a 20 pole plaque electrode showed that successful surgery was associated with elimination of isolated late potentials and split potentials suggesting mechanistic significance (Fig. 11-18; see Chapter 13).37 Note the different normal values for electrodes that were 0.5 mm in width and 2-mm interelectrode distance.
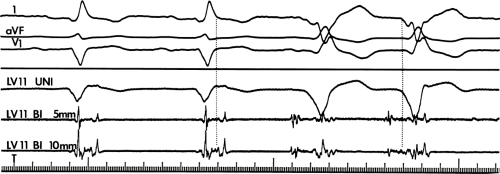 FIGURE 11-14 Relationship of VT to fractionated late potentials. Three surface leads are shown with unipolar and 5- and 10-mm bipolar recordings from the anterior wall of the left ventricle (LV11, see Fig. 11-16). The first two complexes are sinus in origin and the left ventricular recordings show markedly abnormal electrograms. Multiple components are present, and the electrogram exceeds 160 msec in duration. Moreover, the electrogram extends beyond the end of the QRS, producing significantly delayed endocardial ventricular activation. VT spontaneously begins, and this left ventricular site, which was recording late activity during sinus rhythm, records electrical activity 90 msec before the onset of the QRS during VT. This suggests a relationship between abnormal, low-amplitude, multicomponent, and late potentials with the areas from which VT originate. See text for discussion. CS, coronary sinus; HBE, His bundle electrogram; LVA, left ventricular apex; RVA, right ventricular apex; T, time line. |
We defined local activation time (LAT) at any site as time from the onset of the surface QRS to the time that the largest, rapid deflection of a local electrogram crossed the baseline. We defined total endocardial activation as the time from the earliest local activation to the time of the latest local activation. We used the total endocardial activation time, the duration of the longest electrogram recorded, the presence of late electrograms (including late potentials), and the extent of abnormal
electrograms as indicators of abnormalities of conduction. As can be seen in Table 11-2, patients with nonsustained VT and those without tachycardia but prior infarction have similar conduction abnormalities. Patients with sustained uniform VT have the most abnormal electrograms, while endocardial activation in those patients with cardiac arrest falls between nonsustained VT and sustained VT. Analog records of a patient demonstrating normal activation without coronary disease, a patient with coronary disease and prior infarction without inducible arrhythmias, and a patient with sustained uniform VT are shown in Figure 11-19. In general, patients with infarction have abnormalities of local and total endocardial activation; however, those with sustained VT have a greater number of sites demonstrating abnormal electrograms
of lower amplitude and longer duration, fractionated and late electrograms than those with coronary artery disease and no VT or nonsustained VT.32,35 Not surprisingly patients with inferior infarction have the latest onset and offset activation abnormalities normally: thus; with further delayed activation produced by inferior infarction, prolonged fractionated electrograms will be seen as late signals more easily than similar electrograms associated with anteroseptal infarction because activation begins earlier in the QRS.36 This is reflected in the analysis of signal-averaged ECG (SAECG) in patients with VT
and IMI versus AMI (see subsequent discussion of SAECG). These abnormalities of activation, whether recorded endocardially in the catheterization laboratory or intraoperatively, occur only in areas of prior infarction and significant wall motion abnormalities.35,36,38,39 It is of note that patients with spontaneous nonsustained VT who have sustained monomorphic VT induced by programmed stimulation have a greater number of abnormal electrograms, which correlate with a greater extent of infarction, than those patients who do not have sustained monomorphic VT inducible. The characteristics of the spontaneous nonsustained VT have no predictive value in determining which patient will have sustained monomorphic VT induced.40,41
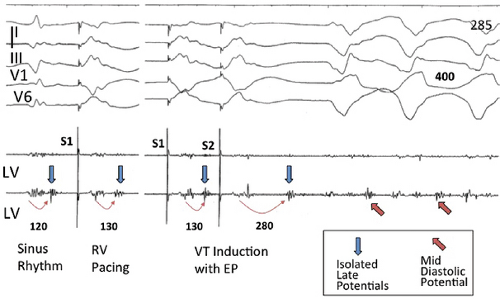 FIGURE 11-15 Relationship of isolated late potentials to induction of ventricular tachycardia. Late potentials noted during sinus rhythm and RV pacing (blue arrows) become further delayed following an extrastimulus (S2) and initiate VT during which they become mid-diastolic potentials (red arrows). See text for discussion. |
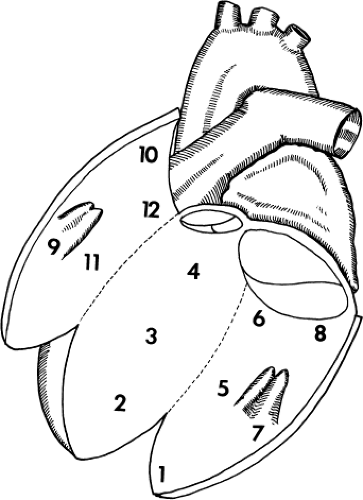 FIGURE 11-16 Mapping schema of the left ventricle. The left ventricle is opened anterolaterally. Sites 2, 3, and 4 are the septum, 1 is the apex, 5 and 6 are the mid- and basal inferior wall, 8 is the inferoposterior wall, 9 is the apical anterolateral wall, 10 is the basal lateral wall, 11 is the midanterior wall, and 12 is the basal anterior wall. (From Cassidy DM, Vassallo JA, Miller JM, et al. Endocardial catheter mapping in patients in sinus rhythm: relationship to underlying heart disease and ventricular arrhythmias. Circulation 1986;73:645.) |
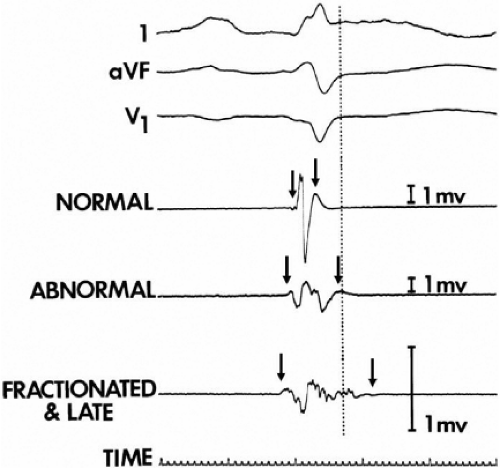 FIGURE 11-17 Examples of various types of electrograms. Three surface recordings accompanied by three local bipolar electrograms (normal, abnormal, and fractionated and late) recorded from different left ventricular endocardial sites are shown. The dashed vertical line denotes the end of the surface QRS activity. The arrows show the onset and offset (characterized by the amplification signal decay artifact) of local electrical activity. One-millivolt calibrations are seen. See text for discussion. (From Cassidy DM, Vassallo JA, Miller JM, et al. Endocardial catheter mapping in patients in sinus rhythm: relationship to underlying heart disease and ventricular arrhythmias. Circulation 1986;73:645.) |
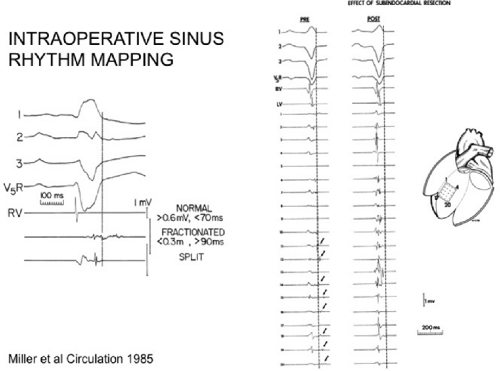 FIGURE 11-18 Intraoperative sinus rhythm mapping using a plaque electrode with 0.5-mm electrodes and a 2-mm interelectrode distance. Normal values and abnormal electrograms recorded with this plaque are shown on the left. Pre- and postoperative signals from the septum are shown on the right. Note all late potentials are removed by surgery. |
Table 11-2 Influence of Coronary Artery Disease and Clinical Arrhythmia | |||||||||||||||||||||||||||||||||||||||||||||||||||||||||||||||||||||||||||
|---|---|---|---|---|---|---|---|---|---|---|---|---|---|---|---|---|---|---|---|---|---|---|---|---|---|---|---|---|---|---|---|---|---|---|---|---|---|---|---|---|---|---|---|---|---|---|---|---|---|---|---|---|---|---|---|---|---|---|---|---|---|---|---|---|---|---|---|---|---|---|---|---|---|---|---|
| |||||||||||||||||||||||||||||||||||||||||||||||||||||||||||||||||||||||||||
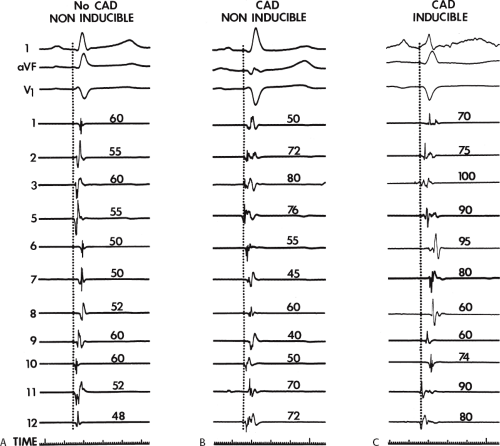 FIGURE 11-19 Sinus rhythm maps in patients with and without coronary disease who have no inducible arrhythmias and with coronary artery disease and inducible VT. All three tracings are arranged in the same manner with three ECG leads (l, aVF, and V1) and 11 of the 12 left ventricular mapping sites along with time lines. A: The patient with no coronary artery disease (CAD) and no inducible arrhythmias has relatively rapid endocardial activation, the electrograms have normal amplitude and duration. B: A sinus rhythm map is shown from a patient with CAD and prior infarction but no inducible arrhythmias. In this instance, the pattern of activation is normal but the electrograms are of broader duration and several have multiple components. None, however, are late. C: In a patient with prior infarction and inducible VT, many of the electrograms are abnormal and the sequence of activation is markedly distorted by areas of prior infarction. Many electrograms have multiple components, and several are recorded near the end of the QRS. See text for discussion. |
Although the anatomic substrate of patients presenting with cardiac arrest and sustained uniform VT is similar, tachycardias producing arrest have faster rates than tolerated VTs.42 Rate of tachycardia, and not the location of prior infarction, ejection fraction, or extent of coronary disease is the only factor that determines clinical outcome. This has been corroborated by other studies.22,23 Although the longer cycle length of hemodynamically tolerated monomorphic VT is associated with a greater extent of electrogram abnormalities on the endocardium, we have not demonstrated a correlation of VT cycle length to electrogram duration at the site of origin or any other specific electrogram characteristics observed during sinus rhythm mapping.31,33 This may reflect either a limitation
of extent of mapping (i.e., number of sites) in local regions, or that the cycle length of VT is more related to abnormalities of conduction that are anisotropic and not reflected by mapping during sinus rhythm.
of extent of mapping (i.e., number of sites) in local regions, or that the cycle length of VT is more related to abnormalities of conduction that are anisotropic and not reflected by mapping during sinus rhythm.
We43,44,45 and others29,46,47,48,49 have analyzed the cause of these electrogram abnormalities associated with VT in humans. Clearly, these fragmented or fractionated electrograms are not an artifact of filtering or motion, because such electrograms can neither be created nor abolished by changing the filtering and can be recorded with uni- or bipolar recordings in fixed pieces of tissue or in nonmoving and infarcted regions during intraoperative mapping.39,40,43 Anatomic studies of tissue removed from the site of origin of VT and sites distant from VT have demonstrated that abnormal electrograms are associated with a specific pathologic condition of viable muscle fibers imbedded in and separated by connective tissue.43,44,48,50 These muscle fibers may be abnormal or normal, but they are alive and associated with normal or near-normal action potentials.46,47,48 Recent studies using confocal microscopy and immunofluorescent staining of gap junctions showed an alteration in number, position, and, possibly, function of gap junctions.29,51,52 The amplitude of the electrograms seems to be most closely related to the duration and complexity of activation underneath the electrode which is influenced by the number and orientation of viable muscle fibers under the recording electrode and degree of fibrosis (Fig. 11-20). The extent and location of fibrosis is a critical determinant of the electrogram amplitude, duration, complexity, and timing because of its effect on fiber orientation, curvature, connectivity, and anisotropy, all of which influence conduction.
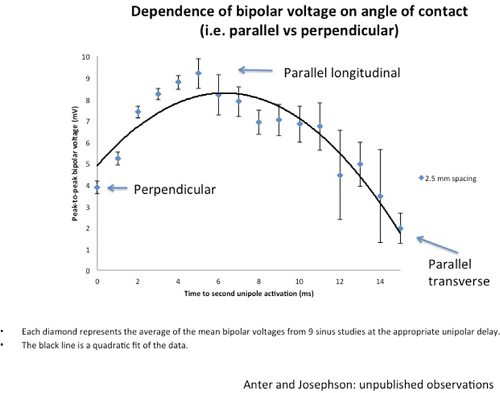 FIGURE 11-20 Dependence of bipolar voltage on angle of contact and conduction time between the two unipolar electrograms from which the bipolar electrogram is derived. The peak-to-peak bipolar amplitude in mV is plotted against the interelectrode activation time. The electrodes are 0.4 mm2 with a 2.5-mm interelectrode distance. When the bipolar pair of electrodes are more perpendicular to the tissue, the voltage is lower than when the electrodes are parallel to the surface with rapid activation between electrodes. When the wavefront is transverse to the bipoles, activation is slower and the amplitude of the bipolar electrogram is markedly reduced. |
Detailed mapping studies with microelectrodes in human tissue and in tissue from experimental canine tachycardia models29,43,44,46,47,48,50,51,52,53 demonstrate that slow propagation of an impulse through areas from which fractionated electrograms are recorded is associated with relatively normal action potentials of the muscle fibers. Response of these local electrograms to antiarrhythmic agents is also compatible with relatively normal action potential characteristics.54,55 Other studies have demonstrated that a reduced space constant and poor intercellular coupling caused by infarction lead to slow propagation of the cardiac impulse.56 Computer models by Lesh et al.57,58,59 and studies using dose-dependent changes in cellular resistance caused by heptanol57,60 confirm that changes in intercellular resistivity can alter conduction and produce fractionated electrograms. Thus, anatomic abnormalities can produce functional abnormalities (poor cellular coupling, impedance mismatch, altered curvature, etc.), which produce slow conduction, one of the necessary factors required for
reentrant VT to occur spontaneously or to be initiated. Slow conduction produced by ischemia (low pH), hyperkalemia, or uniform depression of Na channels reduces the peak-to-peak unipolar voltage and duration. It has a similar effect on bipolar signals but duration is less affected because far field activity, a contributor of unipolar duration, is markedly reduced in bipolar, especially filtered bipolar, recordings. Thus the peak-to-peak voltage is a direct reflection of conduction velocity and not of tissue mass. Scar effects voltage by impacting the conduction velocity and activation time. Only a small amount of scar can produce markedly abnormal electrograms. We have shown that most of the cause of low-amplitude and fractionated electrograms and late potentials secondary to infarction is produced by ≈2 mm of endocardial scar.37 Removal of that 2 mm scar by subendocardial resection (SER) eliminates late potentials and normalizes half of the subjacent electrograms.37 The remaining electrograms still show low voltage and fractionation, but to a much lesser degree than prior to SER (Fig. 11-21). Thus, the scar also acts as an insulator of underlying electrograms. In summary, scar (even a small amount) slows conduction and some loss of tissue. Loss of tissue alone, without fibrosis induced changes in activation due to separation of myocytes would not produce fractionated, low-voltage electrograms or late potentials. The unipolar and bipolar signals would show low-voltage, broad electrograms without fractionation. These abnormalities of the electrograms are most closely related to fibrosis-dependent effects on conduction, not loss of tissue. The use of sinus rhythm mapping in localizing the arrhythmogenic substrate for ablation of untolerated ventricular arrhythmias is discussed in Chapter 13.
reentrant VT to occur spontaneously or to be initiated. Slow conduction produced by ischemia (low pH), hyperkalemia, or uniform depression of Na channels reduces the peak-to-peak unipolar voltage and duration. It has a similar effect on bipolar signals but duration is less affected because far field activity, a contributor of unipolar duration, is markedly reduced in bipolar, especially filtered bipolar, recordings. Thus the peak-to-peak voltage is a direct reflection of conduction velocity and not of tissue mass. Scar effects voltage by impacting the conduction velocity and activation time. Only a small amount of scar can produce markedly abnormal electrograms. We have shown that most of the cause of low-amplitude and fractionated electrograms and late potentials secondary to infarction is produced by ≈2 mm of endocardial scar.37 Removal of that 2 mm scar by subendocardial resection (SER) eliminates late potentials and normalizes half of the subjacent electrograms.37 The remaining electrograms still show low voltage and fractionation, but to a much lesser degree than prior to SER (Fig. 11-21). Thus, the scar also acts as an insulator of underlying electrograms. In summary, scar (even a small amount) slows conduction and some loss of tissue. Loss of tissue alone, without fibrosis induced changes in activation due to separation of myocytes would not produce fractionated, low-voltage electrograms or late potentials. The unipolar and bipolar signals would show low-voltage, broad electrograms without fractionation. These abnormalities of the electrograms are most closely related to fibrosis-dependent effects on conduction, not loss of tissue. The use of sinus rhythm mapping in localizing the arrhythmogenic substrate for ablation of untolerated ventricular arrhythmias is discussed in Chapter 13.
The development of three-dimensional (3D) mapping systems has allowed more detailed characterization of the electrophysiologic substrate of healed infarction, as a greater number of sites can be collected and the spatial relationships of these sites can be understood. Importantly, the use of different recording systems and catheter types requires standardization, particularly the establishment of a new set of normal values. For example, using the Carto XP system (Biosense, Johnson & Johnson) Marchlinski et al.61 found normal bipolar voltage (4-mm tip electrode to the second pole, 2-mm proximal, filtered at 10 to 400 Hz) is ≈1.6 mV in the LV and 1.3 mV in the RV. This unusual filter setting is preset in the Carto XP system and is different from the 30 to 500 Hz settings used in our initial studies with a different catheter.30 Normal values in our patients using the Carto system are similar (1.4 to 1.7 mV, apex and base of LV, respectively; and 1.3 mV in the RV). Unfortunately, no duration standards are available because of the lack of “fixed” gain recordings. The newer Carto 3 system has bipolar filters preset at 16 to 240 Hz; this filtering gives slightly different normal. In order to make meaningful comparisons among published data filter settings and catheter tip and ring electrode size and interelectrode distance must be comparable. We use standard filter settings (30 to 500 Hz for bipolar and 0.05 to 500 Hz for unipolar recordings) and identical catheters (3.5- to 4-mm tip, 2-mm ring and 1-mm interelectrode distance). Unfortunately while most laboratories use preset filter settings regardless of the system they use, other laboratories try to be systematic like us. Thus it is hard to interpret differences in data, particularly when those recordings are used to guide ablation (see Chapter 13). The high-pass filter markedly influence unipolar signals while the low pass setting influences the degree of fractionation in bipolar signals.
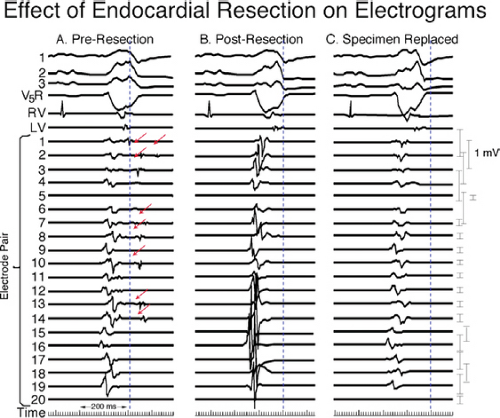 FIGURE 11-21 Effect of subendocardial resection on bipolar electrograms. The electrograms are recorded with the same plaque used in Figure 11-18. Following removal of 2 to 3 mm of tissue the late potentials in sinus rhythm are removed and the amplitude of 50% of the underlying tissue normalizes. When the resected tissue is replace the voltage is reduced to preresection levels, without late potentials. See text for discussion. |
Since these electrophysiologic data can be displayed in 3D space, detailed sinus rhythm voltage mapping has been used to
characterize infarct anatomy despite the fact that voltage reflects conduction/activation time, not tissue mass. Several studies in animal models62,63 and in man61,64,65 have demonstrated that bipolar endocardial voltage mapping in sinus rhythm provides a reasonable approximation of the infarct architecture (Fig 11-22). Contiguous areas of low voltage defines the endocardial extent of the infarct scar. In patients with VT in the setting of healed infarction, this area can be considerable. For example, in one study of such patients the mean infarct area in patients referred for VT ablation was 65 ± 24 cm2 (range 51 to 110 cm2).61 It is critical the one realize that electrograms only reveal the properties of the first few millimeters of scar. In addition to allowing insight into the electrophysiologic substrate of VT in various forms of structural heart disease, substrate mapping has led to the development of substrate-based ablation for unmappable VTs (see Chapter 13).
characterize infarct anatomy despite the fact that voltage reflects conduction/activation time, not tissue mass. Several studies in animal models62,63 and in man61,64,65 have demonstrated that bipolar endocardial voltage mapping in sinus rhythm provides a reasonable approximation of the infarct architecture (Fig 11-22). Contiguous areas of low voltage defines the endocardial extent of the infarct scar. In patients with VT in the setting of healed infarction, this area can be considerable. For example, in one study of such patients the mean infarct area in patients referred for VT ablation was 65 ± 24 cm2 (range 51 to 110 cm2).61 It is critical the one realize that electrograms only reveal the properties of the first few millimeters of scar. In addition to allowing insight into the electrophysiologic substrate of VT in various forms of structural heart disease, substrate mapping has led to the development of substrate-based ablation for unmappable VTs (see Chapter 13).
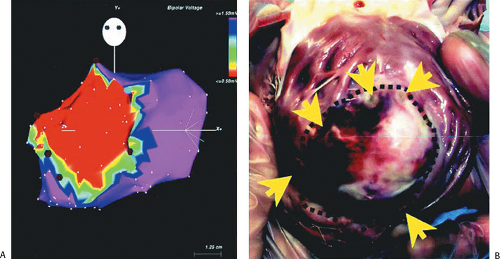 FIGURE 11-22 Electroanatomic mapping in a porcine model of myocardial infarction. A: Sinus rhythm voltage map of the LV is shown in the AP projection, with red color denoting bipolar electrograms ≤0.5 mV denoting dense scar. Red dots denote sites of RV ablation lesions intentionally delivered at the infarct border. B: Gross pathology of the infarct and ablation lesions is shown. Yellow arrows denote the site of ablation lesions, which were consistently identified at the border of the dense scar. These data support the accuracy of sinus rhythm voltage mapping for representing the infarct anatomy. (From Wrobleski D, Houghtaling C, Josephson ME, et al. Use of electrogram characteristics during sinus rhythm to delineate the endocardial scar in a porcine model of healed myocardial infarction. J Cardiovasc Electrophysiol 2003;14:524.) |
Studies that have performed activation and entrainment mapping during VT in the context of sinus rhythm voltage mapping provides a further understanding of the relationship of the infarct border zone (1.0 to 1.5 mV as arbitrarily defined by Marchlinski et al.61 using standard ablation catheter and the VT circuit). Dense scar was defined as voltage ≤ 0.5 mV. Virtually all of the VTs we have mapped have their critical isthmus within areas with voltage <0.5 mV, which is a reflection of the first 2 to 3 mm of endocardial tissue. Exits from the isthmus are rarely in the “border zone.” Using higher resolution mapping with the Rhythmia system we have found many viable areas in what was presumed to be dense scar or even dead using standard ablation (3.5-mm tip). Many of isthmuses are found in regions of 0.1 to 0.5 mV using this higher resolution mapping system (Fig. 11-23). This observation is supported by intraoperative mapping and the effects of SER on diastolic pathways and late potentials as noted earlier.36 Several investigators66,67 have used combinations of sinus rhythm voltage mapping using different thresholds for dense scar (0.1 to 0.5 mV) and entrainment mapping during VT to determine that the VT circuit path follows relatively high-voltage “channels” within the infarct scar (Fig. 11-24) (see section on mapping below and in Chapter 13). While this sounds good and has resulted in successful ablation, the pathology of VT shows muscle bundles of 50 to 200 micron associated with late potentials in sinus rhythm and diastolic pathways during VT in tissue removed at successful surgery.45 This is much smaller than the 1-cm pathways demonstrated by changing voltage criteria or using electrical inexcitability to define scar.64 Catheter mapping using 3.5- to 4-mm tip electrodes does not have the resolution to detect such small viable fibers and usually record “normal or near-normal” voltage if adjacent large muscle bundles are present and dense scar in areas shown to be viable using much smaller electrodes.
Presently most endocardial voltage maps during sinus rhythm and activation maps during VT typically are acquired by point-by-point mapping using the Carto system. Recently
St Jude’s Navix system has been shown to be comparable to Carto for voltage and its underlying anatomic scar.68 Detailed electroanatomic mapping can also be performed with noncontact techniques, which theoretically allow acquisition within a single beat.69 Low-voltage areas corresponding to the infarct can be determined in sinus rhythm by “deflection” of the wavefront demonstrated on isopotential mapping (Fig. 11-25). In a porcine model of infarction, channels of preferential conduction out of the infarct can be identified when pacing inside the infarct.70 These channels appear to identify sites that are essential to the VT circuit. Where these are in relation to the electroanatomically defined border has not been assessed. If confirmed in human VT, this observation could allow VT mapping without induction of specific VT morphologies. A major limitation is the imprecision with which these pathways are defined by noncontact methods. In addition sites behind the papillary muscles are hidden from the view of the recording catheter. The more recent use of multipolar contact mapping with small electrodes using the PentaRay Biosense catheter and the new Rhythmia mapping system (see Chapter 1) can detect small fiber bundles that are not detected by the standard 3.5- to 4-mm mapping/ablation catheters. These are invariably recorded in areas of scar with voltages between 0.1 and 0.5 mV.
St Jude’s Navix system has been shown to be comparable to Carto for voltage and its underlying anatomic scar.68 Detailed electroanatomic mapping can also be performed with noncontact techniques, which theoretically allow acquisition within a single beat.69 Low-voltage areas corresponding to the infarct can be determined in sinus rhythm by “deflection” of the wavefront demonstrated on isopotential mapping (Fig. 11-25). In a porcine model of infarction, channels of preferential conduction out of the infarct can be identified when pacing inside the infarct.70 These channels appear to identify sites that are essential to the VT circuit. Where these are in relation to the electroanatomically defined border has not been assessed. If confirmed in human VT, this observation could allow VT mapping without induction of specific VT morphologies. A major limitation is the imprecision with which these pathways are defined by noncontact methods. In addition sites behind the papillary muscles are hidden from the view of the recording catheter. The more recent use of multipolar contact mapping with small electrodes using the PentaRay Biosense catheter and the new Rhythmia mapping system (see Chapter 1) can detect small fiber bundles that are not detected by the standard 3.5- to 4-mm mapping/ablation catheters. These are invariably recorded in areas of scar with voltages between 0.1 and 0.5 mV.
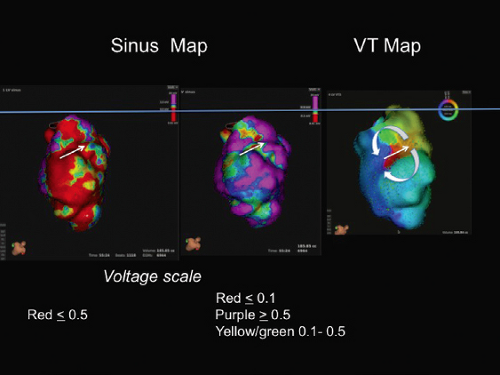 FIGURE 11-23 Relationship of isthmus during VT to voltage recorded in sinus rhythm. Voltage maps are shown in the two maps on the left. The voltage scale is shown below each map. On the left red identifies sites less than 0.5 mV. In the middle red signifies tissue with less than 0.1 mV. On the right is an activation map during VT showing figure-of-eight reentry (red early, purple late). The white arrow identifies the site of the isthmus. See text for discussion. |
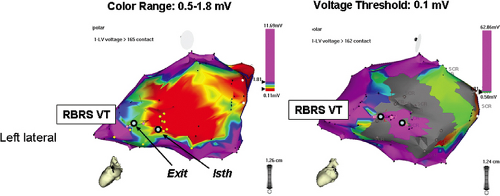 FIGURE 11-24 Relatively high-voltage “channels” within the infarct may be important to conduction within the VT circuit. A left lateral view of a voltage map performed in sinus rhythm in a patient with a large posterolateral infarction is shown. In the left panel, a typical color pattern for voltage mapping is displayed. In addition, the results of entrainment mapping, showing sites demonstrating relationship to the VT circuit in light blue dots (exit; isth, isthmus site). By varying the color display on the voltage map as in the right panel (where sites ≤0.5 mV are shown in gray and sites >1.0 mV are shown in purple, it can be seen that the sites within the circuit (blue dots) are within a “channel” of relatively preserved voltage, compared to the rest of the infarct. (From Hsia H, Lin D, Sauer W. Anatomic characterization of endocardial substrate for hemodynamically stable reentrant ventricular tachycardia: Identification of endocardial conducting channels. Heart Rhythm 2005;3;503–512.) |
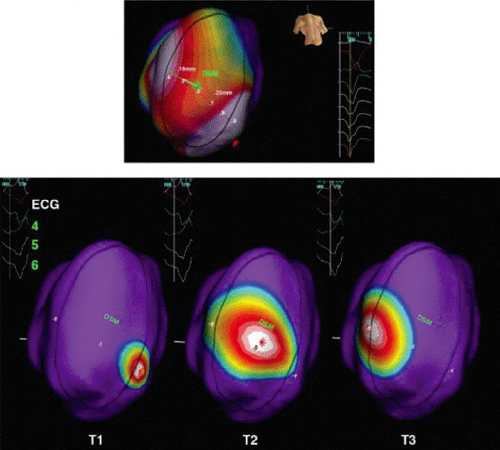 FIGURE 11-25 Noncontact substrate mapping in a porcine model of anterior infarction. In this type of mapping, the infarct is identified (outlined by black ellipse) by low voltage and slow conduction during sinus rhythm and pacing around the borders of the infarct. Isopotential mapping, which tracts unipolar activation wavefronts, is denoted by the color display: sites depicted in white represent the activation wavefront, sites in purple are resting and colors in between represent sites with lower voltage unipolar electrograms, representing sites that are about to be activated or recovering from just being activated. Areas that appear to be important for conduction out of the infarct to normal tissue are identified by pacing within the substrate (top panel). In this example, there are two relatively discrete sites of exit from the substrate, occurring at 5:00 and 9:30 if the substrate is viewed as a clock face. As shown in the bottom panel, these same sites appear to be important for conduction during VT. T1, T2, T3 are frames taken in advancing time. T1 shows the activation wavefront during VT entering the substrate that 5:00 (one of the pacing exit sites) and sweeping across the substrate to exit at 9:30 (the other pacing exit site). See text for discussion. (From Jacobson J, Afonso VX, Eisenman G, et al. Characterization of the infarct substrate and ventricular tachycardia circuits with noncontact unipolar mapping in a porcine model of myocardial infarction. Heart Rhythm 2006;3:189–197.) |
In patients with VT in the setting of LV cardiomyopathy, endocardial sinus rhythm mapping has not identified abnormalities as dramatic as those seen in patients with coronary artery disease.32 For example, when patients with cardiomyopathy (either hypertrophic or dilated) and ventricular arrhythmias are compared to those with coronary artery disease, significant differences are noted (Table 11-3). Patients with cardiomyopathy in general have more normal endocardial activation and normal electrograms. Even when abnormal, the electrograms are rarely fractionated; in general, fractionated electrograms are observed only in patients with sustained VT, which is a relatively rare presenting arrhythmia in patients with LV cardiomyopathy (Table 11-4). Endocardial activation in patients with cardiomyopathy presenting with cardiac arrest and nonsustained VT does not differ significantly from that in normal individuals. Only ≈10% of sites will be abnormal, primarily because of the duration of the electrogram. When patients with cardiomyopathy are divided into those with and without arrhythmias, the only group of patients in whom significant abnormalities of activation and of conduction are noted are those with sustained uniform VT (Table 11-3). These patients have more abnormal sites and are the only patients with fractionated sites. In addition, the duration of the longest electrogram in patients with cardiomyopathy and sustained uniform VT is markedly prolonged when compared to patients with cardiomyopathy and other arrhythmias. Analysis of electrogram distribution in patients with nonsustained and sustained VT with coronary artery disease and cardiomyopathy is shown in Figure 11-26. Compared to patients with coronary artery disease and VT, patients with cardiomyopathy have fewer abnormal sites, fewer fractionated sites, and relatively normal overall endocardial activation with virtually no late sites. The data from these studies and those of Vassallo et al.71,72 analyzing ventricular electrograms
and activation sequences in patients with LBBB in patients with coronary artery disease and cardiomyopathy suggest that endocardial activation is nearly normal in patients with cardiomyopathy.
and activation sequences in patients with LBBB in patients with coronary artery disease and cardiomyopathy suggest that endocardial activation is nearly normal in patients with cardiomyopathy.
Table 11-3 Influence of Underlying Heart Disease | ||||||||||||||||||||||||||||||||||||
|---|---|---|---|---|---|---|---|---|---|---|---|---|---|---|---|---|---|---|---|---|---|---|---|---|---|---|---|---|---|---|---|---|---|---|---|---|
| ||||||||||||||||||||||||||||||||||||
In the subset of patients with dilated cardiomyopathy who have frequent episodes of uniform sustained VT, sinus rhythm voltage mapping abnormalities can be identified. Studies using electroanatomic mapping have demonstrated qualitatively similar, but quantitatively different endocardial areas of low-voltage and less fractionated electrograms and late potentials compared to patients with sustained VT due to healed infarction.73 In 19 patients with VT in the setting of DCM, low-voltage areas were smaller in area than in patients with healed infarction and VT (20% vs. 42% of endocardial surface) and were typically confined to areas around the mitral and aortic annulae (Fig. 11-27). In patients with dilated cardiomyopathy caused by more focal insults (e.g., myocarditis, sarcoidosis), this predilection to the perivalvular area is not always observed (Fig. 11-28). Importantly, endocardial VT mapping demonstrated that areas of low voltage, fractionation, and late potentials provided the substrate that supported the VT circuit in this clinical setting as well. In patients with dilated cardiomyopathy sinus rhythm voltage
and electrogram abnormalities may be more evident on the epicardium and VT circuits can be mapped to the epicardium preferentially (Fig. 11-29).74 This observation is consistent with findings from intraoperative mapping of patients with cardiomyopathy undergoing defibrillator implantation or surgery which demonstrated transmural and/or epicardial conduction abnormalities. Recent studies by Sosa et al.75,76 suggest epicardial abnormalities are present in patients with Chagas disease.
and electrogram abnormalities may be more evident on the epicardium and VT circuits can be mapped to the epicardium preferentially (Fig. 11-29).74 This observation is consistent with findings from intraoperative mapping of patients with cardiomyopathy undergoing defibrillator implantation or surgery which demonstrated transmural and/or epicardial conduction abnormalities. Recent studies by Sosa et al.75,76 suggest epicardial abnormalities are present in patients with Chagas disease.
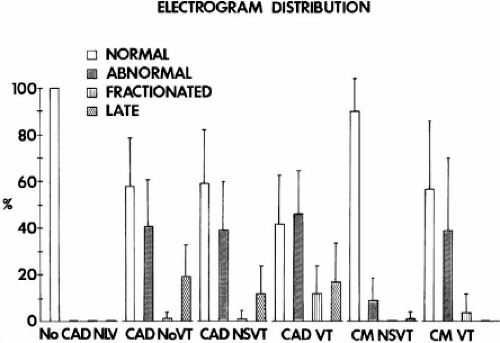 FIGURE 11-26 Electrogram distribution in different patient populations. The incidence of normal, abnormal, fractionated, and late electrograms in patients with no heart disease and normal left ventricles (NLV), coronary artery disease (CAD) and no VT, CAD and nonsustained VT (NSVT), CAD and sustained VT, cardiomyopathy (CM) and NSVT, and CM with sustained VT. Patients with sustained VT have the highest incidence of abnormal electrograms as well as fractionated and late electrograms. Patients with prior infarction actually have more abnormal and late electrograms than patients with CM. See text for discussion. |
Table 11-4 Influence of Cardiomyopathy and Clinical Arrhythmia | ||||||||||||||||||||||||||||||||||||||||||||||||||||||||||||
|---|---|---|---|---|---|---|---|---|---|---|---|---|---|---|---|---|---|---|---|---|---|---|---|---|---|---|---|---|---|---|---|---|---|---|---|---|---|---|---|---|---|---|---|---|---|---|---|---|---|---|---|---|---|---|---|---|---|---|---|---|
| ||||||||||||||||||||||||||||||||||||||||||||||||||||||||||||
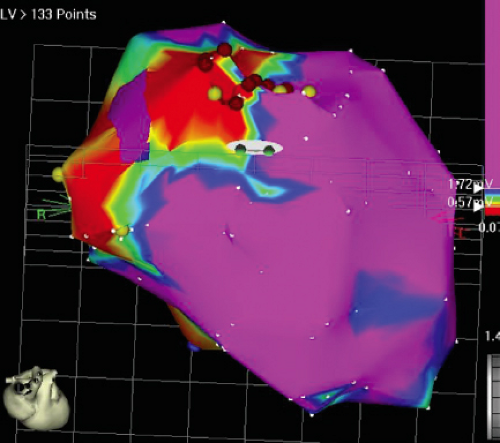 FIGURE 11-27 Sinus rhythm voltage mapping in nonischemic cardiomyopathy. Voltage maps are shown in a coronal view. Purple-colored areas represent normal endocardium (voltage ≥1.8 mV), red areas represent dense scar (voltage ≤0.5 mV) with the border zone indicated by the intervening colors. Typically the endocardial voltage abnormalities observed in such patients are limited to the perimitral valve area. |
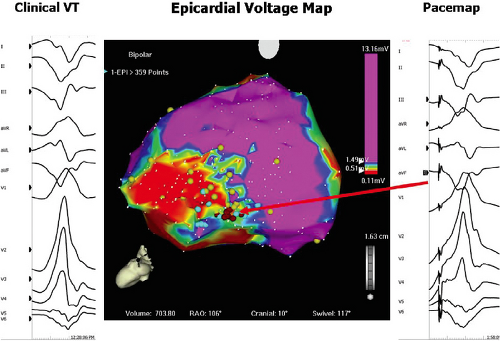 FIGURE 11-28 Epicardial voltage mapping in a patient with cardiac sarcoid and sustained VT. The electroanatomic map is shown in posterior–anterior projection; the voltage scale is color coded so that normal tissue is displayed in purple (bipolar electrograms ≥1.5 mV) and dense scar in red (<0.5 mV). Unlike most patients with dilated cardiomyopathy and VT, where mapping demonstrates a perivalvular substrate, this patient had apical voltage map abnormalities. Pace mapping, performed to approximate the exit site of the VT circuit, also localizes the site of the circuit to the apical voltage abnormality. Ablation at this site resulted in prevention of clinical VT episodes. |
This has led to interest in detecting abnormalities deeper than the subendocardium. Unipolar mapping has gained popularity in defining intramural and/or subepicardial scar. As noted above electrogram abnormalities, either unipolar or bipolar, reflect propagation and not necessarily tissue mass. As such I consider electrogram abnormalities to reflect conduction abnormalities, which may be caused by functional or anatomic abnormalities. Hutchinson et al.,77 using the Carto XP system with filtering set at 1 to 400 HZ defined “normal” unipolar voltage recorded from the LV endocardium was 8.3 mV. Other filter settings and systems (Carto 3) have been used by different investigators in populations with sustained VT associated with prior myocardial infarction and cardiomyopathy.78,79 While the values for “normal” differ a little, these studies show a correlation between the low-voltage endocardial unipolar mapping and low-voltage epicardial bipolar mapping and gadolinium enhancement by MRI. Similar studies have not been performed in normal populations or in those with cardiomyopathy and no VT. We have used filtering at 0.05 to 500 in all Carto systems in patients with and without VT and have normal values of ∼7.5 mV in the absence of hypertrophy. I have found a high incidence of false negatives in patients with hypertrophic cardiomyopathy (Fig. 11-30) and other hypertrophic states using delayed gadolinium enhancement as the marker of scar. Moreover, while the “intramural/subepicardial scar depicted by unipolar mapping in these highly selected patients appear to correlate with bipolar epicardial mapping, the interpretation that this represents “microfibrosis” is not proven. The presence of delayed enhancement defines macro fibrosis. Patients with dilated cardiomyopathy typically have patchy fibrosis, and large unipolar voltage in the precordial
leads and normal unipolar endocardial maps. This could in fact be recorded in the presence of microfibrosis. The signature of micro- or macrofibrosis is nonuniform anisotropic conduction, not decreased voltage. We still require methods to detect inapparent conduction abnormalities cause by microfibrosis. While sustained VT in cardiomyopathy appears to frequently have an intramural or subepicardial origin, patients with infarction-related VT may also arise in deeper layers and may be detected by unipolar abnormalities beyond the endocardial substrate (analogous to the gray zone by MRI).79 While Hutchinson et al.77 suggest this may explain the reason for failed endocardial ablation for infarct-related VT, these conclusions are fraught with many limitations. These include short follow-up (3 months), inadequate definition of the correlation between critical sites defined by pace-mapping versus entrainment mapping, proof of adequacy of determining critical sites, and the absence of ECGs of recurrent VTs to see if they were the same as the original VTs targeted for ablation.
leads and normal unipolar endocardial maps. This could in fact be recorded in the presence of microfibrosis. The signature of micro- or macrofibrosis is nonuniform anisotropic conduction, not decreased voltage. We still require methods to detect inapparent conduction abnormalities cause by microfibrosis. While sustained VT in cardiomyopathy appears to frequently have an intramural or subepicardial origin, patients with infarction-related VT may also arise in deeper layers and may be detected by unipolar abnormalities beyond the endocardial substrate (analogous to the gray zone by MRI).79 While Hutchinson et al.77 suggest this may explain the reason for failed endocardial ablation for infarct-related VT, these conclusions are fraught with many limitations. These include short follow-up (3 months), inadequate definition of the correlation between critical sites defined by pace-mapping versus entrainment mapping, proof of adequacy of determining critical sites, and the absence of ECGs of recurrent VTs to see if they were the same as the original VTs targeted for ablation.
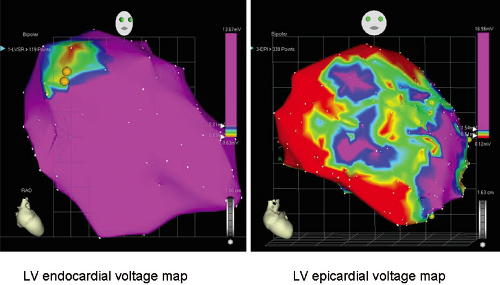 FIGURE 11-29 Sinus rhythm voltage mapping in nonischemic cardiomyopathy. Endocardial mapping in this patient with recurrent uniform VT did not demonstrate electrogram abnormalities. Epicardial mapping demonstrated contiguous areas of low-voltage, abnormal electrograms that served as the substrate for reentrant VT. |
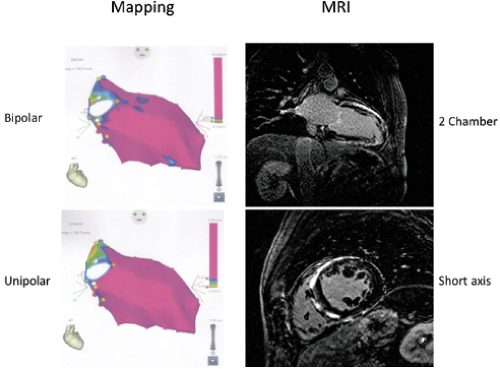 FIGURE 11-30 Limitation of endocardial unipolar mapping to identify epicardial/subepicardial substrate. Bipolar and unipolar maps filtered at0.03 to 500 and 30 to 500, respectively are shown with MRI in a patient with hypertrophic cardiomyopathy. The unipolar map is normal despite diffuse late gadolinium enhancement. See text for discussion. |
An analogous electroanatomic mapping study was performed to investigate the electrophysiologic substrate of right
ventricular cardiomyopathy (RV dysplasia).80 In 21 patients with recurrent VT, contiguous areas of low-voltage abnormal electrograms measured 55 ± 37 cm2, representing 34% of the RV surface area. Areas of abnormal electrograms always involved the RV-free wall, spared the RV apex, and were said to include the intraventricular septum (15/21 patients). This observation differs from the accepted description of the “triad” of arrhythmogenic RV dysplasia (ARVD).81 In addition, the majority of abnormal electrograms as well as VT sites of origin, were located in perivalvular areas—the tricuspid valve (5 patients), the pulmonic valve (6 patients), or both (10 patients) (Fig. 11-31). However, the “septal” areas were in the RVOT which has no abutting septum; the true septum appears normal. My experience in 24 cases studied prior to and during the electroanatomic mapping era is that abnormalities are in the RVOT, the RV-free wall, and the region of the tricuspid annulus. In some patients these areas were confluent. The true septum was, spared (Figs. 11-31 and 11-32). Of interest is that the region at the tricuspid annulus was the most frequently associated with VTs that I have mapped. Unipolar mapping has identified large epicardial abnormalities in this population,82 the pathology of which has been known to have early epicardial involvement.81 Such mapping has led to early epicardial approaches to ablate VTs in ARVD.
ventricular cardiomyopathy (RV dysplasia).80 In 21 patients with recurrent VT, contiguous areas of low-voltage abnormal electrograms measured 55 ± 37 cm2, representing 34% of the RV surface area. Areas of abnormal electrograms always involved the RV-free wall, spared the RV apex, and were said to include the intraventricular septum (15/21 patients). This observation differs from the accepted description of the “triad” of arrhythmogenic RV dysplasia (ARVD).81 In addition, the majority of abnormal electrograms as well as VT sites of origin, were located in perivalvular areas—the tricuspid valve (5 patients), the pulmonic valve (6 patients), or both (10 patients) (Fig. 11-31). However, the “septal” areas were in the RVOT which has no abutting septum; the true septum appears normal. My experience in 24 cases studied prior to and during the electroanatomic mapping era is that abnormalities are in the RVOT, the RV-free wall, and the region of the tricuspid annulus. In some patients these areas were confluent. The true septum was, spared (Figs. 11-31 and 11-32). Of interest is that the region at the tricuspid annulus was the most frequently associated with VTs that I have mapped. Unipolar mapping has identified large epicardial abnormalities in this population,82 the pathology of which has been known to have early epicardial involvement.81 Such mapping has led to early epicardial approaches to ablate VTs in ARVD.
Hypertrophic cardiomyopathy, both with and without obstruction, is associated with a high incidence of sudden cardiac death. Although electrograms observed during sinus rhythm mapping appear similar to those in dilated cardiomyopathy, the response of these electrograms to ventricular extrastimuli (VES) may distinguish patients at risk. We initially observed fractionation of electrograms at the RV apex and RV outflow in response to VES in members of high-risk families with hypertrophic obstructive cardiomyopathy.83 Saumarez et al.84,85 have confirmed our findings and demonstrated that patients with lethal arrhythmias show a greater degree of fragmentation (i.e., longer duration) at longer coupling intervals (i.e., longer relative refractory periods) than in patients without such a history. As noted above, I have not found endocardial unipolar mapping to be of value in this population. Further work is necessary to characterize the sites and mechanism of conduction abnormalities in patients with all forms of cardiomyopathy.
If an epicardial substrate is suggested by endocardial unipolar mapping in a patient with cardiomyopathy and VT with ECG features suggesting epicardial origin, direct epicardial mapping of the substrate and VT is required (see Chapter 13). Epicardial fat hinders interpretation of epicardial substrate mapping using low voltage as a marker of abnormality because the fat decreases the EGM amplitude due to insulation of the tissue from the recording electrode. It does not; however, result in multicomponent or fractionated EGMs or late potentials, which are markers of fibrosis and abnormal myocardial activation.
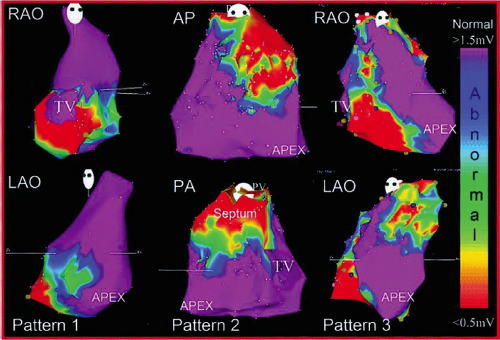 FIGURE 11-31 Sinus rhythm voltage mapping in right ventricular cardiomyopathy and ventricular tachycardia. Patterns of voltage mapping abnormalities were typically related to perivalular areas: near the tricuspid valve (pattern 1), the pulmonic valve (pattern 2) or both (pattern 3). Purple-colored areas represent normal endocardium (voltage ≥1.8 mV), red areas represent dense scar (voltage ≤0.5 mV) with the border zone indicated by the intervening colors. (From Marchlinski FE, Zado EZ, Dixit S, et al. Electroanatomic substrate and outcome of catheter ablative therapy for ventricular tachycardia in the setting of right ventricular cardiomyopathy. Circulation 2004;110:2293–2298.) |
Signal averaging techniques have been developed to record this substrate of prolonged, asynchronous conduction from the surface of the heart.84,85,86,87,88,89,90,91 Basically orthogonal XYZ leads are used, and after signal averaging and high-pass (above 40 Hz) filtering, the leads are combined into a vector magnitude (X2 + Y2 + Z2, RMS amplitude), a measurement that sums up the high-frequency information contained in all of these leads. This vector magnitude is often called the filtered QRS complex. The duration of the QRS and the amplitude of the high-frequency signals in the last 40 msec (so-called late potentials) have been used with the duration of terminal activity beneath 40 mV, as a measure of abnormalities of conduction associated with arrhythmias. Normal values are a
QRS duration of ≤114 msec, an RMS amplitude in the last 40 msec of >20 μV, and a duration of the signal <40 μV of ≤38 msec. Of note, the filtered QRS duration is shorter for women than for men.91 No systematic studies have validated the use of the SAECG in patients with IVCDs or bundle branch block. An example of a normal SAECG and an abnormal one from a patient with VT are shown in Figure 11-33. Studies in patients with VT and coronary artery disease have demonstrated that the low-amplitude late potentials are related to fragmented electrical signals extending beyond the QRS. Both the number of sites and duration of this fragmented activity influence the ability to record a late potential using signal averaging.92 In coronary artery disease and prior infarction, 88% of signals recorded during the late potential are from the endocardium (Fig. 11-34).93,94 The incidence of positive SAECGs (i.e., increased duration of the filtered QRS and/or late potentials) is highest in patients with infarction-related sustained uniform VT (approximately 85%) and is lower for patients presenting with cardiac arrest (approximately 55%) and nonsustained VT (approximately 50%).84,85,86,88,90,91,95,96 Patients with inferior wall infarction (particularly those with nonsustained VT) have a higher incidence of late potentials than those with anterior infarction.96 This is most likely related to the ease with which late potentials can be recorded from inferobasal sites of infarction, which are normally activated late in the QRS. These findings are directly related to the abnormal electrograms noted on the endocardium during sinus rhythm mapping.92,93 These abnormalities of conduction recorded on the body surface have been evaluated and approved for predicting lethal arrhythmias postmyocardial infarction97 as well as determining which patients with syncope might have ventricular arrhythmias as the cause.97,98,99,100 In all studies the QRS duration appears to be the most sensitive measurement, the others being not independently predictive.
QRS duration of ≤114 msec, an RMS amplitude in the last 40 msec of >20 μV, and a duration of the signal <40 μV of ≤38 msec. Of note, the filtered QRS duration is shorter for women than for men.91 No systematic studies have validated the use of the SAECG in patients with IVCDs or bundle branch block. An example of a normal SAECG and an abnormal one from a patient with VT are shown in Figure 11-33. Studies in patients with VT and coronary artery disease have demonstrated that the low-amplitude late potentials are related to fragmented electrical signals extending beyond the QRS. Both the number of sites and duration of this fragmented activity influence the ability to record a late potential using signal averaging.92 In coronary artery disease and prior infarction, 88% of signals recorded during the late potential are from the endocardium (Fig. 11-34).93,94 The incidence of positive SAECGs (i.e., increased duration of the filtered QRS and/or late potentials) is highest in patients with infarction-related sustained uniform VT (approximately 85%) and is lower for patients presenting with cardiac arrest (approximately 55%) and nonsustained VT (approximately 50%).84,85,86,88,90,91,95,96 Patients with inferior wall infarction (particularly those with nonsustained VT) have a higher incidence of late potentials than those with anterior infarction.96 This is most likely related to the ease with which late potentials can be recorded from inferobasal sites of infarction, which are normally activated late in the QRS. These findings are directly related to the abnormal electrograms noted on the endocardium during sinus rhythm mapping.92,93 These abnormalities of conduction recorded on the body surface have been evaluated and approved for predicting lethal arrhythmias postmyocardial infarction97 as well as determining which patients with syncope might have ventricular arrhythmias as the cause.97,98,99,100 In all studies the QRS duration appears to be the most sensitive measurement, the others being not independently predictive.
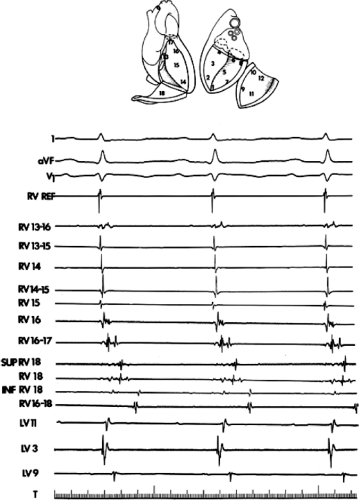 FIGURE 11-32 Sinus rhythm mapping in ARVD. A sinus map in a patient with ARVD and sustained VT is shown. Markedly fragmented and delayed EGMs are seen in the RVOT and the free wall of the RV. The true septum is spared. The delayed activation correlates with the epsilon wave on the surface ECG. |
The primary use of signal-averaged electrocardiography has been in postinfarction patients.90,91 Unfortunately it has a positive predictive value of ≈20%, although its negative predictive value approaches 95%. Similar good negative predictive values have been reported for patients with syncope,98 but the gold standard for this clinical syndrome upon which sensitivity was based was inducibility of sustained VT. It is unclear whether inducible VT is an appropriate endpoint. The role of
the SAECG in predicting inducible sustained VT in patients with prior infarction and nonsustained VT and ejection fractions less than 40% has recently been evaluated in the Multicenter Unstained Tachycardia Trial (MUSTT). Despite earlier, nonrandomized studies that suggested utility of the SAECG, more recent studies97 demonstrate that the SAECG could not predict inducibility of sustained VT in this population. Interestingly, the SAECG was an independent predictor of mortality and sudden cardiac death in subpopulations of MUSTT patients (unpublished observations). Obviously, the exact role of the SAECG, as well as other noninvasive risk stratifiers, needs to be determined. Current guidelines for use of the SAECG have been published in a consensus document of the American College of Cardiology.101
the SAECG in predicting inducible sustained VT in patients with prior infarction and nonsustained VT and ejection fractions less than 40% has recently been evaluated in the Multicenter Unstained Tachycardia Trial (MUSTT). Despite earlier, nonrandomized studies that suggested utility of the SAECG, more recent studies97 demonstrate that the SAECG could not predict inducibility of sustained VT in this population. Interestingly, the SAECG was an independent predictor of mortality and sudden cardiac death in subpopulations of MUSTT patients (unpublished observations). Obviously, the exact role of the SAECG, as well as other noninvasive risk stratifiers, needs to be determined. Current guidelines for use of the SAECG have been published in a consensus document of the American College of Cardiology.101
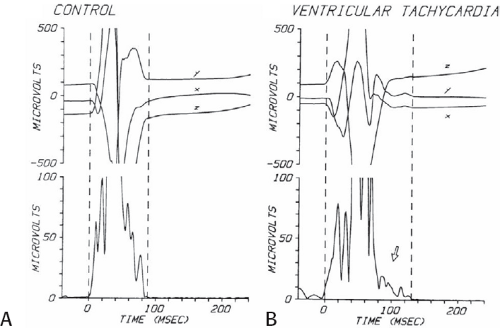 FIGURE 11-33 Signal-averaged ECGs in patients with inferior infarction with and without VT. A: Control, a signal-averaged ECG is shown. The highly gained XYZ recordings are filtered above 40 Hz. Note the symmetric configuration of the filtered complex, which is 100 msec in duration. The mean voltage of the last 40 msec of the filtered QRS was 45 μV (normal >20 μV). B: A signal-averaged ECG from a patient with inferior infarction and VT. Note that the QRS duration is markedly prolonged to 117 msec and the terminal part of the filtered QRS shows a low-amplitude late potential (arrow). The mean amplitude of the last 40 msec was 10 μV. (From Simson MB. Use of signals in the terminal QRS complex to identify patients with ventricular tachycardia after myocardial infarction. Circulation 1981;64:235.) |
The natural history of development of these conduction abnormalities in coronary artery disease is uncertain, although they appear to develop gradually, 3 days to 2 weeks following infarction.87,90,91,102 Once present, these late potentials do not disappear. This seems to support the observations of Roy et al.26 that uniform VT induced 2 weeks after infarction can be reliably reproduced a year later. This was recently reproduced in an ovine model of infarction in which inducible VT in the first 2 weeks was reproduced at 100 days.27 These findings form the basis for the use of programmed stimulation to determine the risk of sudden cardiac arrest postmyocardial infarction.
In patients with nonischemic dilated cardiomyopathy and VT, in whom endocardial activation is generally normal, the SAECG is often abnormal.102 In patients who present with sustained VT or VF, the SAECG is both longer in duration and has a lower amplitude in the terminal (40 msec) than in comparable patients with cardiomyopathy and no malignant arrhythmia.103 Although prolongation of duration seen in these patients may be a reflection of the abnormal QRS on the surface ECG, in the group of patients with sustained VT or fibrillation, 83% had a late potential, regardless of QRS duration. These data suggest that the substrate of slow conduction in patients with cardiomyopathy resides in the midmyocardium or epicardium. Data using epicardial mapping in Chagas disease support this hypothesis.75 Although an early study by Middlekauff et al.104 failed to demonstrate any utility of the SAECG in these patients, Mancini et al.105 found a high correlation of positive SAECG with mortality and fibrosis. Further evaluation of signal averaging is necessary to establish whether it can provide a noninvasive method to recognize an arrhythmogenic substrate in patients with nonischemic dilated LV
cardiomyopathy. Patients with ARVD and sustained VT have the most abnormal SAECG; the late potentials being correlated to the epsilon waves on the surface ECG (Fig. 11-35).
cardiomyopathy. Patients with ARVD and sustained VT have the most abnormal SAECG; the late potentials being correlated to the epsilon waves on the surface ECG (Fig. 11-35).
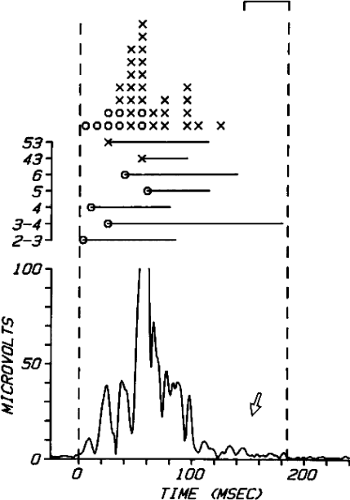 FIGURE 11-34 Relationship between late potential and endocardial and epicardial recordings in a patient with VT. The filtered signal-averaged QRS is shown on the bottom and mapping sites on top. Sites 2–3, 3–4, 4, 5, and 6 are endocardial sites. Sites 43 and 53 are epicardial sites The bar represents duration of the electrogram. Other epicardial sites are shown as Xs, and endocardial sites are shown as Os. Note that the low-amplitude late potential (arrow) is associated with late endocardial activity from four sites and late epicardial activity from one site. See text for discussion. (From Simson MB, Untereker WJ, Spielman SR, et al. Relation between late potentials on the body surface and directly recorded fragmented electrograms in patients with ventricular tachycardia. Am J Cardiol 1983;51:105.) |
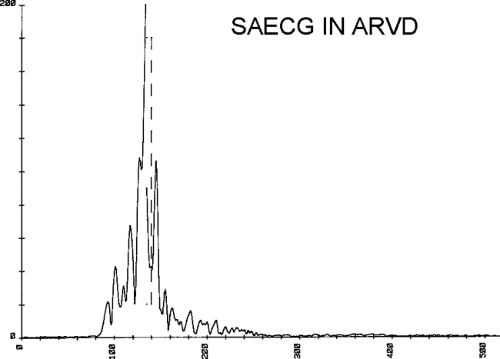 FIGURE 11-35 Signal-averaged ECG in a patient with ARVD and VT. The SAECG is markedly abnormal with a late potential extended to 260 msec, with a duration of 110 msec. |
Differences in excitability, refractoriness, and dispersion of refractoriness are other potential arrhythmogenic abnormalities. We evaluated the effects of infarction on the threshold of excitability, refractoriness, and strength-interval curves.106 These studies demonstrated that sites of infarction characterized by abnormal electrograms have higher thresholds than normal sites in patients with infarction (1.9 ± 1 vs. 0.7 ± 0.4 mA, p < 0.05) (Fig. 11-36). This higher threshold corresponds to a strength-interval curve that has shifted upward, particularly during late coupling intervals (Fig 11-37). Refractory periods determined at threshold were longer at sites of infarction, but the steep part of the strength-interval curves were not significantly different (Fig 11-38). Furthermore, the effect of change in cycle length of the refractory period measured as the steep part of the strength-interval curve was similar in normal sites and sites of infarction (39 ± 9 vs. 32 ± 8 msec, p = NS). The current at which the steep part of the strength-interval curve was achieved was also comparable.
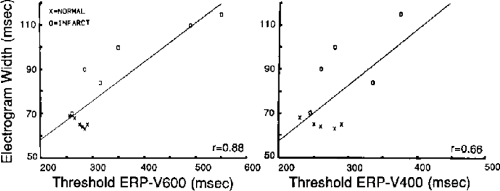 FIGURE 11-36 Relation between local electrogram width and measured threshold effective refractory period (ERP). The local electrogram width during sinus rhythm is plotted against the ERP measured at threshold stimulus strength during ventricular pacing cycle length of 600 and 400 msec. The X denotes measurements from a normal site and O from an infarcted site from the infarct patient group. (From Kienzle MG, Doherty JU, Cassidy D, et al. Electrophysiologic sequelae of chronic myocardial infarction: local refractoriness and electrographic characteristics of the left ventricle. Am J Cardiol 1986;58:63.) |
Because abnormalities of excitability and refractoriness are encountered in infarcted sites having abnormal electrograms, we evaluated whether dispersion of refractoriness, dispersion of activation, dispersion of total recovery (LAT plus local refractory periods) for the entire ventricle or for adjacent sites were arrhythmogenic.107 Definitions are given in Table 11-5. We compared these parameters in patients with no arrhythmias and normal hearts, patients with long QT interval syndromes and recurrent VF, and patients with coronary artery disease status postmyocardial infarction who presented with sustained ventricular tachyarrhythmias. Examples of patients from each group are shown in Figures 11-39 to 11-41. These data, which are summarized in Tables 11-6 and 11-7, demonstrated that patients with long QT interval syndromes have a normal dispersion of activation and a significant dispersion of refractoriness and total recovery time, whereas patients with coronary artery disease and ventricular arrhythmias have normal dispersion of refractoriness but marked abnormalities of ventricular activation, which produce the consequent dispersion of total recovery. This was true whether or not the parameters were evaluated for the entire left ventricle or at adjacent sites. In view of the fact that in patients with sustained VT due to coronary artery disease arrhythmias can be reproducibly initiated by programmed stimulation and that in those with long QT syndromes arrhythmias are not inducible (see subsequent paragraphs on initiation of ventricular tachyarrhythmias), one must conclude that abnormalities of conduction
provide a more important reflection of inducible arrhythmias (which we assume to be a marker for reentry) than dispersion of refractoriness alone. Thus, one must consider abnormalities of conduction to be of primary importance in the genesis of sustained uniform ventricular arrhythmias. The greater these abnormalities, the more likely uniform tachycardias occur spontaneously or can be induced. Invasive or noninvasive methods to demonstrate abnormalities of conduction are, therefore, useful markers of an arrhythmogenic substrate. Patients with VF or nonsustained VT appear to have fewer conduction abnormalities (i.e., less slow conduction), and hence, their tachycardias remain either nonsustained or degenerate to VF. The relationship of these arrhythmias to sustained VT is discussed subsequently.
provide a more important reflection of inducible arrhythmias (which we assume to be a marker for reentry) than dispersion of refractoriness alone. Thus, one must consider abnormalities of conduction to be of primary importance in the genesis of sustained uniform ventricular arrhythmias. The greater these abnormalities, the more likely uniform tachycardias occur spontaneously or can be induced. Invasive or noninvasive methods to demonstrate abnormalities of conduction are, therefore, useful markers of an arrhythmogenic substrate. Patients with VF or nonsustained VT appear to have fewer conduction abnormalities (i.e., less slow conduction), and hence, their tachycardias remain either nonsustained or degenerate to VF. The relationship of these arrhythmias to sustained VT is discussed subsequently.
 FIGURE 11-37 Locally recorded electrograms and strength-interval curves from an infarct and noninfarct site in the same patient. Electrophysiologic leads 1, aVF, and V1 are displayed with a right ventricular reference and left ventricular electrograms (RV and LV). Ten-msec time lines are shown below. The strength-interval curves measured at each site are also shown with the measured refractory period plotted from threshold to 10 mA. Alterations characteristic of chronic infarction are seen in both the local electrogram and strength-interval curve. (From Kienzle MG, Doherty JU, Cassidy D, et al. Electrophysiologic sequelae of chronic myocardial infarction: local refractoriness and electrographic characteristics of the left ventricle. Am J Cardiol 1986;58:63.) |
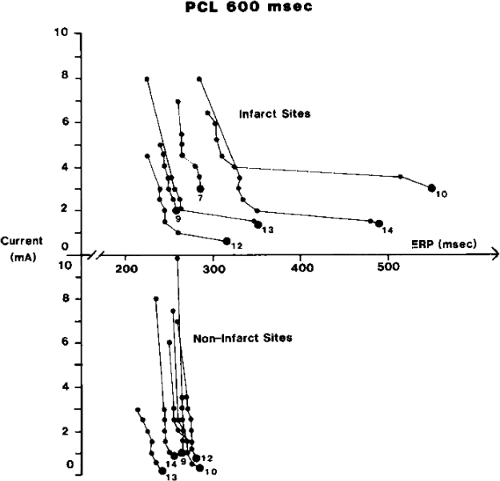 FIGURE 11-38 Individual strength-interval curves from infarct and noninfarct sites from patients with previous myocardial infarction. Each curve consists of the ERP at threshold (large filled circles) and at each of the next five increments of current strength (small filled circles). The last point of each curve corresponds to the stimulus strength at which no further shortening of ERP occurred (first point of the steep portion of the strength-interval curve). The curved numbers refer to individual patients. PCL, pacing cycle length. (From Kienzle MG, Doherty JU, Cassidy D, et al. Electrophysiologic sequelae of chronic myocardial infarction: local refractoriness and electrographic characteristics of the left ventricle. Am J Cardiol 1986;58:63.) |
Table 11-5 Definitions | |||||||
|---|---|---|---|---|---|---|---|
|
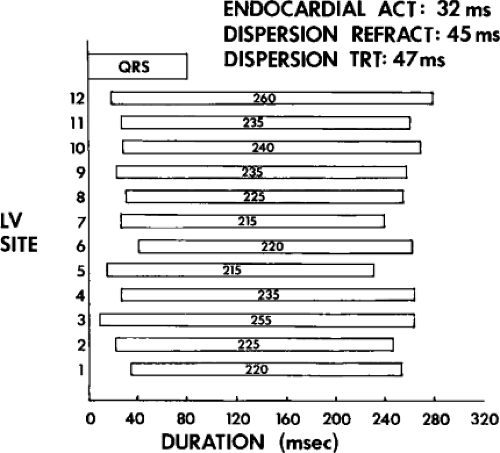 FIGURE 11-39 Dispersion of activation and recovery in a normal patient. On the horizontal axis is time duration and on the vertical axis are the mapped left ventricular sites. The QRS displayed on top begins at 0 time and extends to approximately 80 msec. The left-hand edge of each bar represents the local activation time at the individual site, and the duration of the bar represents the local ERP (value in bar). The right-hand edge of each bar represents the end of total recovery time (the sum of activation time and local refractoriness). In this patient, one sees early breakthrough sites at 3, 5, and 12. Endocardial activation (ACT) time from the earliest onset (site 3) to the latest (site 6) is 32 msec. The dispersion refractoriness (difference between shortest and longest) is 45 msec, and dispersion of total recovery time (TRT) (the maximum difference between the right-hand edge of the rectangles) is 41 msec. These are all normal values. See text for discussion. (From Vassallo JA, Cassidy DM, Kindwall KE, et al. Nonuniform recovery of excitability in the left ventricle. Circulation 1988;78:1365.) |
Mechanisms of Ventricular Tachycardia
The mechanisms of VT have been under active investigation both experimentally and clinically in the past three decades. Potential mechanisms of VTs include reentry, normal and abnormal automaticity, and triggered activity that is due to early or delayed afterdepolarizations. Most of the recent knowledge of cellular mechanisms of arrhythmias are derived from isolated atrial, Purkinje, ventricular muscle fibers, and
segments of myocardium exposed to a variety of conditions. More recently molecular genetics has provided information relevant to the mechanisms of certain arrhythmias. Heterogeneity of local APD based on ion channel derangements are probably responsible for arrhythmias associated with the long QT syndromes and Brugada syndrome (idiopathic VF associated with ST elevation in V1–3 and pseudo-RBBB), short QT syndrome, and catecholaminergic PMVT.108,109,110,111,112,113,114,115,116,117,118,119 Such heterogeneity can lead to triggered or reentrant arrhythmias. Connexin dysfunction can also produce heterogeneity of APD but can lead to reentry due to their effect on conduction. The exact mechanism by which these ion channelopathies cause arrhythmias is unresolved and is under active investigation. Debate therefore continues as to the role of early afterdepolarizations, abnormal automaticity, and reentry in these polymorphic tachycardias that are the hallmark of these syndromes. This is particularly true in the Brugada syndrome in which controversy remains as to whether it is a problem of conduction or repolarization.120,121
segments of myocardium exposed to a variety of conditions. More recently molecular genetics has provided information relevant to the mechanisms of certain arrhythmias. Heterogeneity of local APD based on ion channel derangements are probably responsible for arrhythmias associated with the long QT syndromes and Brugada syndrome (idiopathic VF associated with ST elevation in V1–3 and pseudo-RBBB), short QT syndrome, and catecholaminergic PMVT.108,109,110,111,112,113,114,115,116,117,118,119 Such heterogeneity can lead to triggered or reentrant arrhythmias. Connexin dysfunction can also produce heterogeneity of APD but can lead to reentry due to their effect on conduction. The exact mechanism by which these ion channelopathies cause arrhythmias is unresolved and is under active investigation. Debate therefore continues as to the role of early afterdepolarizations, abnormal automaticity, and reentry in these polymorphic tachycardias that are the hallmark of these syndromes. This is particularly true in the Brugada syndrome in which controversy remains as to whether it is a problem of conduction or repolarization.120,121
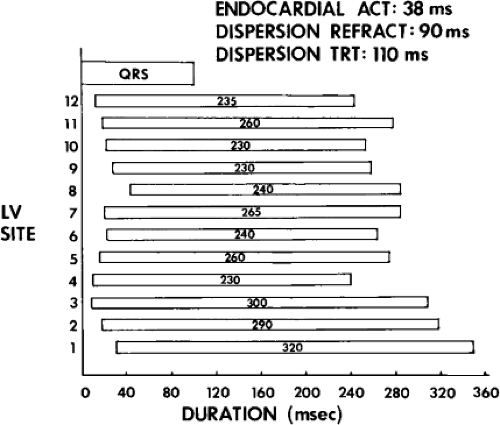 FIGURE 11-40 Dispersion of activation and recovery in a patient with long QT syndrome. This figure is arranged as Figure 11-39. In this instance, endocardial activation takes 38 msec, which is normal. However, dispersion of refractoriness is 90 msec (the longest refractory period being 320 msec at site 1). This results in a markedly abnormal dispersion TRT. See text for discussion. (From Vassallo JA, Cassidy DM, Kindwall KE, et al. Nonuniform recovery of excitability in the left ventricle. Circulation 1988;78:1365.) |
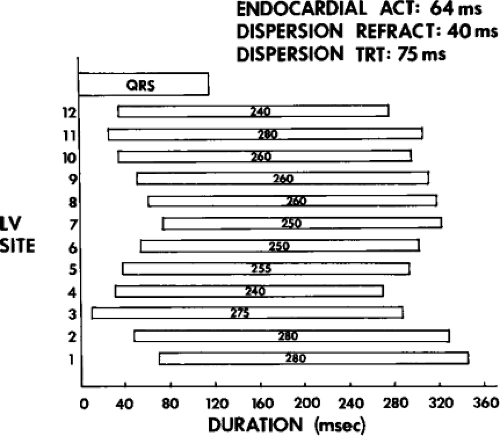 FIGURE 11-41 Dispersion of activation and recovery in a patient with prior CAD and VT. This tracing is arranged as Figures 11-39 and 11-40. In this patient with VT and CAD, there is marked dispersion of endocardial activation, which requires 64 msec to complete. Dispersion of refractoriness is normal at 40 msec. Because of the irregular and prolonged activation times, there is prolongation of total dispersion of recovery of 15 msec. See text for discussion. (From Vassallo JA, Cassidy DM, Kindwall KE, et al. Nonuniform recovery of excitability in the left ventricle. Circulation 1988;78:1365.) |
Table 11-6 Data Based on Whole Left Ventricle Analysis | ||||||||||||||||||||||||
|---|---|---|---|---|---|---|---|---|---|---|---|---|---|---|---|---|---|---|---|---|---|---|---|---|
| ||||||||||||||||||||||||
Despite the differences in experimental design, in my opinion, generalizations regarding arrhythmia mechanisms can be made by comparing the mode of initiation of tachycardias and influence of stimulation during tachycardias in in vitro and in vivo experimental preparations to comparable situations in humans. In addition, activation mapping in humans and the effects of drugs on initiation and VT cycle length may provide important clues to the underlying mechanism. These phenomena can only be evaluated in induced, sustained uniform VT. The bulk of evidence derived from these studies, albeit indirect, suggests that reentry is the mechanism of sustained uniform tachycardias associated with coronary artery disease.1,122,123 In addition, nonsustained VT and VT (particularly, uniform) producing cardiac arrest may have a similar mechanism because they have a qualitatively similar, although quantitatively less, substrate of abnormal conduction. Moreover, their response to programmed stimulation and pharmacologic agents suggests a common mechanism. As discussed later, the evidence supporting reentry is based on
the ability to reproducibly initiate and terminate the tachycardia by programmed stimulation, the response of the tachycardia to stimulation, the effect of drugs on the tachycardia, and activation mapping demonstrating reentrant excitation. How these responses differ from those expected for other mechanisms is discussed in more detail subsequently.
the ability to reproducibly initiate and terminate the tachycardia by programmed stimulation, the response of the tachycardia to stimulation, the effect of drugs on the tachycardia, and activation mapping demonstrating reentrant excitation. How these responses differ from those expected for other mechanisms is discussed in more detail subsequently.
Table 11-7 Data Based on Adjacent Left Ventricle Sites | ||||||||||||||||||||||||||||
|---|---|---|---|---|---|---|---|---|---|---|---|---|---|---|---|---|---|---|---|---|---|---|---|---|---|---|---|---|
| ||||||||||||||||||||||||||||
The underlying mechanism for VF and for the entire spectrum of nonsustained and polymorphic ventricular arrhythmias in patients with cardiomyopathy, electrolyte imbalance, valvular disorders, and so on remains incompletely understood. However, in the vast majority of cases the mechanism of sustained uniform VT, regardless of underlying cardiac disorder, appears most consistent with reentry (including patients with congenital heart disease, cardiomyopathy, and those with no organic heart disease), based on similar observations as those noted for uniform VT observed in the setting of coronary artery disease. While infarction provides gross fibrosis and macro nonuniform anisotropy, abnormal propagation in cardiomyopathies with less fibrosis may be related to the abnormalities of gap junction number, structure, function, and location.
Initiation of Ventricular Tachycardias
The ability to reproducibly initiate an arrhythmia by programmed electrical stimulation (PES) has been considered a hallmark of reentrant arrhythmia.1,124 Arrhythmias that are due to automaticity, either normal or abnormal, are due to spontaneous depolarization and cannot usually be initiated by programmed stimulation.125,126,127 Triggered activity that is due to DADs, under a number of different circumstances, can be initiated by programmed stimulation.51,125,126,127,128 The modes of stimulation required to initiate triggered activity caused by DADs and the characteristics of the resultant rhythm as well as the influence of pharmacologic agents (e.g., isoproterenol, atropine, aminophylline, and procainamide) on initiation can be used to differentiate triggered activity from reentrant excitation. Tachyarrhythmias that are believed to be due to early afterdepolarization are bradycardia dependent, and although they can be initiated in the experimental laboratory, they are not well suited for study by programmed stimulation, which automatically necessitates a relative “tachycardic” state.125,126,129,130 The so-called short-long-short sequence of early afterdepolarization initiation of triggered activity recently summarized by Cranefield and Aronson130 suggests that unusual modes of stimulation, which have not heretofore been employed, may be useful in initiating such rhythms. However, this protocol of stimulation can easily facilitate reentrant excitation. As such I do not believe this mode of stimulation can distinguish triggered activity from reentrant rhythms.
Protocol of Programmed Stimulation
One of the major limitations in evaluating reported results of programmed stimulation to initiate VT is that different protocols have been used in different laboratories. Another limitation is that the reported results of stimulation have included patients with sustained uniform VT, nonsustained VT, and those presenting with cardiac arrest, treated as a single group. Some even report the results in patients who have never had a sustained arrhythmia, but who might be at risk for its occurrence. As mentioned earlier in this chapter, the anatomic and electrophysiologic substrates of these arrhythmias differ.22,23,32,89,95 It is not surprising that the response to programmed stimulation also differs. Therefore, sensitivity and specificity should only be applied to the use of programmed stimulation for a single arrhythmia type. The only arrhythmia for which such data exist is sustained monomorphic VT.
In addition to the type of arrhythmia and the underlying anatomic substrate, specific features of the methodology of programmed stimulation can influence the ability to initiate the tachycardia. These include the number of extrastimuli, paced cycle length (PCL), site of stimulation, and the current (or voltage and pulse width), and the reproducibility of the response. These parameters are methods used to overcome some general factors that may influence the ability to initiate VT. They include distance from the origin of the arrhythmia, refractoriness at the site of stimulation, and conduction to the potential site of the tachycardia circuit or focus. The lack of control of those variables related to the protocol of programmed stimulation as well as the inclusion of different arrhythmia subtypes and different disease states have led to a marked variability in reported sensitivity, specificity, and reproducibility of programmed stimulation in the study of VT.131,132,133,134,135,136 This has led to confusion in interpreting results of programmed stimulation and misuse of this technique in the management of arrhythmias. Thus, although some generalities exist regarding the effects of increasing number of extrastimuli, altering drive cycle lengths, and increasing current, the investigator must interpret the response to programmed stimulation in light of the specific arrhythmia being evaluated or whether stimulation is being used for risk stratification postmyocardial infarction.
Number of Extrastimuli
The appropriate number of extrastimuli used to evaluate programmed stimulation for sustained VT is not universally agreed upon. In general, the greater the number of extrastimuli employed, the increased sensitivity of induction of any arrhythmia; however, this is associated with a decreasing specificity of the technique (Fig. 11-42). The sensitivity of PES to initiate sustained uniform VT increases significantly with the addition of three VES, with little incremental benefit from the addition of a fourth extrastimulus or rapid pacing (Fig. 11-43). Hummel et al.137 suggest that if one begins PES with four VES at a short drive– PCL, one can reach an endpoint of inducible monomorphic VT sooner than if one starts with single VES. However, whether or not the VT induced by Hummel’s method is the same as the spontaneous VT was never clarified in their manuscript. The more aggressively one stimulates, the more likely a nonspecific response, usually a polymorphic VT
or VF, can result.1,38,133,138,139,140,141,142 In general, the induction of VF or very rapid VT requires more VES, delivered at shorter coupling intervals than induction of sustained monomorphic VT. Moreover, the more abnormal the SAECG, the longer the coupling intervals of VES necessary to initiate either VT or VF.142
or VF, can result.1,38,133,138,139,140,141,142 In general, the induction of VF or very rapid VT requires more VES, delivered at shorter coupling intervals than induction of sustained monomorphic VT. Moreover, the more abnormal the SAECG, the longer the coupling intervals of VES necessary to initiate either VT or VF.142
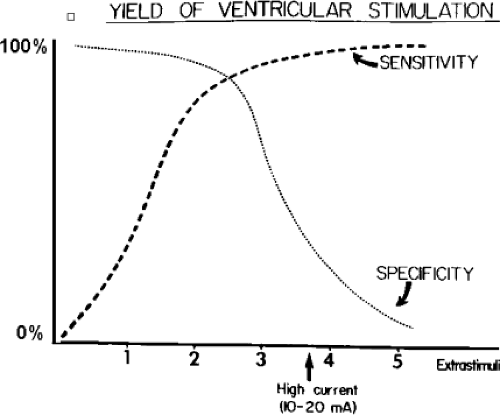 FIGURE 11-42 Effect of aggressiveness of stimulation with sensitivity and specificity of responses. The various modes of initiation are shown on the horizontal axis from least to most aggressive, and the percentage of inducibility rate is shown on the vertical axis. It can be seen that the more aggressive the stimulation, the higher the sensitivity but the lower the specificity. A protocol involving three extrastimuli at twice diastolic threshold gives the best balance of sensitivity and specificity. |
When sustained monomorphic VT is studied, the induction of polymorphic tachycardia must be considered a nonspecific response. Both nonsustained and sustained polymorphic arrhythmias, including VF, can be induced even in normal subjects without a history of VT or cardiac arrest. In our experience, the induction of polymorphic VT and/or VF in normal individuals usually requires multiple extrastimuli delivered at short coupling intervals, usually ≤180 msec (Fig. 11-44). Importantly, the initiating stimulus is associated with marked latency, compatible with local conduction delay at the stimulus site. In these people, these responses have no clinical significance. Thus, in patients without a prior history of sustained ventricular arrhythmias, we try to avoid using coupling intervals <180 msec.
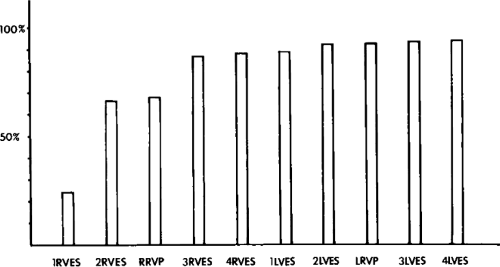 FIGURE 11-43 Effect of number of extrastimuli and site of stimulation on inducibility. Increasing aggressiveness of right (RVES) then left ventricular stimulation (LVES) is shown on the horizontal axis, and the percentage of inducibility is shown on the left. It is clear that using three right ventricular extrastimuli there is approximately a 90% sensitivity. More aggressive modes of stimulation from the right or left ventricle add little to improve the sensitivity. |
The induction of polymorphic VT and/or VF in a patient who presents with cardiac arrest may have a different implication. By Baysean analysis, this response is more likely to have clinical significance in a patient population in whom similar arrhythmias are present. In other words, because a cardiac arrest may be initiated by a polymorphic tachycardia, the induction of a polymorphic VT in this patient population may be significant (although this is unproven). Despite this, one should always be circumspect when interpreting a polymorphic tachycardia as a clinically significant arrhythmia because, as noted previously, comparable arrhythmias can be induced in patients without any history of arrhythmia.
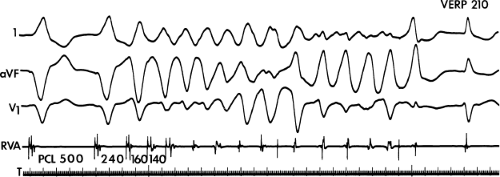 FIGURE 11-44 Induction of nonsustained polymorphic VT. Nonsustained polymorphic VT is induced by triple extrastimuli delivered at extremely short coupling intervals. The last two coupling intervals are 160 and 140 msec, respectively, and are associated with local conduction delay (i.e., latency). Such responses have no clinical significance. See text for discussion. VERP, ventricular effective refractory period. |
In contrast, the induction of a hemodynamically tolerated sustained monomorphic tachycardia (particularly with a cycle length ≥240 msec) only occurs in patients with spontaneous VT, cardiac arrest, or in the presence of a substrate known to be arrhythmogenic, such as a left ventricular aneurysm or recent myocardial infarction. It should be noted that the clinical significance of the induction of any arrhythmia,
whether sustained uniform tachycardia or polymorphic tachycardias, in the setting of acute reperfusion or a recent infarction (<2 weeks) remains controversial.25,26 Nonetheless programmed stimulation early after infarction has been useful as a risk stratifier for sudden cardiac arrest.28,143,144,145,146,147 In other situations, induction of monomorphic VT is accepted as indicating that spontaneous occurrence or recurrence is likely and has been used as an indication for device implantation (MUSTT, new Guidelines).
whether sustained uniform tachycardia or polymorphic tachycardias, in the setting of acute reperfusion or a recent infarction (<2 weeks) remains controversial.25,26 Nonetheless programmed stimulation early after infarction has been useful as a risk stratifier for sudden cardiac arrest.28,143,144,145,146,147 In other situations, induction of monomorphic VT is accepted as indicating that spontaneous occurrence or recurrence is likely and has been used as an indication for device implantation (MUSTT, new Guidelines).
In my opinion, the use of three extrastimuli seems optimal for sensitivity and specificity, for the induction of a clinically seen monomorphic VT due to prior infarction, with the recognition that in occasional patients a sustained monomorphic tachycardia requires four or more extrastimuli for its induction. In such a patient, the risk of additional extrastimuli producing nonspecific arrhythmias versus the benefit of being able to induce and, hence, develop therapy for a clinically relevant monomorphic VT should be considered. This is a reason for using multiple stimulation sites and drive cycle lengths (see below). When cardiac arrest is the presenting syndrome, we would not deliver more than three extrastimuli, because the additional extrastimuli would be more likely to induce polymorphic tachycardias than a uniform one (10:1), which if acted on would lead to the treatment of “nonspecific responses” in some individuals.
It is important that the induced arrhythmia be comparable to the spontaneous arrhythmia to ensure specificity of programmed stimulation. Although this is easily accomplished in the case of sustained monomorphic VT in which documentation of the spontaneous VT by a 12-lead ECG is possible (Fig. 11-45), it is nearly impossible in patients presenting with nonsustained VT or cardiac arrest in whom electrocardiographic documentation of the spontaneous arrhythmia is not available. Moreover, multiple morphologically distinct uniform sustained VT can be induced from the same or different sites (Fig. 11-46). These VT can often be changed back and forth by stimulation during VT (Fig. 11-46), which is particularly common in patients treated with antiarrhythmic agents or early after myocardial infarction. In patients who present with recurrent sustained VT, these tachycardias are relevant. We found that these “additional” uniform VT are commonly responsible for recurrences.148 In addition to antiarrhythmic drugs, aneurysms are another “risk” factor for spontaneous or inducible multiple VT morphologies. In summary, although the optimal stimulation protocol to ensure maximum sensitivity and specificity for inducing a clinically seen monomorphic VT is not defined, we believe that the number of extrastimuli generally employed should be three. This is based on studies from our laboratory and others1,42,122,140,141,149 that demonstrate that three VES are required to induce sustained monomorphic VT in 20% to 40% of patients presenting with sustained monomorphic VT and in 40% to 60% of patients presenting with cardiac arrest (Fig. 11-47).
It is important that repetition of “critical” coupling intervals or the entire protocol is employed in order to define a true negative study.
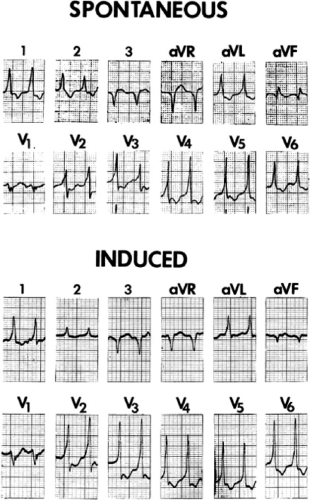 FIGURE 11-45 Comparison of induced and spontaneous sustained VT. Top: Spontaneous left bundle branch block tachycardia with left inferior axis is shown. Bottom: The induced VT has a nearly identical morphology and cycle length to the spontaneous VT. |
Influence of Drive Cycle Length
Multiple investigators have evaluated whether changing the drive cycle length influences inducibility of VT.1,42,122,137,149,150,151,152,153,154,155 Most studies demonstrate that the use of at least two cycle lengths (typically 600 and 400 msec) is required to enhance the sensitivity of induction of sustained uniform VT in patients presenting with that rhythm or sustained VT of any morphology in those presenting with cardiac arrest. Extrastimuli delivered at shorter or longer cycle lengths, or even sinus rhythm, may be necessary to initiate VT in individual patients. Hummel et al.137 suggest that if one starts with a PCL of 350 msec, inducibility is achieved more quickly, but whether the induced VT is the same as the spontaneous VT or the protocol was completed was never addressed. Abrupt changes in cycle lengths also may facilitate tachycardia induction.151 In approximately 5% of patients with sustained monomorphic VT (or, less commonly in those presenting with cardiac arrest), VT can be initiated only during sinus rhythm. In 10% to 15%, induction can be accomplished either during sinus rhythm or ventricular pacing.
Thus, most VT that can be induced during sinus rhythm can also be induced during ventricular pacing (Fig. 11-48). In such instances the coupling intervals required to initiate VT tend to be longer during ventricular pacing, but this is unpredictable in individual patients. In the remaining 80% to 85%, extrastimuli delivered during ventricular pacing successfully initiate VT. It is difficult to evaluate whether multiple drive cycle lengths or additional extrastimuli are more important to increasing the sensitivity of induction of VT.152,153 Both tend to shorten the prematurity with which VES can be delivered.151,152 The baseline right ventricular effective refractory period does not distinguish between VT requiring single, double, or triple extrastimuli for induction in patients presenting with sustained uniform VT or those with cardiac arrest (Table 11-8).42
Thus, most VT that can be induced during sinus rhythm can also be induced during ventricular pacing (Fig. 11-48). In such instances the coupling intervals required to initiate VT tend to be longer during ventricular pacing, but this is unpredictable in individual patients. In the remaining 80% to 85%, extrastimuli delivered during ventricular pacing successfully initiate VT. It is difficult to evaluate whether multiple drive cycle lengths or additional extrastimuli are more important to increasing the sensitivity of induction of VT.152,153 Both tend to shorten the prematurity with which VES can be delivered.151,152 The baseline right ventricular effective refractory period does not distinguish between VT requiring single, double, or triple extrastimuli for induction in patients presenting with sustained uniform VT or those with cardiac arrest (Table 11-8).42
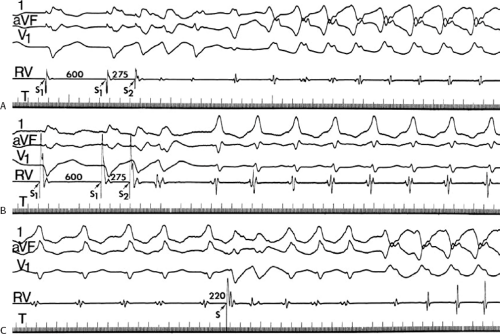 FIGURE 11-46 Induction of multiple morphologically distinct tachycardias. A–C: The surface leads 1, aVF, and V1 are shown with an RV electrogram. A: During a basic drive cycle length of 600 msec, a single RV extrastimulus induces a VT with right bundle branch block configuration. B: A single extrastimulus at the same coupling interval induces a left bundle branch block tachycardia. C: The left bundle branch block tachycardia is changed to the right bundle branch block tachycardia following the introduction of a single RV extrastimulus. See text for discussion. |
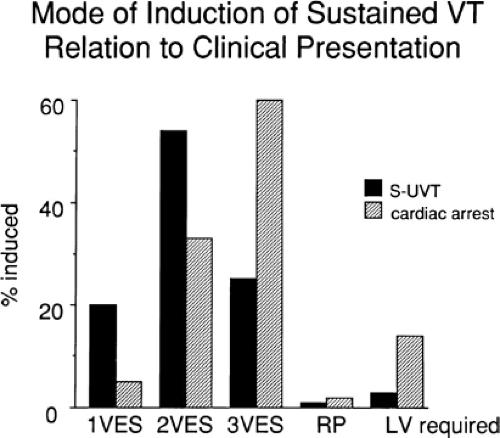 FIGURE 11-47 Relationship of mode of induction of sustained VT to clinical presentation. The mode of induction of VT (horizontal axis) is compared to the percentage induced (vertical axis) in patients with sustained uniform VT (S-UVT) and those presenting with cardiac arrest. Patients with cardiac arrest more frequently require triple extrastimuli and left ventricular stimulation than those presenting with sustained uniform VT. See text for discussion. RP, refractory period; VES, ventricular extrastimuli. |
The cycle length used can influence the number of extrastimuli required for induction. Theoretically, if one knew the drive cycle length that allows for induction of sustained VT with the least number of extrastimuli, one would use that cycle length, because the incidence of induction of nonspecific arrhythmias would be lower. Unfortunately, one cannot predict which cycle length will facilitate induction of the clinically relevant tachycardia. A standard protocol should include the use of at least two cycle lengths. In our laboratory, we routinely use drive cycle lengths of 600 and 400 msec in all patients as well
as stimulation during sinus rhythm. Additional cycle lengths may be employed if stimulation at these drive cycle lengths fails to initiate tachycardia. The relative success of different cycle lengths on the induction of sustained VT in patients presenting with uniform sustained VT or cardiac arrest is shown in Table 11-9. As noted above, Hummel et al.137 suggest that initiating programmed stimulation using four VES delivered at a PCL of 350 msec gives maximum sensitivity. However, this “sensitivity” is just for initiation of any sustained VT, not necessarily the spontaneous VT or other VTs that may be
observed if a complete protocol were performed. Knowledge of all such monomorphic VTs is critical in developing pharmacologic, pacing, implantable defibrillator, or ablative therapy.
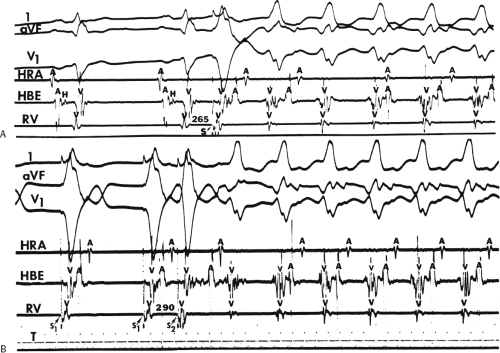 FIGURE 11-48 Induction of VT by extrastimuli delivered during sinus rhythm and ventricular pacing. A and B: Three surface ECG leads and electrograms from the HRA, HBE, and RV are shown. A: During sinus rhythm, a single VES initiates a left bundle branch block–type tachycardia. B: During ventricular pacing, a single extrastimulus delivered at a longer coupling interval induces the same tachycardia. See text for discussion. |
Table 11-8 Relationship of Induction Mode to RVERPa | ||||||||||||||||||||||||
|---|---|---|---|---|---|---|---|---|---|---|---|---|---|---|---|---|---|---|---|---|---|---|---|---|
| ||||||||||||||||||||||||
Table 11-9 Drive Cycle Lengths of Programmed Stimulation Required for VT Induction | ||||||||||||||||||||||||
|---|---|---|---|---|---|---|---|---|---|---|---|---|---|---|---|---|---|---|---|---|---|---|---|---|
| ||||||||||||||||||||||||
Multiple Sites of Stimulation
Studies have demonstrated that using at least two sites of stimulation enhances the ability to initiate tachycardias.1,42,140,156 In our experience, stimulation from a second site (i.e., other than the right ventricular apex) is needed to initiate sustained VT in patients presenting with sustained uniform VT and, even more importantly, in those with cardiac arrest. If three extrastimuli are delivered only from the right ventricular apex, 10% to 20% of patients will require the use of a second right ventricular or left ventricular site for initiation of sustained (Fig. 11-49). In a study by Doherty et al.,156 in 58% of patients in whom triple extrastimuli at two cycle lengths failed to initiate a tachycardia from the right ventricular apex, a uniform sustained VT was induced from the right ventricular outflow tract. This accounted for 22% of the total inducible sustained VT. In approximately 60% of patients, the same sustained uniform VT was induced from both the right ventricular apex and right ventricular outflow tract (Fig. 11-50). We previously noted that neither drive cycle length nor ventricular refractory periods at either site was the determinant of mode of induction for patients presenting with sustained VT or cardiac arrest (Tables 11-8 and 11-9).42 Thus, the inducibility appears related to the relationship of the wavefront of activation from the site of stimulation and the mechanism at the tachycardia origin. Site specificity for induction would suggest reentry as the underlying mechanism.
Because the number of extrastimuli required to initiate VT may differ depending on site of stimulation, the site that allows use of the lowest number of stimuli is preferred. While nonspecific responses (i.e., polymorphic VT or VF) are often induced with three VES, particularly when delivered at short coupling intervals, only specific responses (e.g., sustained monomorphic VTs) are likely to be induced using fewer stimuli. To determine the influence of stimulation site on the mode of induction and to allow for the safest stimulating protocol to induce the tachycardia (least number of extrastimuli), I recommend alternating stimulation from the right ventricular apex and outflow tract at each specified cycle length and number of extrastimuli. In approximately 20% of patients presenting with sustained uniform VT, a sustained uniform VT will be induced from one site with less stimuli than at another site, thereby preventing the use of a more aggressive stimulation protocol at the other site.140,156 If stimulation from the right ventricular apex and outflow tract fails, despite use of multiple drive cycle lengths and up to three extrastimuli, left ventricular stimulation may be employed. The yield is small (2% to 5%) for patients with sustained VT, but because the response of induced sustained VT is relatively specific, it seems worthwhile to use left ventricular stimulation if right ventricular stimulation fails. If only two right VES are used from multiple sites and multiple cycle lengths, left ventricular stimulation may be required in approximately 10%.157 Induction of sustained uniform VT in patients presenting with cardiac arrest is more likely to require left ventricular stimulation than those presenting with sustained uniform VT (Table 11-10).42 The reason for this latter observation is unclear.
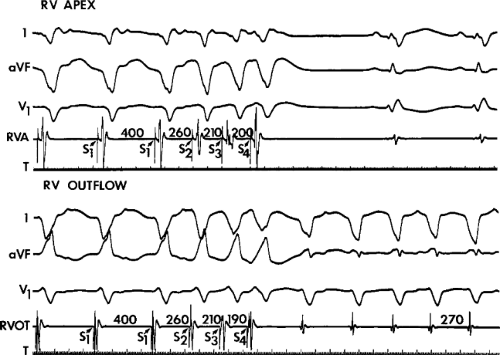 FIGURE 11-49 Requirement of right ventricular outflow tract (RVOT) stimulation to initiate VT. Top: Triple extrastimuli delivered from the RVA at a drive cycle length of 400 msec failed to initiate VT. Bottom: Three extrastimuli from the RVOT at comparable coupling intervals initiate a sustained uniform VT. See text for discussion. |
Role of Increasing Current
Several investigators have evaluated the use of increasing current (5 to 20 mA) in the induction of sustained ventricular
arrhythmias.133,140,141,158 All have found an increased incidence of VF when three or more extrastimuli at increased current are used compared to when twice diastolic threshold current is used. In one study, in 60% of patients who were given four extrastimuli at 10 mA, a nonclinical tachycardia (VF, polymorphic VT, nonsustained VT, or uniform VT of different morphology) was induced. Moreover, only a small increment in sensitivity of initiating a uniform sustained tachycardia occurs with increased current. The increased yield of <5%.158 is far outweighed by the increased incidence of VF; thus, use of currents >5 mA is not recommended for initiation protocols. Even when used, the increased current may either facilitate or inhibit induction of certain tachycardias.158 The mechanism by which increased current seems to facilitate tachycardia is by shortening the measured local refractoriness; however, the mechanism by which induction is prevented is unknown. This may reflect the lower reproducibility of induction of sustained VT when three extrastimuli are used to initiate a tachycardia. On the other hand, increased current could partially depolarize local tissue, causing slow conduction from the stimulation site such that a critical coupling interval at the VT site is not achieved or that local reentry leading to nonclinical VF is induced (Spear). Although no systematic studies of the effect of pulse width on induction have been conducted, we have observed that pulses >2 msec are associated with an increased incidence of polymorphic tachycardias and VF. Therefore, we recommend use of pulse widths between 1 and 2 msec at twice diastolic threshold as the standard.
arrhythmias.133,140,141,158 All have found an increased incidence of VF when three or more extrastimuli at increased current are used compared to when twice diastolic threshold current is used. In one study, in 60% of patients who were given four extrastimuli at 10 mA, a nonclinical tachycardia (VF, polymorphic VT, nonsustained VT, or uniform VT of different morphology) was induced. Moreover, only a small increment in sensitivity of initiating a uniform sustained tachycardia occurs with increased current. The increased yield of <5%.158 is far outweighed by the increased incidence of VF; thus, use of currents >5 mA is not recommended for initiation protocols. Even when used, the increased current may either facilitate or inhibit induction of certain tachycardias.158 The mechanism by which increased current seems to facilitate tachycardia is by shortening the measured local refractoriness; however, the mechanism by which induction is prevented is unknown. This may reflect the lower reproducibility of induction of sustained VT when three extrastimuli are used to initiate a tachycardia. On the other hand, increased current could partially depolarize local tissue, causing slow conduction from the stimulation site such that a critical coupling interval at the VT site is not achieved or that local reentry leading to nonclinical VF is induced (Spear). Although no systematic studies of the effect of pulse width on induction have been conducted, we have observed that pulses >2 msec are associated with an increased incidence of polymorphic tachycardias and VF. Therefore, we recommend use of pulse widths between 1 and 2 msec at twice diastolic threshold as the standard.
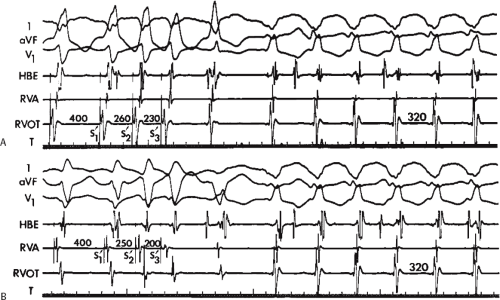 FIGURE 11-50 Initiation of the same VT by stimulation at two right ventricular sites. A: VT with a right bundle right superior axis is initiated by two ventricular extrastimuli delivered from the RVOT. B: The same tachycardia is initiated by stimulation from the RVA. |
Table 11-10 Site of Stimulation Required for Arrhythmia Conduction | |||||||||||||||
|---|---|---|---|---|---|---|---|---|---|---|---|---|---|---|---|
| |||||||||||||||
The stimulation protocol we recommend for the routine study of patients presenting with sustained uniform VT or cardiac arrest is shown in Table 11-11. We use single VES delivered during sinus rhythm and at PCLs of 600 and 400 msec first from the right ventricular apex and then from the right ventricular outflow tract. If this fails to induce an arrhythmia, we deliver two extrastimuli in the same manner. We then use rapid ventricular pacing. Although this has a relatively low yield of VT induction relative to triple extrastimuli,1,42,122,159 it still may induce a uniform tachycardia with a lower incidence of nonspecific responses (i.e., polymorphic VT or VF) than triple extrastimuli. We usually begin rapid pacing at a cycle length of <400 msec and gradually decrease it until 1:1 ventricular capture is lost or a PCL of 200 msec is reached. If this fails to initiate the tachycardia, we employ three VES from both the apex and outflow tract. If these modes of stimulation fail to initiate VT, we repeat the protocol at other basic
cycle lengths. If this fails, we repeat the protocol using other right ventricular or left ventricular sites. In addition, we may use isoproterenol or a Type I agent, such as procainamide, to facilitate induction of the tachycardia. We also perform atrial programmed stimulation and pacing, because occasionally, VT may be induced by these methods or SVT with aberration or pre-excited tachycardias may have been the spontaneous arrhythmia which was misdiagnosed as VT.
cycle lengths. If this fails, we repeat the protocol using other right ventricular or left ventricular sites. In addition, we may use isoproterenol or a Type I agent, such as procainamide, to facilitate induction of the tachycardia. We also perform atrial programmed stimulation and pacing, because occasionally, VT may be induced by these methods or SVT with aberration or pre-excited tachycardias may have been the spontaneous arrhythmia which was misdiagnosed as VT.
Table 11-11 Protocol of Programmed Stimulation for VT | |||||
|---|---|---|---|---|---|
|
Although the use of isoproterenol to facilitate induction of VT has been reported by several investigators,160,161,162 in our experience, it has a low yield in patients with postinfarction sustained uniform VT (<5%). In contrast to our experience, Freedman et al.161 suggest that facilitation of VT induction by isoproterenol may be as high as 20%. Isoproterenol is useful in initiation of exercise-induced tachycardias or repetitive monomorphic tachycardia, which are usually nonsustained, that most often originate from the right ventricular outflow tract and are typically based on triggered activity due to DADs. Occasionally epinephrine, atropine, or aminophylline may work alone or in combination to facilitate induction of these rhythms when isoproterenol fails to spontaneously initiate or facilitate initiation by PES. The most common VT due to triggered activity that is clinically encountered arises at the RV outflow tract, but may occasionally arise in the LV outflow tract as well.163 Tachycardias due to abnormal automaticity may also be initiated by catecholamines alone. Programmed stimulation cannot reproducibly initiate them, even in the presence of catecholamines.
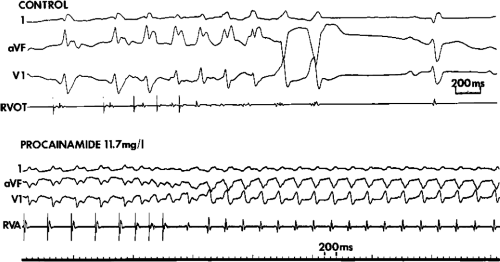 FIGURE 11-51 Facilitation of induction of sustained VT by procainamide. In the control panel, three ventricular extrastimuli fail to initiate a sustained VT. Following the administration of 15 mg/kg of procainamide producing a plasma level of 11.7 mg/L, a sustained uniform VT is induced with three extrastimuli. Note that the morphology of the sustained arrhythmia is identical to the last beats of the nonsustained VT induced in the control. See text for discussion. |
The use of procainamide or other Type I agents to facilitate induction of a tachycardia is not as well recognized. Facilitation of induction of sustained VT is not uncommon in patients with coronary artery disease and prior infarction (with or without angina) in whom no arrhythmia or, more often, a nonsustained tachycardia (uniform or polymorphic) is induced in the baseline state, particularly if the clinical tachycardia, either sustained monomorphic VT or a cardiac arrest, occurred following drug administration (Fig. 11-51). Once monomorphic tachycardia is induced in such patients,
it behaves just as the other reentrant monomorphic tachycardias described later in this chapter. This is one of the observations that link the underlying mechanism of the previously mentioned arrhythmias to that of sustained uniform VT.
it behaves just as the other reentrant monomorphic tachycardias described later in this chapter. This is one of the observations that link the underlying mechanism of the previously mentioned arrhythmias to that of sustained uniform VT.
The response to programmed stimulation that is obviously most difficult to interpret is the induction of polymorphic VT in a patient who has experienced a cardiac arrest. As stated earlier, aggressive stimulation (e.g., triple extrastimuli) can induce similar arrhythmias in patients who have never had a cardiac arrest, or even in people with normal hearts. In such instances, the induction of polymorphic VT is a nonspecific response and lacks relevance. Therefore, we believe that the end point of programmed stimulation should be induction of the clinical arrhythmia or, in this instance, the assumed ventricular arrhythmia. In the case of patients presenting with a cardiac arrest, although doubt will always exist, I believe one must treat the reproducible induction of a polymorphic arrhythmia as a possible indicator of the clinical arrhythmia. It cannot, however, in and of itself help one to understand the mechanism of cardiac arrest, although some investigators have used the induction of polymorphic VT to guide therapy (see Chapter 12). Features that suggest a polymorphic VT may be mechanistically meaningful are (a) reproducible initiation of the same polymorphic template, particularly from different sites, and (b) the transformation of the polymorphic VT to a monomorphic VT by procainamide.164,165
Initiation of Sustained Uniform Ventricular Tachycardia
To study tachycardia mechanisms, in addition to mere induction of a sustained uniform tachycardia, the characteristics of the resulting rhythm have important implications. These are particularly important in distinguishing between arrhythmias that are due to triggered activity secondary to DADs and those due to reentry. Thus, one should specifically analyze the following:
Reproducibility of initiation.
The relative efficacy of rapid pacing and extrastimuli on initiation of VT.
The requirement of catecholamines or other pharmacologic agents that directly or indirectly increase cyclic AMP activity (i.e., atropine, xanthines) to initiate VT or facilitate its initiation.
The relationship of the interval from the last stimulus to the onset of the arrhythmia and the cycle length of the early beats of the arrhythmia to the coupling interval of extrastimuli and/or the drive cycle length used to induce the arrhythmia: To do this, the tachycardia must be stopped and started again so that the effect of changing basic drive cycle lengths and the number of extrastimuli on the ability to initiate the tachycardia can be determined.
Site specificity of induction of VT.
The relationship of initiation of VT to conduction delay block and/or continuous electrical activity.
Variable inducibility rates have been reported for induction of sustained VT in patients with coronary artery disease, cardiomyopathy, valvular heart disease, and primary electrical disease.162 This is primarily related to the inclusion of nonsustained VT, patients presenting with cardiac arrest (regardless of the specific tachycardia producing arrest), or documented polymorphic VT and VF under the rubric of sustained VT. In our laboratory, in ≈95% of patients presenting with sustained monomorphic VT, their tachycardia can be replicated, regardless of the underlying pathology with the exception of exercise-induced sustained VT. Patients presenting with cardiac arrest and nonsustained VT have a lower incidence of inducibility; therefore, their inclusion under the rubric of “VT” is responsible for the variable induction rates reported. This is depicted in Figure 11-52, which shows the incidence of inducible arrhythmia in patients presenting with sustained uniform VT, cardiac arrest, and nonsustained VT. If only patients with coronary artery disease are evaluated, little difference occurs in the percentage of inducible arrhythmias in patients presenting with sustained uniform VT (Fig. 11-53). However, the incidence of inducibility in patients presenting with cardiac arrest or nonsustained VT increases with coronary artery disease. Only in the latter two groups of patients does the disease process influence the ability to initiate the rhythm. Other researchers have also noted a high inducibility rate for patients presenting with sustained monomorphic VT with cardiomyopathy (idiopathic, hypertrophic, or arrhythmogenic right ventricular dysplasia), congenital heart disease, or no apparent heart disease.81,163,166,167,168,169,170,171,172,173,174,175
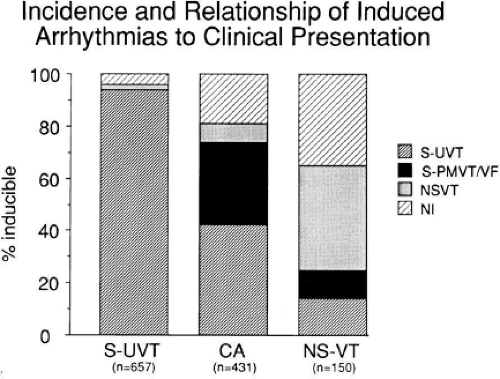 FIGURE 11-52 Incidence and relationship of induced arrhythmias to clinical presentation. The percentage and type of induced arrhythmia for patients with sustained monomorphic VT (SMMVT), cardiac arrest (CA), and nonsustained VT (NS-VT) are shown: 93% of patients presenting with SMMVT have SMMVT initiated; 2% have NS-VT, and only 4% are noninducible (NI). Patients with CA have SMMVT induced in 40% of cases, sustained polymorphic VT/ventricular fibrillation (SPMVT/VF) in approximately 35%, NS-VT in 8%, and no inducible arrhythmias in 17%. In patients with NS-VT, 12% have SMMVT, approximately 10% have SPMVT/VF, 40% have NS-VT, and the remainder have no inducible arrhythmias. (Data as of June 1995.) |
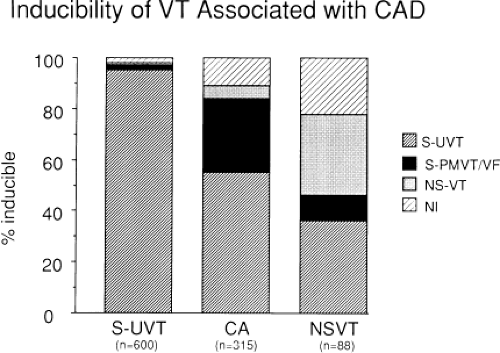 FIGURE 11-53 Inducibility of VT associated with CAD. In patients with CAD, the most marked differences are in inducibility in patients presenting with CA and NS-VT. In patients presenting with SMMVT, 95% have an inducible sustained MMVT. In patients with CA, 57% have SMMVT, and 31% have SPMVT/VF induced. Only 12% are noninducible. In patients presenting with NS-VT, 37% have an SMMVT induced, 14% have SPMVT/VF, 26% have NS-VT induced, and only 23% are noninducible. (Data as of June 1995.) |
Sustained monomorphic VT can be reproducibly initiated from day-to-day and year-to-year, particularly those with coronary artery disease and prior infarction.1,26,131 Although some investigators question the reproducibility of induction of sustained VT,132,176 particularly for arrhythmias requiring triple extrastimuli for induction, these investigators have lumped multiple tachycardia subtypes under the single heading of VT. If one deals only with sustained monomorphic VT, reproducibility of initiation is consistent: If the tachycardia can be induced on day 1, it will be induced on day 2, 10, or a year from the initial study. This is not to say that the exact mode of initiation is reproducible. For example, patients in whom double and triple extrastimuli are required for initiation during day 1 may have a different mode of initiation on day 2. Therefore, although the exact number of extrastimuli or site of stimulation may vary daily, the ability to initiate the arrhythmia does not. The mere repetition of stimulation, either longitudinally (by repeating the entire protocol) or horizontally (by repeating each coupling interval), enhances the sensitivity, and reproducibility of initiation.134 We have studied patients over a 3-year period without any change in our ability to initiate the tachycardia. In patients with multiple morphologically distinct sustained monomorphic VTs, all VTs may not be reproducibly initiated on a given day, but one or more will.
In those tachycardias that can be initiated by single VES or atrial stimulation, the mode of initiation is also usually reproducible. Induction of VT by single VES may be seen in VT due to CAD and in patients with idiopathic LV, verapamil sensitive VT. This phenomenon perhaps reflects a substrate that is always “primed” for initiation. Although no specific anatomic characteristics influence the mode of stimulation, two electrophysiologic parameters, which are related, appear to influence the mode of initiation. These include slow tachycardias,177 VT in patients with the most marked abnormalities of conduction noted by endocardial mapping or signal averaging (unpublished observations), and verapamil sensitive VT.13,113,169,170,171,172,173 This suggests an important role for conduction abnormalities in initiation of the tachycardia, a finding that supports a reentrant mechanism (see following discussion). Distance of stimulation site from the site of origin or from a site of previous infarction does not appear to influence the number of extrastimuli required to initiate VT.177
The fact that sustained uniform VT can be reproducibly initiated excludes both normal and abnormal automaticity as the underlying mechanism. One must therefore differentiate triggered activity from reentry as the underlying mechanism because both can be initiated by programmed stimulation. Although there are numerous studies of the results of programmed stimulation on induction of sustained uniform VT, fewer data are available documenting the ability of stimulation to induce triggered activity associated with delayed or early afterdepolarizations.125,126,127,128,129,130 VTs due to DADs often are related to a high catecholamine state. The most common clinical situation in which this occurs is RVOT and LVOT tachycardias. Induction of such ventricular arrhythmias is related to PCL, number of paced complexes, and prematurity of extrastimuli delivered and is facilitated by isoproterenol infusion, atropine, Calcium, and phosphodiesterase inhibitors.163,178 These differ somewhat from triggered activity in atrial tissue superfused with nonphysiologic amounts of catecholamines.125,126,128 Most of the experimental data related to triggered activity in ventricular tissue are from studies in digitalis-induced triggered rhythms in Purkinje fibers.125,126 Although preliminary data on triggered activity in infarcted myocardial cells are available,126,127,179 only one study demonstrated the ability to induce DADs in human Purkinje fibers obtained from explanted hearts superfused with ouabain or epinephrine.179 In neither case was sustained rhythmic activity induced, only DADs. Human VTs due to digitalis intoxication have not been systematically studied.
The stimulation protocols used in experimental studies are similar to those used in humans, although rapid pacing and programmed extrastimuli are used in both. Regardless of preparation, rapid pacing is the most successful method of initiating sustained triggered activity that is due to DADs. The frequency of triggering increases as the basic PCL decreases. Most episodes of triggered activity induced by rapid pacing lasted less than 25 beats. Single, double, triple, or quadruple extrastimuli in the absence of prior pacing usually fails to initiate triggered activity in digitalis-intoxicated Purkinje fibers.180 It is rare to induce triggered activity in this preparation in the absence of a train of impulses of less than 10 complexes. On the other hand, although extrastimuli rarely initiate triggered activity during sinus rhythm, they can if delivered during a basic drive cycle that exceeds 10 paced impulses. In this latter instance, at any given PCL, the frequency of triggering increases as the coupling interval of the premature stimulus decreases. In ouabain-perfused preparation, the cycle length of triggered activity induced by rapid pacing or extrastimuli is related to the PCL and coupling interval of the extrastimuli, such that the faster the paced rate, the faster the tachycardia.
The maximum reproducibility of initiation using all methods is <50% and most episodes are nonsustained.
The maximum reproducibility of initiation using all methods is <50% and most episodes are nonsustained.
Once a triggered rhythm is initiated, a period of quiescence is necessary to reinitiate the triggered rhythm. This is believed to be due to activation of the Na/K pump which hyperpolarizes the cells so that the DADs can no longer reach threshold. Thus, the ability to initiate, terminate, and reinitiate in sequence is uncommon. Sustained triggered activity also warms up, that is, it accelerates following initiation before reaching a stable cycle length and decelerates prior to termination. The rates of experimental triggered rhythms generally are much slower than the rates of spontaneous sustained, monomorphic VT in humans, even in the presence of catecholamines. In summary, triggered activity due to DADs is moderately difficult to reproducibly initiate, is most reliably initiated by rapid pacing, and the frequency of initiation is related to the rate of pacing and prematurity of extrastimuli. In addition, catecholamines (isoproterenol and epinephrine) or drugs that increase cyclic AMP directly or indirectly (atropine, xanthines, or other phosphodiesterase inhibitors) are frequently required to initiate sustained rhythmic activity that is due to DADs. Even when initiated by pacing alone, catecholamines facilitate initiation, increase the rate, and shorten the interval to the onset of the triggered rhythm.
Triggered activity that is due to early afterdepolarizations appears to be bradycardia dependent, regardless of the method by which they are induced. Only early afterdepolarizations that interrupt Phase 3 of repolarization appear to be able to initiate sustained arrhythmic activity.129 Some investigators suggest that the sustained rhythmic activity following early afterdepolarizations in vitro is in fact abnormal automaticity based on its response to overdrive pacing (see following discussion). More recently Antzelevitch and colleagues112 and El Sherif et al.108 have suggested that reentrant excitation is the mechanism of polymorphic VTs associated with long QT intervals (i.e., torsade de pointes). Cranefield and Aronson have stressed that the short-long-short sequence initiating triggered activity that is due to early afterdepolarizations is the hallmark of that arrhythmia126,130 and related it to clinical arrhythmias: torsade de pointes and repetitive monomorphic tachycardias in the right ventricular outflow tract. They predicted that routine stimulation, therefore, would not induce sustained arrhythmias, which can be sustained and uniform. Data in the subsequent paragraphs will make it obvious that the behavior of the vast majority of sustained monomorphic VTs, particularly in the setting of structural heart disease, is not compatible with triggered activity that is due to either delayed or early afterdepolarizations.
In patients presenting with sustained, hemodynamically stable, monomorphic VT, reproducible initiation by VES is the rule. In more than 90% of patients presenting with paroxysmal, sustained, monomorphic VT, the VT can be reproducibly initiated at the same study and at different times. In our experience, in the total population of patients presenting with sustained, tolerated monomorphic VT, or in only those with coronary artery disease and prior infarction, the inducibility rate of any sustained monomorphic VT is 95% (Figs. 11-52 and 11-53). Single and double VES initiate sustained VT in 60% to 85% of patients.1,42,122,123,149 Moreover, once sustained uniform VT is initiated, it is often easier to reinitiate. As noted earlier, sustained monomorphic VT is induced in >50% of patients presenting with cardiac arrest in the setting of coronary artery disease (Fig. 11-53). In such patients, induction of sustained VT more often requires triple extrastimuli than in patients presenting with hemodynamically tolerated VT (Figs. 11-54 and 11-55). The major difference is the cycle
length of the VT, which is shorter for patients presenting with cardiac arrest at comparable modes of initiation (p < 0.05, see Fig. 11-55). In patients presenting with cardiac arrest, initiation of VT by a single VES is rare.
length of the VT, which is shorter for patients presenting with cardiac arrest at comparable modes of initiation (p < 0.05, see Fig. 11-55). In patients presenting with cardiac arrest, initiation of VT by a single VES is rare.
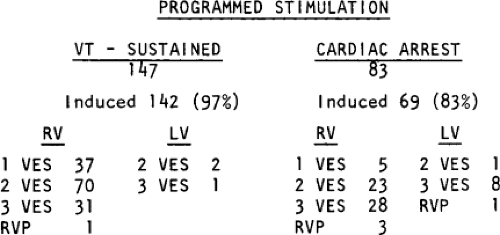 FIGURE 11-54 Results of programmed stimulation in 147 consecutive patients presenting with sustained uniform ventricular tachycardia and 83 presenting with cardiac arrest. The incidence of inducible sustained ventricular arrhythmias is greater in patients presenting with sustained uniform VT than in those presenting with cardiac arrest. Note the increased requirement of triple extrastimuli and left ventricular stimulation for induction of sustained arrhythmias in patients presenting with cardiac arrest. See text for further discussion. RVP, rapid ventricular pacing. |
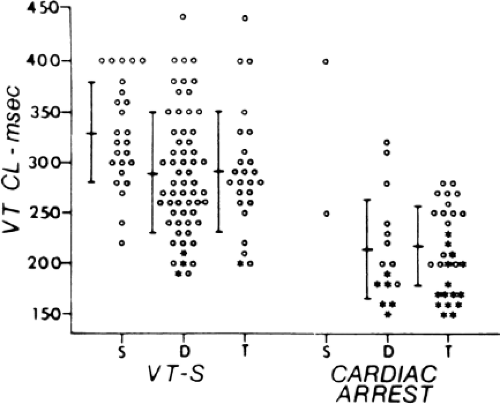 FIGURE 11-55 Relationship of cycle length of induced tachycardias (VT CL) to mode of induction in the group of patients presenting with recurrent sustained VT (VT-S) and cardiac arrest. Horizontal and vertical bars denote mean values of induced tachycardia cycle length and standard deviations. Open circles represent induced tachycardias of uniform pattern, and asterisks represent polymorphic tachycardias. Regardless of mode of initiation, patients presenting with cardiac arrest have faster tachycardias induced than those presenting with VT-S. S, tachycardias induced by single ventricular extrastimuli; D, induction by double extrastimuli; T, induction by triple extrastimuli. (From Buxton AE, Waxman HL, Marchlinski FE, et al. Role of triple extrastimuli during electrophysiologic study of patients with documented sustained ventricular tachyarrhythmias. Circulation 1984;69:532.) |
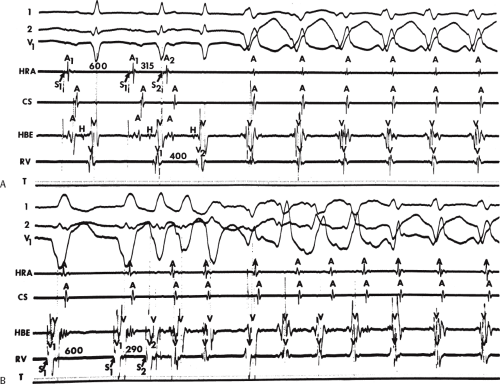 FIGURE 11-56 Initiation of VT by atrial and ventricular stimulation. A: VT is initiated by a single atrial extrastimulus delivered at a coupling interval of 315 msec, producing a V1V2 interval of 400 msec. B: A ventricular extrastimulus at a shorter V1V2 interval (290 msec) is required to initiate the VT. See text for discussion. |
Atrial extrastimuli can initiate VT in approximately 5% of patients with sustained uniform VT. Usually, but not always, these tachycardias can also be initiated by VES (Fig. 11-56). These VTs are usually slower and very reproducibly initiated over a broad zone of coupling intervals.181 Initiation of sustained uniform VT by atrial stimulation is more common in patients without coronary disease.169,170,171,172,173,181,182 One must assess the relationship of the coupling interval of the premature beat to the coupling interval of the first beat of the tachycardia. A direct relationship is characteristic of a triggered rhythm due to delayed afterdepolarizations (Fig. 11-57).
In experimental VT due to digitalis intoxication, sustained VT due to triggered activity could be reproducibly induced with single and double atrial or VES in only 25%.180 Moreover, triggered rhythms were unable to be induced by stimulation during sinus rhythm or by extrastimuli delivered during a drive train of less than 8 to 10 paced complexes. All experimental studies on triggered activity demonstrate that the reproducibility is markedly affected by quiescence; that is, it is harder to induce triggered activity after a triggered rhythm has been just initiated. Human tachycardias believed to be due to DADs are inducible by PES in <65%, most commonly by rapid atrial or ventricular pacing, usually facilitated by catecholamines.163 Induction of sustained monomorphic VT due to triggered activity by atrial pacing is more common in patients with noncoronary disease or without any heart disease.169,170,171,172,173,181,182 These findings are in contrast to the clinical studies of sustained monomorphic VT that show a higher reproducibility rate of initiation, particularly with extrastimuli using paced cycles of eight complexes. Although triggered activity is most effectively initiated by rapid pacing, less than 5% of patients with recurrent sustained monomorphic VT due to reentry in the setting of old myocardial infarction require rapid ventricular pacing for initiation (Fig. 11-58). In a small percentage of patients, atrial pacing, atrial tachycardia, or atrial fibrillation can
induce reentrant sustained monomorphic VT181 in patients with prior infarction (Fig. 11-59). In such cases, single or double extrastimuli can also initiate VT. Use of triple extrastimuli is far more productive in initiating tachycardias than using rapid pacing; the former initiates tachycardias in >90% of patients. This has been tested in our laboratory using our protocol, which uses rapid pacing before the introduction of triple extrastimuli. In the 25% or so of patients with sustained VT who require triple extrastimuli for initiation, the use of rapid pacing has failed to initiate their tachycardia. Thus, rapid pacing only adds a few percent points to the overall inducibility rate.
induce reentrant sustained monomorphic VT181 in patients with prior infarction (Fig. 11-59). In such cases, single or double extrastimuli can also initiate VT. Use of triple extrastimuli is far more productive in initiating tachycardias than using rapid pacing; the former initiates tachycardias in >90% of patients. This has been tested in our laboratory using our protocol, which uses rapid pacing before the introduction of triple extrastimuli. In the 25% or so of patients with sustained VT who require triple extrastimuli for initiation, the use of rapid pacing has failed to initiate their tachycardia. Thus, rapid pacing only adds a few percent points to the overall inducibility rate.
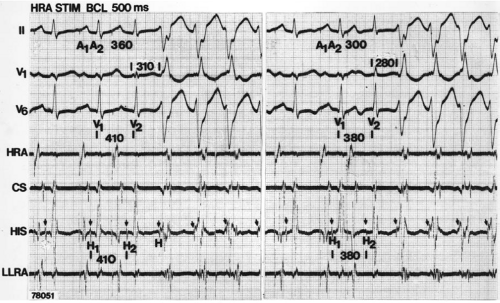 FIGURE 11-57 Initiation of VT by atrial stimulation. Leads II, V1, and V6 are shown with electrograms from the HRA, CS, HIS, and low-right atrium (LRA). During a basic drive cycle length of 500 msec, an atrial premature depolarization delivered at 360 msec initiates VT with a right bundle branch block left axis deviation morphology. The V-V interval initiating this rhythm is 410 msec. In the right-hand panel, when the A1A2 interval is decreased to 300 msec and the resultant V1V2 to 380 msec, VT is induced again. Note a decrease in the interval from the premature QRS complex to the onset of the tachycardia as the coupling interval of the APD is reduced. See text for discussion. (From Wellens HJ, Bar FW, Farre J, et al. Initiation and termination of ventricular tachycardia by supraventricular stimuli. Am J Cardiol 1980;46:576.) |
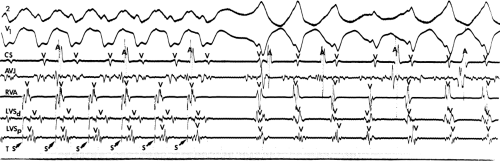 FIGURE 11-58 Initiation of VT by rapid ventricular pacing. Leads 2 and V1 are shown with electrograms from the CS, A-V junction (AVJ), RVA, and distal and proximal pairs of electrodes at the left ventricular septum (LVSd, LVSp). Burst pacing from the RVA initiates VT with a left bundle branch block configuration. S, arrow denotes stimulus artifact. |
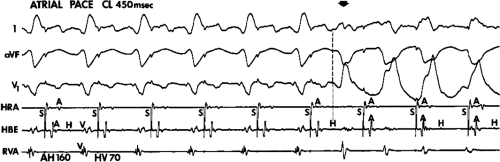 FIGURE 11-59 Initiation of VT by atrial pacing in a patient with coronary artery disease. Atrial pacing at a cycle length (CL) of 450 msec initiates VT. Note the Q waves in leads 1 and V1 from a prior anteroseptal infarction. The H-V interval is also prolonged at 70 msec. The onset of VT is marked by the arrow and a dashed vertical line. |
The cycle length of VT induced with single VES is usually longer than that induced with double or triple extrastimuli or rapid pacing (Fig. 11-60, Table 11-12).177 Occasionally, rapid VT can also be induced with a single extrastimulus (Fig. 11-61). This usually occurs in the rare patient presenting with cardiac arrest in whom a single extrastimulus can initiate VT. Fast or slow tachycardias can be induced by double extrastimuli. When the same VT is induced from multiple sites it has a similar cycle length (Figs. 11-62 and 11-63). The cycle length of VTs requiring ≥3 extrastimuli for induction is comparable to that induced by two extrastimuli. These VT cycle lengths are usually shorter than those induced with single extrastimuli. An example of a rapid VT induced by triple extrastimuli is shown in Figure 11-64. Nonetheless, exceptions to this general pattern are not uncommon. We have seen a patient whose VT required four extrastimuli from the left ventricle during sinus rhythm for initiation that had a cycle length of 360 msec (Fig. 11-65). Moreover, even when rapid pacing is used, there is usually no relation between the PCL initiating the VT and the interval to the first complex of the tachycardia, the cycle length of early beats of the tachycardia, or the minimum rate of the tachycardia. Rapid pacing produces the same tachycardia that is induced with less aggressive measures of stimulation (Fig. 11-66).
Table 11-12 Mode of Initiation of VT Compared with Cycle Length of the 126 Morphologically Distinct Tachycardias in 104 Patients | ||||||||||||||||||||||||
|---|---|---|---|---|---|---|---|---|---|---|---|---|---|---|---|---|---|---|---|---|---|---|---|---|
| ||||||||||||||||||||||||
Thus, the reproducibility of initiation by single, double, or triple extrastimuli delivered during sinus rhythm or eight-beat PCLs, the low yield of rapid pacing-induced initiation, the lack of requirement for a period of quiescence between inductions, and the failure to demonstrate a linear relationship of the PCL to the interval to the first complex and initial cycle length of the tachycardia all suggest reentry rather than triggered activity as the mechanism of the arrhythmia. Moreover, the relationship of the ease of inducibility (single extrastimuli vs. double or triple extrastimuli) and the VT cycle length to abnormalities of conduction are further support of reentry, because such abnormalities should not affect triggered activity.
Isoproterenol infusion, which markedly facilitates the induction of triggered activity, has a limited effect on inducing sustained VT, particularly that which is due to coronary artery disease. As mentioned earlier, although some investigators have noted facilitation of induction of VT by isoproterenol infusion of up to 20%,161 in our experience, it is significantly lower, usually in the range of 5%. This is opposite of what would be expected if the sustained uniform VT were due to triggered activity. Exercise-related VT is a specific type of VT in which rapid pacing and/or isoproterenol are the most efficacious methods of initiation. It can be terminated by carotid sinus pressure and adenosine which is diagnostic of triggered activity due to DADs.163,178 Typically, these have an LBBB right inferior axis and arise from the right ventricular outflow tract. An example of such a tachycardia in which atrial and ventricular pacing and isoproterenol initiated the tachycardia at approximately the
same cycle length is shown in Figure 11-67. Similar tachycardias can arise in the left ventricle outflow tract (right and left coronary cusps, aortomitral continuity, or subjacent myocardium).183,184,185,186 or from the fascicles187 Although these catecholamine-mediated tachycardias occasionally present as sustained VT, more often, they present as repetitive nonsustained tachycardia. This specific entity is discussed later in this chapter.
same cycle length is shown in Figure 11-67. Similar tachycardias can arise in the left ventricle outflow tract (right and left coronary cusps, aortomitral continuity, or subjacent myocardium).183,184,185,186 or from the fascicles187 Although these catecholamine-mediated tachycardias occasionally present as sustained VT, more often, they present as repetitive nonsustained tachycardia. This specific entity is discussed later in this chapter.
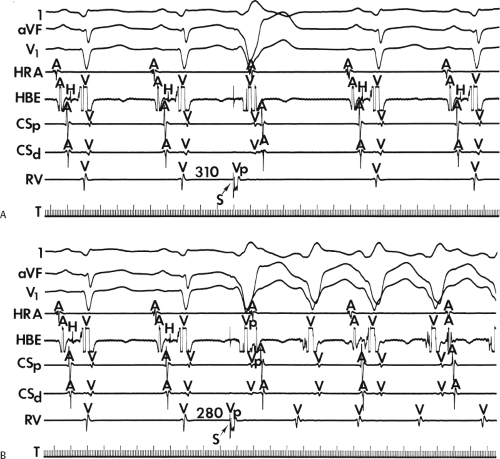 FIGURE 11-60 Initiation in a relatively slow VT with a single ventricular extrastimulus. A: Two sinus complexes are followed by a ventricular extrastimulus (Vp) delivered at 310 msec, which fails to initiate a tachycardia. B: When the coupling interval of the ventricular stimulus is decreased to 280 msec, VT with left bundle branch block morphology is induced. Note the relatively long VT CL of 370 msec. See text for discussion. CSd, distal CS; CSp, proximal CS. |
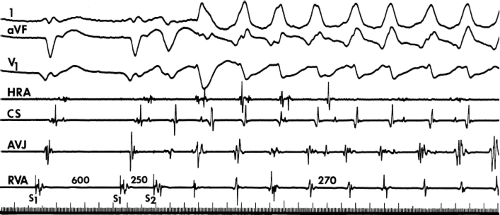 FIGURE 11-61 Initiation of a rapid VT by a single extrastimulus. During a BCL of 600 msec, a ventricular extrastimulus delivered at a coupling interval (S1-S2) of 250 msec initiates a rapid VT with a cycle length of 270 msec. See text for discussion. |
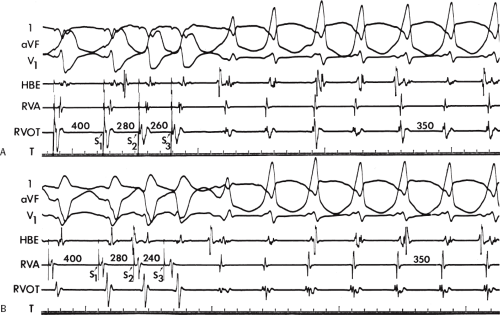 FIGURE 11-62 Initiation of the same VT from two right ventricular sites. VT with a left bundle branch block right inferior axis and a CL of 350 msec is induced by double VES delivered at the same coupling intervals from (A) the RVOT and (B) the RVA. |
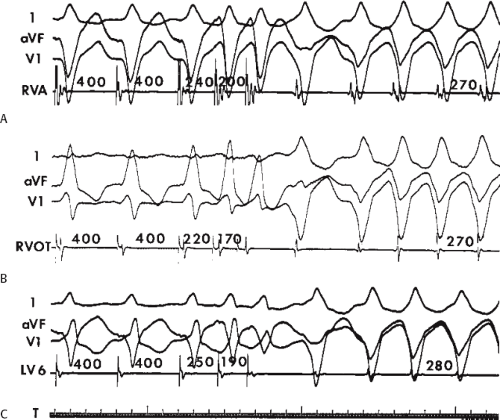 FIGURE 11-63 Initiation of VT with the same morphology and cycle length by right or left ventricular stimulation. Double extrastimuli delivered at 400 msec from (A) the RVA, (B) RVOT, and (C) inferobasal LV initiate a left bundle branch block VT with a similar cycle length. See text for discussion. |
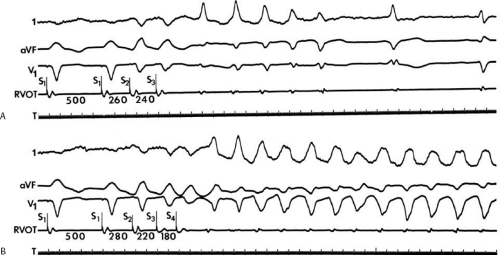 FIGURE 11-64 Initiation of rapid VT with triple extrastimuli. A: Double extrastimuli delivered from the RVOT initiate a nonsustained VT at a cycle length (CL) of approximately 300 msec. B: When three extrastimuli are delivered at relatively short coupling intervals, a more rapid sustained uniform tachycardia at a CL of 250 msec is induced. See text for discussion. |
Possible mechanisms for facilitation of induction of sustained monomorphic VT associated with prior infarction by isoproterenol include the production of ischemia, improving ventricular conduction by hyperpolarization, or shortening ventricular refractoriness, thereby allowing introduction of VES of greater prematurity. In my experience it is this latter mechanism that is most commonly operative in patients with coronary artery disease (Fig. 11-68). Obviously, facilitation of initiation would occur if the mechanism were triggered activity. One would expect initiation with rapid pacing or longer coupling intervals if the mechanism were triggered activity.
Paroxysmal VT in patients with normal hearts who present with paroxysmal VT having an RBBB left axis deviation configuration can also be induced easily by rapid atrial and/or ventricular pacing (Fig. 11-69). This VT is characteristically sensitive to verapamil.169,170,171,172,173,188,189 In this latter group of patients, single and double VES also frequently initiate arrhythmia. In addition, other characteristics of these tachycardias, discussed in subsequent paragraphs, suggest they are more consistent with reentry. This is in sharp contrast to exercise-related tachycardias, in which sustained episodes rarely can be initiated with VES.
Although torsade de pointes is a rhythm that some investigators say is compatible with early afterdepolarizations (described later in this chapter). Cranefield and Aronson126,130 suggest that early afterdepolarizations could give rise to a uniform tachycardia as well. These investigators have suggested that typically triggered activity that is due to early afterdepolarizations is initiated by a short-long-short sequence of complexes. Cranefield uses this sequence to explain why standard electrophysiologic protocols do not induce tachycardias. In my experience, the short-long-short sequence is not that uncommon a mode of spontaneous initiation of uniform sustained VT and is particularly useful for initiating bundle branch reentry (see discussion below). An example is shown in Figure 11-70 in which a short-long-short sequence is observed initiating a spontaneous arrhythmia, which can subsequently be induced by standard programmed stimulation. Approximately 50% of sustained hemodynamically tolerated monomorphic VTs begin with a relatively long (just after the T wave) ventricular complex, which is similar to the other complexes of the tachycardia.190,191 In patients presenting with a cardiac arrest, long-short or short-long-short onsets are more common.192 Most of these rhythms can be initiated by PES suggesting a reentrant mechanism. Thus, no evidence suggests that a specific sequence of initiating events is characteristic of a mechanism of triggered activity that is due to early afterdepolarizations. In summary, based on reproducibility and mode of initiation, the bulk of evidence suggests that recurrent sustained uniform VT not related to exercise has a reentrant mechanism. Only in the case of exercise-induced VT are the initiation data compatible with triggered activity due to
DADs. No stimulation protocol has been studied which initiates tachycardias due to early afterdepolarizations in humans.
DADs. No stimulation protocol has been studied which initiates tachycardias due to early afterdepolarizations in humans.
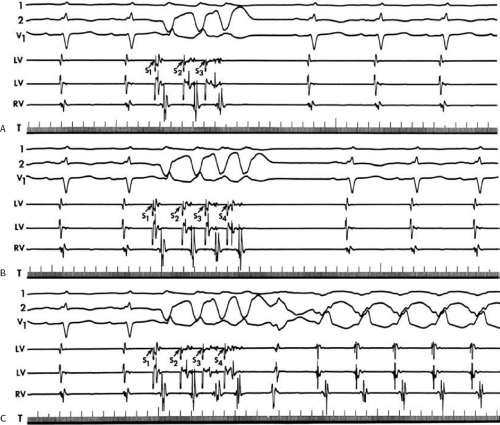 FIGURE 11-65 Initiation of a slow VT by four ventricular extrastimuli. A and B: Triple (top) and (C) quadruple extrastimuli delivered from the LV during sinus rhythm fail to initiate VT. When the coupling intervals of the third and fourth extrastimuli are shortened slightly, S-UVT with a CL of 360 msec is initiated. This was the only mode of induction of VT in this patient. See text for discussion. |
Relationship of Coupling Intervals and Cycle Length Initiating Tachycardia to the Onset of Ventricular Tachycardia and the Initial Ventricular Tachycardia Cycle Length
Conduction delay is required for the initiation of reentrant rhythms (see following discussion). Therefore, an inverse relationship between the coupling interval of the extrastimulus initiating the tachycardia and the interval from the stimulus to the first complex of the tachycardia favors reentry. Similarly, an inverse relationship between the drive cycle length during which extrastimuli at the same coupling interval initiate the tachycardia, and the interval to the onset of the tachycardia, would also favor reentry. When multiple VES are used, it is difficult to evaluate this relationship. In either case, if a reentrant rhythm is present, the initial cycle length would reflect conduction through the tachycardia circuit, which, in the absence of exit block, should demonstrate the same or longer cycle length as the remaining tachycardia cycles, depending on whether any conduction delay is produced in the circuit on initiation.
These findings are in contrast to those observed in triggered rhythms due to DADs in ventricular tissue that often exhibit a direct relationship to the PCL or to the coupling intervals of the extrastimuli that initiate them. Typically, in tachycardias due to DADs the initial cycle of the tachycardia usually bears a direct relationship to the PCL, with or without a direct relationship to the coupling interval of extrastimuli delivered.180 Thus, the shorter the PCL, with or without
extrastimuli, that initiates the tachycardia, the shorter the interval to the first beat of the tachycardia and the shorter the initial cycle length of the tachycardia. Occasionally, with early extrastimuli in digitalis-intoxicated preparations, a jump in the interval to the onset of the triggered rhythm occurs such that it is approximately double the interval to the onset of the tachycardia initiated by later coupled extrastimuli. This has been explained by failure of the initial DAD to reach threshold while the second reaches threshold. Thus, in triggered activity due to DADs in ventricular tissue, the coupling interval of the initial complex of the tachycardia either shortens or suddenly increases in response to progressively premature extrastimuli. It never demonstrates an inverse or gradually increasing relationship. It must be reiterated that, in response to drive cycle length, the onset of the tachycardia always has a direct relationship with the drive cycle length, regardless of the tissue used. Only with the addition of very early extrastimuli or occasionally very rapid pacing (<300 msec), the sudden jump in the interval to the first complex of the tachycardia may be observed. We have never noted a direct relationship between PCL and the interval to the onset of the tachycardia or early tachycardia cycles in the case of paroxysmal, nonexercise-related, sustained monomorphic VT in humans with structural heart disease.
extrastimuli, that initiates the tachycardia, the shorter the interval to the first beat of the tachycardia and the shorter the initial cycle length of the tachycardia. Occasionally, with early extrastimuli in digitalis-intoxicated preparations, a jump in the interval to the onset of the triggered rhythm occurs such that it is approximately double the interval to the onset of the tachycardia initiated by later coupled extrastimuli. This has been explained by failure of the initial DAD to reach threshold while the second reaches threshold. Thus, in triggered activity due to DADs in ventricular tissue, the coupling interval of the initial complex of the tachycardia either shortens or suddenly increases in response to progressively premature extrastimuli. It never demonstrates an inverse or gradually increasing relationship. It must be reiterated that, in response to drive cycle length, the onset of the tachycardia always has a direct relationship with the drive cycle length, regardless of the tissue used. Only with the addition of very early extrastimuli or occasionally very rapid pacing (<300 msec), the sudden jump in the interval to the first complex of the tachycardia may be observed. We have never noted a direct relationship between PCL and the interval to the onset of the tachycardia or early tachycardia cycles in the case of paroxysmal, nonexercise-related, sustained monomorphic VT in humans with structural heart disease.
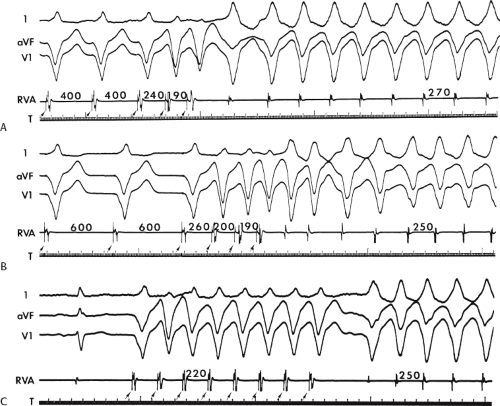 FIGURE 11-66 Lack of relationship of VT cycle length to mode of induction. A left bundle branch block VT of similar cycle lengths is induced by (A) double extrastimuli delivered at 400 msec; (B) triple extrastimuli delivered at a basic drive of 600 msec; and (C) bursts of rapid pacing at 220 msec. See text for discussion. |
When single extrastimuli are delivered, and one can assess the relationship between coupling interval and the interval to the first VT complex, one sees an inverse relationship in approximately 40% of patients (Figs. 11-71 and 11-72).1,122,193,194,195 Sometimes one initially sees an isolated repetitive response followed by initiation of the tachycardia (Fig. 11-71), while at other times, the first extrastimulus initiates a sustained VT (Fig. 11-72). When the drive cycle length is short and tachycardia can be initiated by extrastimuli delivered at the same coupling interval, an inverse relationship is also seen (Fig. 11-73). Most often, particularly when multiple extrastimuli and/or rapid pacing initiate a tachycardia, there is no direct relationship or measurable relationship to the onset of the tachycardia or tachycardia cycle length (Fig. 11-66). In many patients, the coupling interval to the first complex of the tachycardia as well as the initial tachycardia cycle length are unaffected by the mode of stimulation. Thus, as shown in Figure 11-74, atrial pacing at a cycle length of 320 msec, ventricular pacing at 360 msec, and a single extrastimulus delivered at a PCL of 400 msec initiate VT with identical intervals to the onset of the tachycardia and initial cycle lengths
of the tachycardia. We have never seen a direct relationship of PCLs to onset intervals of tachycardias in patients with sustained uniform VT associated with coronary artery disease. Although we have not studied tachycardias associated with digitalis intoxication, Gorgels et al.196 demonstrated a direct relationship of such rhythms in experimental canine models of digitalis intoxication. Whether a human VT associated with digitalis intoxication behaves the same way has not yet been evaluated. When multiple VES and/or rapid pacing are used to initiate the tachycardia, no consistent relationship has been observed between the initiating sequence (number and coupling interval of extrastimuli, paced drive cycle lengths, or cycle lengths of burst pacing) and the initial characteristics of the tachycardia (the interval to the onset of the tachycardia or early tachycardia cycle length).
of the tachycardia. We have never seen a direct relationship of PCLs to onset intervals of tachycardias in patients with sustained uniform VT associated with coronary artery disease. Although we have not studied tachycardias associated with digitalis intoxication, Gorgels et al.196 demonstrated a direct relationship of such rhythms in experimental canine models of digitalis intoxication. Whether a human VT associated with digitalis intoxication behaves the same way has not yet been evaluated. When multiple VES and/or rapid pacing are used to initiate the tachycardia, no consistent relationship has been observed between the initiating sequence (number and coupling interval of extrastimuli, paced drive cycle lengths, or cycle lengths of burst pacing) and the initial characteristics of the tachycardia (the interval to the onset of the tachycardia or early tachycardia cycle length).
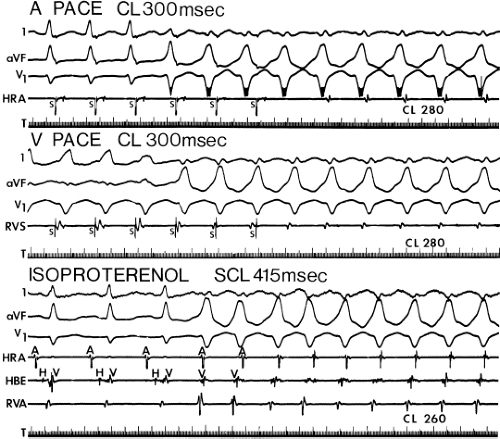 FIGURE 11-67 Initiation of exercise-induced VT by programmed stimulation and isoproterenol infusion. In the top two panels, atrial pacing and ventricular pacing at CLs of 300 msec initiate VT with a left bundle branch block right inferior axis configuration and a CL of 280 msec. Following isoproterenol infusion, which shortened the sinus cycle length (SCL) to 415 msec, VT occurs spontaneously. See text for discussion. |
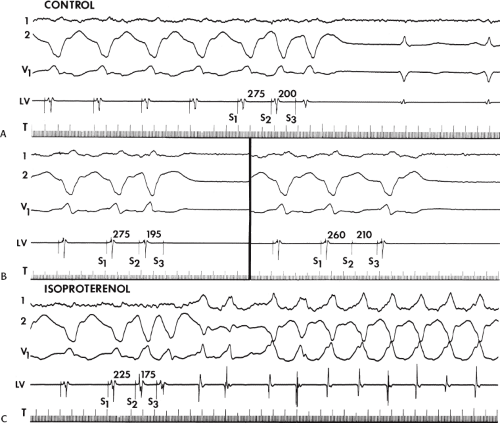 FIGURE 11-68 Facilitation of induction of VT by isoproterenol in a patient with coronary artery disease. A–C. Double extrastimuli fail to initiate VT. Following isoproterenol, the local refractory period at the stimulation site is shortened and closer coupled premature stimuli can capture the ventricle and initiate VT. This rapid VT was identical to that spontaneously occurring in a patient that caused cardiac arrest. |
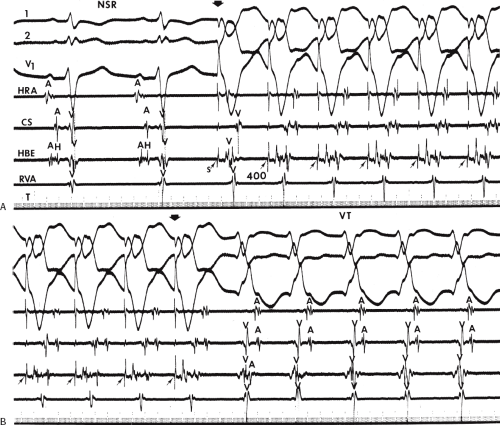 FIGURE 11-69 Initiation of VT in a patient with a normal heart by rapid ventricular pacing. A: Following two sinus complexes, stimulation from the RVOT (not shown) at a cycle length of 400 msec is begun. B: On cessation of pacing, VT is initiated. Note the right bundle branch block superior axis morphology, which is characteristic of patients with idiopathic VT and normal hearts. See text for discussion. NSR, normal sinus rhythm. |
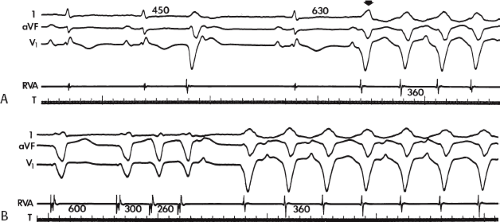 FIGURE 11-70 Ability to initiate sustained VT in a patient whose spontaneous tachycardia occurred after a “short-long-short” sequence. A: A spontaneous ventricular premature complex (VPC) that appears at 450 msec fails to initiate a tachycardia but is followed by a pause. This pause is followed by spontaneous initiation of VT, which occurs at a longer coupling interval (630 msec) than the isolated VPC, which did not initiate an arrhythmia. B: The same tachycardia can be initiated by double extrastimuli from the RVA. Thus, the spontaneous initiation of VT by “short-long-short” CLs does not imply a specific mechanism of the tachycardia. See text for discussion. |
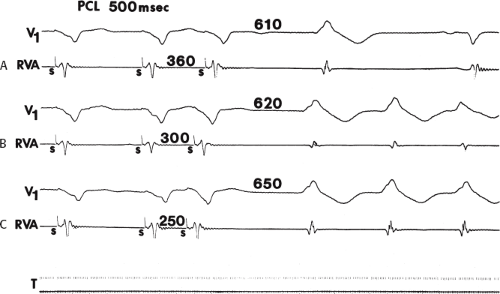 FIGURE 11-71 Initiation of VT with an inverse relationship of coupling intervals to the interval preceding the onset of the tachycardia. A single ECG lead, V1, and an electrogram from the RVA are shown in three panels. A: At a coupling interval of 360 msec, a single repetitive ventricular response is noted with a coupling interval of 610 msec. B: At a closer coupling interval of 300 msec, VT begins after a pause of 620 msec. C: Finally, at an even shorter coupling interval of 250 msec, VT is again initiated, with an even longer pause of 650 msec. This inverse relationship is compatible with a reentrant mechanism. See text for discussion. |
Relationship of Stimulation Site to Initiation of Ventricular Tachycardia
With triggered rhythms, the site of stimulation should have no effect on initiating a tachycardia as long as the impulse reaches the site of triggered activity. This is not so for reentrant arrhythmias, where wavefront of activation may be important in developing block and slow conduction. Unpublished observations from our laboratory have shown that single and double extrastimuli delivered at PCLs of 600 or 400 msec always reach the “site of origin” of left VTs, even in the presence of markedly abnormal conduction manifested by abnormal electrograms. One can usually demonstrate changes in local abnormal electrograms at arrhythmogenic sites in response to different sites of stimulation. This observation supports the role of tissue anisotropy in creating conduction delays and/or block associated with initiation of VT. Thus, failure to reach the site of tachycardia origin cannot be used to explain differences in incidence of inducibility by the site of stimulation. As stated earlier, although in most patients, the same tachycardia can be initiated from both the right ventricular outflow tract and right ventricular apex (Figs. 11-50 and 11-62), this is most often true when single extrastimuli (Fig. 11-75) initiate the tachycardia. The site of stimulation may be an extremely important factor in initiating VT in humans if only the right ventricular apex is used. Twenty to 30% of patients will require stimulation from a second right ventricular site if two extrastimuli delivered at two PCLs are employed. If three extrastimuli are employed, 10% to 25% of patients will require a second right ventricular site.140,156 As noted earlier, we have found that if three extrastimuli fail to initiate sustained uniform VT from the right ventricular apex, 22% of tachycardias can be initiated from the right ventricular outflow tract (Fig. 11-76).156 If only two extrastimuli are involved, nearly 10% of patients will require stimulation from the left ventricle (Fig. 11-77).157 If a protocol including three extrastimuli delivered at two right ventricular sites and at multiple drive cycle lengths is used, the incidence for requirement of left ventricular stimulation to initiate a sustained VT is <5% (Fig. 11-78).1,42,122,149
Because the incidence of inducing nonspecific polymorphic tachycardias increases with the use of increasing numbers of extrastimuli, one should employ a protocol that allows testing from multiple sites with the least number of stimuli before using more aggressive protocols. Using the protocol shown in Table 11-11, we have found that in approximately 20% of people sustained monomorphic VT can be initiated with less extrastimuli at one site than at another. This is an important observation, if one wants to limit the potential for developing polymorphic VT and VF. A dramatic example is shown in Figure 11-79 in which triple extrastimuli from the right ventricular apex could initiate only a polymorphic VT in a patient with spontaneous sustained monomorphic VT. Stimulation from the right ventricular outflow tract at longer coupling intervals induced two different sustained monomorphic VTs, which were identical to those spontaneously occurring in the
patient. An even more dramatic example of the influence of inducibility is shown in Figure 11-80. Here, triple extrastimuli from the right ventricular apex failed to initiate any VT, but a single extrastimulus delivered from the right ventricular outflow tract initiated a well-tolerated sustained monomorphic VT. Thus, a second right or left ventricular site may be required for initiation or may make initiation possible with a fewer number of stimuli in 30% to 40% of patients. As noted earlier, patients with sustained uniform VT who present with a cardiac arrest more frequently require left ventricular stimulation than patients presenting with tolerated uniform VT.42 The reasons for this are unclear, but may be related to a lesser amount of conduction abnormalities and/or greater extent of homogeneous refractoriness produced by a broad wavefront from the RV compared to that produced by a more narrow wavefront initiated in the LV. In sum, the demonstration of absolute or relative site specificity for initiation of VT, using standard stimulation protocols that have been demonstrated to reach the site of tachycardia origin, favors a reentrant mechanism for VT. Rhythms related to DADs should show no evidence of site specificity as long as comparable coupling intervals can reach the site of DADs.
patient. An even more dramatic example of the influence of inducibility is shown in Figure 11-80. Here, triple extrastimuli from the right ventricular apex failed to initiate any VT, but a single extrastimulus delivered from the right ventricular outflow tract initiated a well-tolerated sustained monomorphic VT. Thus, a second right or left ventricular site may be required for initiation or may make initiation possible with a fewer number of stimuli in 30% to 40% of patients. As noted earlier, patients with sustained uniform VT who present with a cardiac arrest more frequently require left ventricular stimulation than patients presenting with tolerated uniform VT.42 The reasons for this are unclear, but may be related to a lesser amount of conduction abnormalities and/or greater extent of homogeneous refractoriness produced by a broad wavefront from the RV compared to that produced by a more narrow wavefront initiated in the LV. In sum, the demonstration of absolute or relative site specificity for initiation of VT, using standard stimulation protocols that have been demonstrated to reach the site of tachycardia origin, favors a reentrant mechanism for VT. Rhythms related to DADs should show no evidence of site specificity as long as comparable coupling intervals can reach the site of DADs.
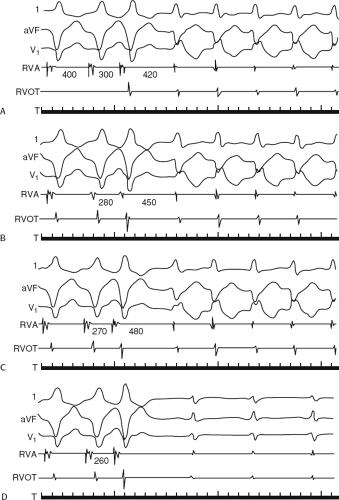 FIGURE 11-72 Inverse relationship of coupling interval of premature stimuli to the interval at onset of initiation of VT in a patient with no heart disease. A–D: VES are delivered from the RVA at a BCL of 400 msec. A–C: As the coupling interval is reduced from 300 to 270 msec, VT is initiated but with a progressively longer interval to the onset of the tachycardia. D: At an even shorter coupling interval of 260 msec, no VT is initiated. See text for discussion. |
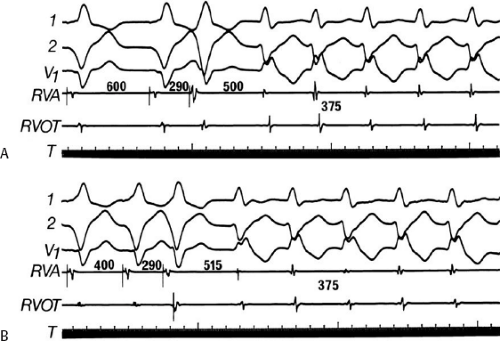 FIGURE 11-73 Inverse relationship of basic drive cycle length and interval to onset of induced VT. A: At a BCL of 600 msec, a premature stimulus delivered at 290 msec initiates VT, which begins after a delay of 500 msec. B: When the basic drive cycle length is reduced to 400 msec, a single extrastimulus induced at an identical coupling interval of 290 msec initiates the same VT but after a longer delay of 515 msec. This inverse relationship at a BCL is supportive of a reentrant mechanism. See text for discussion. |
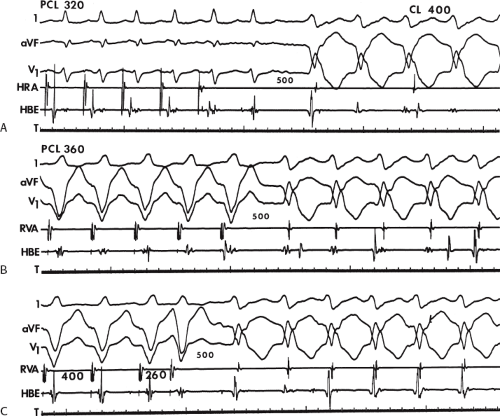 FIGURE 11-74 Lack of effect of basic drive cycle length (CL) or mode of stimulation on coupling interval to onset of induced VT. A: VT is initiated by atrial pacing at a CL of 320 msec. The tachycardia begins after an interval of 500 msec from the last ventricular depolarization. B: Pacing from the RVA at a CL of 360 msec initiates the identical VT, which begins after the same delay as observed in (A) when the drive CL was shorter. C: At an even longer drive CL of 400 msec, a single extrastimulus delivered from the RVA again initiates the same tachycardia with the same delay to the onset of the tachycardia as noted in (A) and (B). The failure of paced cycle length or mode or initiation to influence either the coupling interval to the onset of VT or the early cycles of VT are incompatible with triggered activity. See text for discussion. |
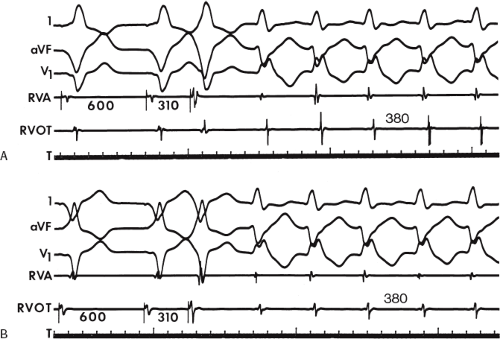 FIGURE 11-75 Initiation of the same morphologically distinct tachycardia by stimulation at the right ventricular apex and outflow tract. A and B: Programmed stimulation is performed at a basic drive cycle length of 600 msec, and premature stimuli are delivered at 310 msec. Stimulation from (A) the RVA and (B) the RVOT initiates the identical tachycardia. |
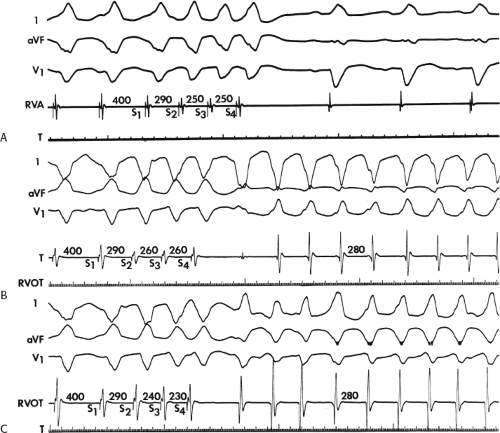 FIGURE 11-76 Initiation of two VTs from the right ventricular outflow tract when stimulation from the right ventricular apex failed to initiate a tachycardia. A: Triple ventricular extrastimuli delivered at a paced cycle length of 400 msec from the RVA failed to initiate VT. B and C: Pacing from the RVOT at a comparable drive cycle length and coupling intervals of extrastimuli initiates two morphologically distinct tachycardias. This observation may be seen in ≈20% of patients. See text for discussion. |
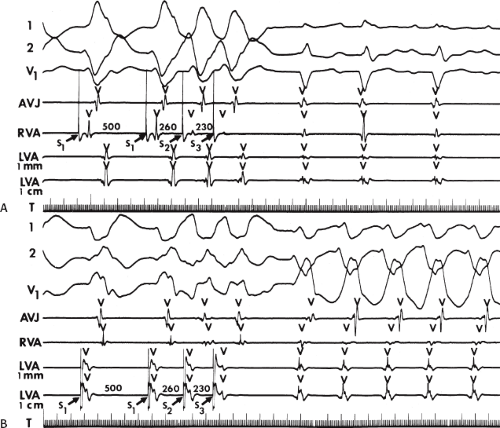 FIGURE 11-77 Requirement of left ventricular stimulation to initiate VT. A: Double VES delivered from the RVA fail to initiate VT. B: When double VES at identical coupling intervals are introduced at the LVA, sustained uniform VT is initiated. See text for discussion. |
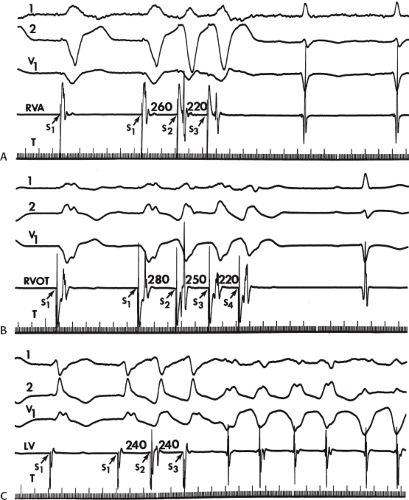 FIGURE 11-78 Initiation of VT from the LV after failure of initiation from the RV. A and B: Stimulation from the RVA (double extrastimuli) and RVOT (triple extrastimuli) fail to initiate VT. C: Double extrastimuli from the LV initiate sustained VT. See text for discussion. |
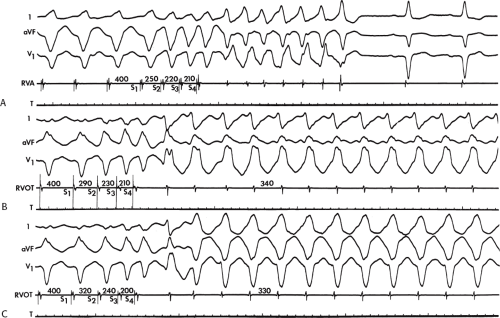 FIGURE 11-79 Initiation of polymorphic VT from the RVA and uniform VT from the RVOT. A: Triple extrastimuli delivered from the RVA at a PCL of 400 msec initiates a nonsustained polymorphic VT. B and C: Stimulation from the RVOT at longer coupling intervals initiates two distinct uniform VTs. See text for clinical significance. |
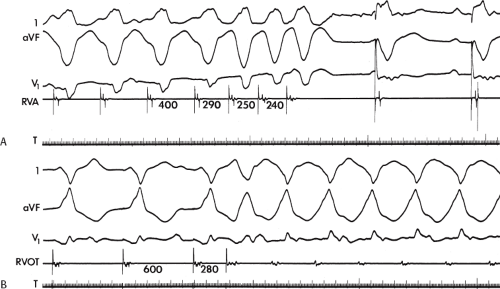 FIGURE 11-80 Site specificity for induction of VT. A: Triple VES delivered from the RVA at a PCL of 400 msec fail to initiate the tachycardia. No form of stimulation from the RVA initiated sustained VT. B: However, a single VES stimulus delivered from the RVOT at a drive CL of 600 msec initiates a sustained uniform VT. This remarkable site specificity would not be characteristic of a triggered rhythm and demonstrates the need for a protocol using at least two right ventricular stimulation sites. See text for discussion. |
Relationship of Initiation of VT to Conduction Delay, Block, and/or Continuous Activity
Rhythms that are due to automaticity or triggered activity do not require associated conduction delay and/or block for initiation while classically, reentry requires conduction delay with or without the development of block, which may be present at baseline. As discussed earlier, evidence of conduction abnormalities is virtually universal in patients with cardiac disease (primarily coronary artery disease) during sinus rhythm, manifested by abnormal electrograms during endocardial mapping (see earlier discussion on Substrate), or positive SAECGs, in patients in whom inducible tachycardias are present. Theoretically, if reentry was the mechanism of the tachycardia, electrical activity should occur throughout the tachycardia cycle. Thus, during diastole, conduction must be extremely slow and in a small enough area such that it is not recorded on the surface ECG. The demonstration that initiation of the tachycardia depended on a critical degree of slow conduction, manifested by fragmented electrograms spanning diastole, and that maintenance of the tachycardia was associated with repetitive continuous activity, would be compatible with reentry.197 The initiation of tachycardias associated with continuous activity was initially recorded in acute ischemic arrhythmias in an experimental canine model by Boineau and Cox198 and Waldo and Kaiser199 and subsequently by El-Sherif et al.200 in a canine model of infarction with inducible sustained VT. We have found similar, continuous repetitive activity in local areas of the endocardium, which was required to initiate and maintain the tachycardia in humans in 5% of patients during catheter mapping197 and in 10% of patients using intraoperative mapping. Although some have questioned continuous activity as potentially being due to motion artifact,44,201,202 in vitro tissue studies43,44 have shown that such fragmented electrograms are not due to motion artifact. In humans, Waxman and Sung203 and Brugada et al.204 claimed that continuous activity is not related to the tachycardia mechanism, but the examples that they proposed demonstrating continuous activity showed inconsistent electrograms lasting only two cardiac cycles. This clearly would not meet our definition of continuous activity, which is required to maintain the tachycardia. Electrical signals that come and go throughout diastole should not be considered continuous.
This is not to say that all fragmented electrical activity noted at the onset and during VT represents reentrant activity. Such activity may represent artifacts, dead-end pathways, or electrical activity otherwise unrelated to the genesis and maintenance of the tachycardia. For continuous activity to be consistent with reentry, the following must be demonstrated: (a) The initiation of VT depends on broadening of electrograms that span diastole, as in Figures 11-81 and 11-82. (b) The tachycardia maintenance depends on continuous activity, such that termination of the continuous activity, either spontaneously or following stimulation, without affecting the tachycardia would exclude such “continuous” activity as requisite for sustaining the tachycardia (Figs. 11-83 and 11-84). (c) Pacing at a cycle length comparable to VT does not produce a broadening of electrogram to span the cardiac cycle and appear continuous, that is, create an electrogram whose duration equals the PCL. (d) Motion artifact is excluded (this is easiest because such electrograms are recorded only in infarcted ventricle, and never from moving contractile normal ventricle. (e) The continuous activity is recorded from a circumscribed area (Figs. 11-81 to 11-84). (f) Finally, if possible, ablation of the area from which continuous activity is recorded will terminate the tachycardia. Thus, the mere presence of “continuous activity” at the onset and during VT does not automatically imply that this electrical activity is related to the genesis and maintenance of the tachycardia. One must stimulate during VT to prove that the presence of such electrical activity is requisite for the arrhythmia. Persistent changes in the repetitive continuous waveform produced by stimulation should be associated either with termination of the arrhythmia or with changing it to a different tachycardia. A change in the electrogram on the stimulated beat may reflect antidromic capture by the stimulated wavefront of part of the tissue from which the continuous activity is recorded. The tachycardia would either be reset or terminated if the electrical signals were recorded from the reentrant circuit (see subsequent discussion on Resetting and Entrainment).
Conduction delay that is not quite continuous can also be seen at initiation of tachycardia in an additional 5% of patients (Fig. 11-85). Conduction delays producing nearly continuous activity may critically depend on rate. They may only be seen when extrastimuli are delivered during a short-paced drive cycle length (Fig. 11-85) or during a burst of ventricular pacing (Fig. 11-86). If the recording electrode is not recording the entire circuit, one may see broadening of the electrogram such that the delayed late component becomes the early component during the tachycardia (Figs. 11-86 and 11-87). Proof that this late potential in fact becomes an early potential (as far as the tachycardia circuit is concerned) requires demonstration that this potential bears a fixed relationship to the subsequent QRS despite changes in cycle length observed spontaneously or during pacing. This is discussed further in the section regarding methods of localizing VT. It is imperative that such validation be attempted so that dead-end pathways, which are late and unrelated to the tachycardia, are not mistaken for early activity. Failure to demonstrate continuous activity in all cases suggests that the tachycardia circuit is larger than the recording area of the catheter and/or that the catheter is not covering the entire circuit. Because catheter and intraoperative mapping of VT associated with prior infarction suggests that most tachycardias exit a diastolic pathway 1 to 3 cm long and a few millimeters to 1 cm wide, with a circuit area probably in excess of 4 cm2, failure to record continuous activity is not surprising (see later section on activation mapping during VT). Continuous activity, when observed, is always found at sites that demonstrate a markedly abnormal electrogram in sinus rhythm (Fig. 11-88; also see Figs. 11-81 to 11-84). Evidence supporting the significance of fractionated electrograms and continuous activity has been reviewed by Josephson and Wit.43
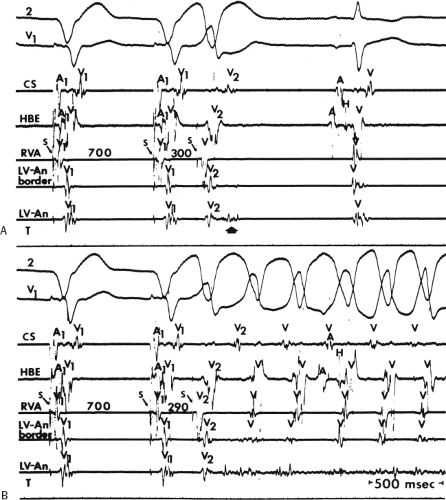 FIGURE 11-81 Initiation of VT associated with the development of continuous activity in a patient with coronary artery disease. Surface leads 2 and V1 are shown with electrograms from the CS, HBE, RVA, and at the border of left ventricular aneurysm (LV-An) and just inside the LV-An. A and B: Ventricular pacing is carried out from the RVA at a CL of 700 msec. A: A ventricular extrastimulus delivered at 300 msec produces marked prolongation of duration of the electrogram in the LV-An (arrow). This is not followed by VT. Note in the ensuing sinus complex that the electrogram recorded from the LV-An has multiple components, is of low amplitude, and long duration. B: When the coupling interval is reduced to 290 msec, V2 in the LV-An is associated with prolonged continuous electrical activity, which spans diastole and is associated with initiation of VT. Note that during VT, continuous electrical activity remains in the electrogram from the LV-An, yet the electrogram recorded from a proximal pair of electrodes, 1 cm away, at the border of the LV-An, does not show continuous activity. See text for discussion. |
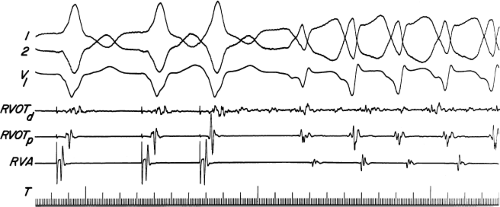 FIGURE 11-82 Initiation of VT associated with continuous activity in a patient status post repair of tetralogy of Fallot. Three ECG leads and electrograms from the distal RVOT (RVOTd) at the site of a prior infundibulotomy scar, the proximal RVOT (RVOTp) and the RVA are shown. A single extrastimulus delivered from the RVA initiates VT. Note the initiation is associated with fragmentation and delay of the electrogram in the distal RVOT, which remains continuous during the tachycardia. See text for discussion. |
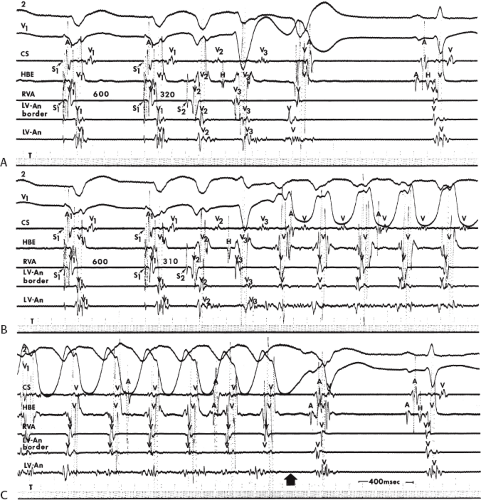 FIGURE 11-83 Requirement for continuous activity for maintenance of VT. This figure is organized the same as Figure 11-81. A and B: Ventricular pacing and extrastimuli are delivered during a cycle length of 600 msec. A: An extrastimulus from the RVA at 320 msec initiates a bundle branch reentrant complex followed by a single repetitive response. B: When the coupling interval is reduced to 310 msec, continuous electrical activity is produced in the electrogram from the LV-An, and VT is initiated. C: When continuous activity stops (broad arrow), the tachycardia terminates. See text for discussion. |
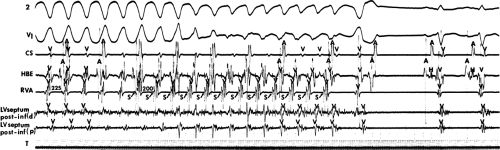 FIGURE 11-84 Termination of VT with termination of continuous activity. Surface leads 2 and V1 are shown with electrograms from the CS, HBE, RVA, and electrograms along the posterior-inferior left ventricular septum from the distal pair (d) and proximal (p) pair of electrodes on the same catheter. Continuous electrical activity is observed during VT in the distal LV septal electrogram. Following a burst of ventricular pacing at 200 msec, continuous activity is disrupted and tachycardia terminates. Note the flat baseline following termination. The electrogram from the distal LV is markedly abnormal, with multiple components, long duration, and low amplitude during the two sinus beats that follow termination of the tachycardia. See text for discussion. (From Josephson ME, Horowitz LN, Farshidi A. Continuous local electrical activity: a mechanism of recurrent ventricular tachycardia. Circulation 1978;57:659.) |
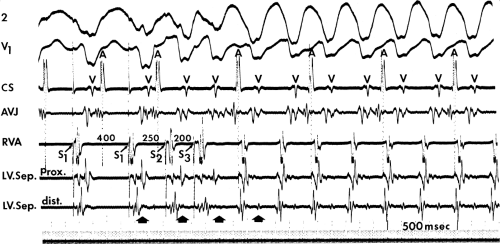 FIGURE 11-85 Initiation of VT by ventricular extrastimuli producing nonholodiastolic conduction delay. Leads 2 and V1 and electrograms from CS, AVJ, and RVA are shown with electrograms recorded from the distal and proximal pair of electrodes along the mid-left ventricular septum (LV Sep.). Two ventricular extrastimuli delivered from the RVA during a basic drive cycle length of 400 msec result in progressive conduction delay (arrows), which reaches a critical degree to initiate VT. The subsequent tachycardia beats have a mid-diastolic or late systolic potential (arrow), which corresponds to the delayed potential of the S3 initiating the tachycardia. Note that the terminally delayed electrogram on S3 (third arrow), which initiates the tachycardia, has the same timing to the large left ventricular electrogram on the initial beat and on subsequent beats. This relationship suggests that it is related to all subsequent beats and represents an integral part of a reentrant circuit. See text for discussion. |
Role of the His–Purkinje System in Initiating and Maintaining Sustained Uniform Ventricular Tachycardia
Since the recognition of reentry within the His–Purkinje system as a normal phenomenon that can produce isolated repetitive responses, several investigators have observed persistent His–Purkinje reentry try as a form of macroreentrant VT.18,19,205 The demonstration of a macroreentrant circuit using the bundle branches, or more recently the fascicles,206 is of more than intellectual interest because this type of tachycardia can be cured by catheter ablation techniques.205,206,207,208 Sustained bundle branch reentrant VT is uncommon. Although Casceres et al.19 suggested that it is responsible for 6% of VT, I have observed only 14 instances in which bundle branch reentry was the sole inducible, and presumed clinical, monomorphic VT out of approximately 1650 consecutively studied
cases. None of our 14 cases had a prior infarction: 10 had cardiomyopathy, 2 had aortic valve disease, and 2 had myotonic dystrophy. All but 2 of our patients and the vast majority reported in the literature18,19,205,206,207 had either complete or incomplete LBBB pattern and H-V intervals ≥65 msec in sinus rhythm. They all had bundle branch reentry with an LBBB pattern (see Chapter 2; Fig. 11-89). Two patients had incomplete RBBB, and had bundle branch reentry with a RBBB pattern. In contrast, in patients with prior infarction (virtually always a large anterior infarction complicated by bifascicular block) interfascicular reentry (using anterior and posterior fascicle) is the only macroreentrant rhythm observed requiring the His–Purkinje system (see Chapter 2). Moreover, I have never seen interfascicular reentry as the sole arrhythmia in these patients; they invariably have multiple intramyocardial VTs as well. I have never seen bundle branch reentry using the right and left bundle branches in this patient population. This is consistent with our observation that when RBBB occurs and persists following anteroseptal infarction, complete bidirectional RBBB is present. Interfascicular reentry may also be seen in
patients without infarction, including patients with bifascicular block due to degenerative disease of the conducting system. I have seen 2 patients with both BBR with an LBBB pattern and interfascicular reentry. During their BBR a changing axis was observed. In both cases, interfascicular reentry occurred after ablation of the RBB (Fig. 11-90A–C). Our failure to observe a higher incidence of sustained bundle branch reentry may be directly related to the patient population studied and, to a lesser degree, to the stimulation protocol used. We have studied only 112 patients with sustained uniform VT and cardiomyopathy, only 8 of whom had bundle branch reentry as their only arrhythmia and an additional 2 had BBR and interfascicular reentry. I have seen another seven patients in whom multiple VTs accompanied bundle branch reentry. Although Casceres et al.19 suggest, and I agree, that this disorder is often unrecognized, I think the patient population is the most important factor in trying to determine the frequency of its occurrence. Stimulation is generally performed from the right ventricle, which is much less likely to give rise to bundle branch reentry with an RBBB pattern, although we have seen such a patient (see below). Moreover, as noted above the majority of patients with bundle branch reentry and interfascicular reentry have spontaneous and/or inducible intramyocardial reentrant VT as well.
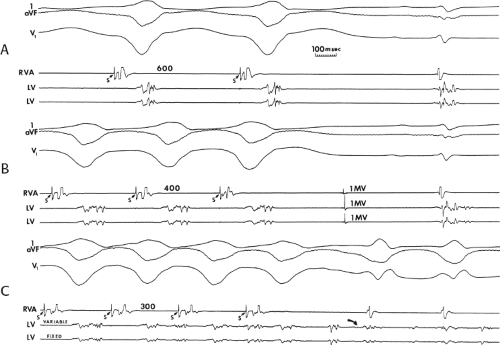 FIGURE 11-86 Initiation of VT by rapid ventricular pacing producing progressive conduction delay. A–C: Three ECG leads, an electrogram from the RVA, and two LV electrograms are shown. A and B: Pacing at 600 and 400 msec, respectively, fails to initiate a tachycardia; however, progressive delay of the LV electrogram is seen. Note the marked abnormalities of the LV electrogram during the sinus complex following pacing. C. When the paced cycle length is reduced to 300 msec, the LV electrogram splits, and the second component becomes progressively delayed until it spans diastole and initiates a VT (curved arrow). See text for discussion. |
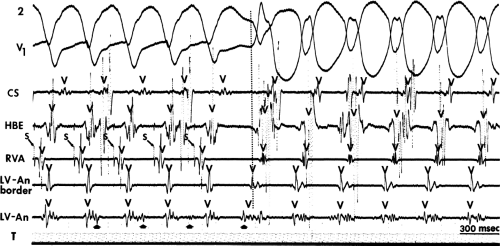 FIGURE 11-87 Ventricular tachycardia induced by ventricular pacing associated with local left ventricular conduction delay. This figure is organized identically to Figures 11-81 and 11-88. The catheter, however, has moved slightly. During ventricular pacing from the RVA at 300 msec, progressive fractionation and conduction delay in the LV-An recording (broad arrows) result in initiation of VT. See text for discussion. (From Josephson ME, Horowitz LN, Farshidi A. Continuous local electrical activity: a mechanism of recurrent ventricular tachycardia. Circulation 1978;57:659.) |
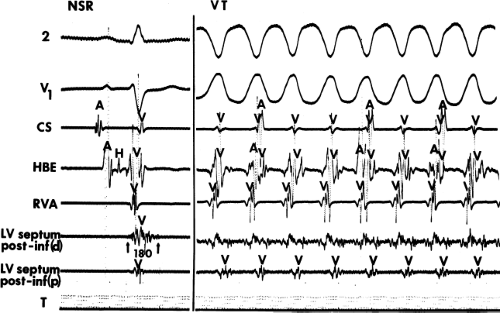 FIGURE 11-88 Relationship of electrogram demonstrating continuous activity during VT to sinus rhythm. This figure is organized the same as Figure 11-76. During VT on the right, continuous electrical activity is present in the distal posteroinferior septal recording. During sinus rhythm on the left, the same electrogram demonstrates a multicomponent low-amplitude signal, 180 msec in duration, which extends well beyond the end of the QRS. Such abnormal electrograms are typical of sites from which continuous electrical activity is observed. (From Josephson ME, Horowitz LN, Farshidi A. Continuous local electrical activity: a mechanism of recurrent ventricular tachycardia. Circulation 1978;57:659.) |
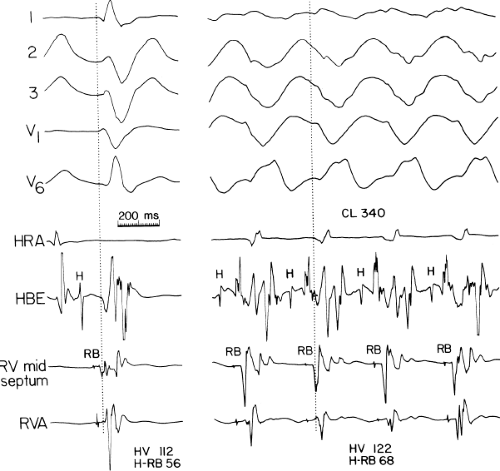 FIGURE 11-89 Ventricular tachycardia that is due to bundle branch reentry with antegrade conduction over the right bundle branch. Five surface ECG leads are shown with electrograms from the HRA, HBE, mid-RV septum, and RVA. During sinus rhythm on the left, incomplete left bundle branch block with left axis deviation is present. The H-V interval is 112 msec and the H-RB potential at the midseptum is 56 msec. A distal RB potential is observed in the RVA electrogram. During VT, the HV is slightly prolonged to 122 msec and the His precedes the RB by 68 msec. The RB also precedes the distal RB recording in the RVA, as in sinus rhythm. Note the presence of 1:1 retrograde conduction. The VT has a left bundle branch block left axis deviation configuration. See text for discussion. |
To prove bundle branch reentry is operative, several criteria should be met: (a) critical degree of retrograde His–Purkinje conduction delay (V-H prolongation) for initiation; (b) an H-V interval during the tachycardia ≥H-V during sinus rhythm can be seen if the His bundle is recorded distally. It is also possible to see a shorter H-V interval during the tachycardia than sinus rhythm if a very proximal His bundle (far from the turnaround site) is recorded; (c) during bundle branch reentry with an LBBB pattern, the His deflection occurs before the right bundle deflection (the H-RB during VT can be greater or less than the H-RB in sinus rhythm, depending on the recording site of the His bundle relative to the turnaround site). The RB to V should be greater than or equal to the R-B to V during sinus rhythm. During bundle branch reentry with an RBBB pattern the RB potential will occur before the His potential which will in turn precede the LB potential; (d) changes in H-H interval during the tachycardia precede changes in the V-V interval; (e) an atrial premature depolarization that blocks below the His bundle deflection should stop bundle branch reentry; (f) bundle branch reentrant VT can be prevented by simultaneous right and left ventricular stimulation; and (g) ablation of the right or left bundle branch could cure the arrhythmia.
A typical example of bundle branch reentrant tachycardia with an LBBB pattern is shown in Figure 11-89. In this case—a patient with myotonic dystrophy—incomplete LBBB is present during sinus rhythm with a markedly prolonged H-V interval of 112 msec and an H-RB of 56 msec. During the tachycardia, the classic sequence of V-H-RB is noted, with the H-V slightly greater than that observed during sinus rhythm. However, as stated above the H-V and H-RB may be less than sinus rhythm if the His bundle deflection is recorded very proximally. The H-V during the tachycardia would then
represent the difference between retrograde conduction to the proximal His bundle and antegrade conduction to the right bundle. I have not seen an H-V in VT more than 15 msec shorter than sinus in either a single bundle branch reentrant complex or sustained bundle branch reentry. A much shorter H-V during tachycardia than sinus rhythm is the rule in interfascicular reentry (see below).
represent the difference between retrograde conduction to the proximal His bundle and antegrade conduction to the right bundle. I have not seen an H-V in VT more than 15 msec shorter than sinus in either a single bundle branch reentrant complex or sustained bundle branch reentry. A much shorter H-V during tachycardia than sinus rhythm is the rule in interfascicular reentry (see below).
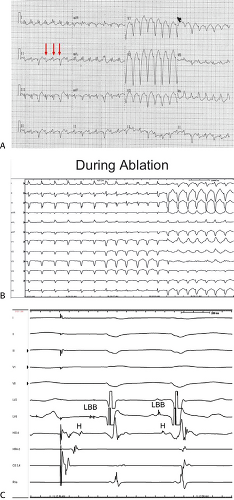 FIGURE 11-90 Intrafascicular reentry and bundle branch reentry in the same patient. A: A 12-lead ECG showing VT with a typical LBBB morphology but a changing axis consistent with Wenckebach in the left anterior fascicle. B: During ablation of the RBB, marked left axis deviation and RBBB appear. C: Pacing the CS initiates intrafascicular reentry which is characterized by an RBBBB/LAH morphology (the same as in B) and reversal of the His and LBB potential. See text for explanation. |
Unfortunately, right and/or left bundle branch potentials are not always recorded so that the typical activation sequences (LB-H-RB-V or RB-H-LB-V) are not available for analysis. As noted earlier in the chapter, even if either sequence is present, the His–Purkinje system (usually, the left bundle branch) could be activated passively in the retrograde fashion to produce a His-RB-V sequence during a tachycardia with an LBBB pattern without reentry requiring the bundle branches. This was pointed out earlier in the chapter, in Figure 11-12, in which a wide-complex tachycardia with left bundle and left axis deviation was induced by ventricular stimulation and V-H prolongation, with an H-V interval during the tachycardia greater than that during sinus rhythm. This tachycardia, although meeting initiation criteria and H-V interval criteria, was not due to bundle branch reentry because left ventricular mapping demonstrated earliest activity at the apex of the left ventricle. For documentation of bundle branch reentry using the right bundle branch antegradely and the left bundle branch retrogradely, right ventricular excitation must precede the left ventricular excitation. If left ventricular mapping cannot be done, other critical and essential elements for the diagnosis of bundle branch reentry must be tested. The most important of these is the demonstration that changes in the H-H and RB-RB and/or LB-LB interval during the tachycardia precede changes in the V-V interval. These changes can be initiated by ventricular stimulation during the tachycardia or may occur spontaneously following initiation. This observation, shown in Figure 11-91, is essential in proving that a macroreentrant circuit using the proximal His–Purkinje system is operative. Casceres et al.19 have shown this elegantly by linear regression analysis (Fig. 11-92). As stated earlier, the vast majority of bundle branch reentrant tachycardias have had LBBB morphology and have used the left bundle conducting system retrogradely and the right bundle branch system antegradely. Although the reverse situation—an RBBB reentrant tachycardia (using left bundle system antegradely and right bundle branch system retrogradely)—has been reported, the same criteria used for typical bundle branch reentry are more difficult to document without obtaining an LB recording. Although the RB-H-V sequence may be noted, this may be a passive phenomenon. Tachycardia oscillations with V-V intervals dependent on prior RB-H intervals should be looked for, but are difficult to see because the RB is usually activated during the QRS. Thus, an LB potential is mandatory to confirm the diagnosis. It is of interest that of the cases reported to be bundle branch reentry with an RBBB pattern, an incomplete RBBB with a long H-V was seen during sinus rhythm. This was the case in one of the two right bundle branch reentrant VT I have seen (Figs. 11-93 and 11-94).
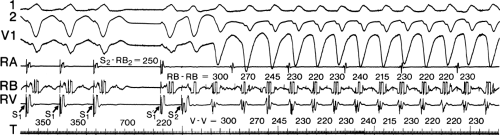 FIGURE 11-91 Relationship of VT CL to changes in His–Purkinje activation. Three surface ECG leads and electrograms from the right atrium (RA), the right bundle (RB), and the RV are shown. A short-long-short sequence (350, 700, 220) initiates VT. RB potentials can be seen before each QRS. Note that the change in RB-RB intervals precedes an identical change in V-V intervals. This suggests a causal relationship of the RV potential to the subsequent QRS. See text for discussion. (From Casceres J, Jazayeri M, McKinnie J, et al. Sustained bundle branch reentry as a mechanism of clinical tachycardia. Circulation 1989;79:256.) |
Why is bundle branch reentrant VT as rare as an isolated form of VT if single bundle branch reentrant complexes can be seen in 50% of normal patients?18,205,209 The reason lies in the underlying substrate of conduction delay in the left or right bundle branch system. True complete bundle branch block of either type would make bundle branch reentry impossible. Therefore, conduction delay, manifested by H-V prolongation, but not true block must be present in both the left and right bundle systems for typical bundle branch reentry to occur. Although the mode of induction of bundle branch reentry usually is by single extrastimuli, Casceres et al.19 have reported that sudden short-to-long change in cycle length before the introduction of extrastimuli facilitates induction of bundle branch reentry. This is related to the previously demonstrated effect of altered cycle length on His–Purkinje refractoriness.151
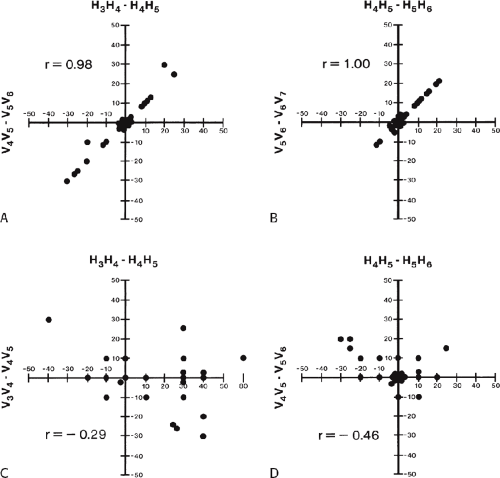 FIGURE 11-92 Linear regression analysis of H-H and V-V intervals. A: The H3H4–H4H5 intervals are plotted against the subsequent V-V intervals (V4V5-V5V6) and a linear result is observed. B: The same finding is shown if H4H5–H5H6 is plotted against V5V6–V6V7. This suggests a causal relationship of the H to the subsequent V. C and D: Analysis of the preceding V-V intervals to the subsequent H-H intervals (i.e., to assess whether the V-V interval was causally related to the H-H interval) shows no relationship. This analysis confirms a causal role of the His–Purkinje system in the development of this tachycardia. See text for discussion. (From Casceres J, Jazayeri M, McKinnie J, et al. Sustained bundle branch reentry as a mechanism of clinical tachycardia. Circulation 1989;79:256.) |
Bundle branch reentry not infrequently is observed at the initiation of monomorphic intramyocardial VT but is not necessary either to initiate or maintain the tachycardia. This can be proven by the demonstration that the tachycardia can be initiated with or without bundle branch reentry
(Fig. 11-95) and the failure to demonstrate His deflections with a normal or greater than normal H-V interval or a dependence of VT cycle length on prior H-H intervals.
(Fig. 11-95) and the failure to demonstrate His deflections with a normal or greater than normal H-V interval or a dependence of VT cycle length on prior H-H intervals.
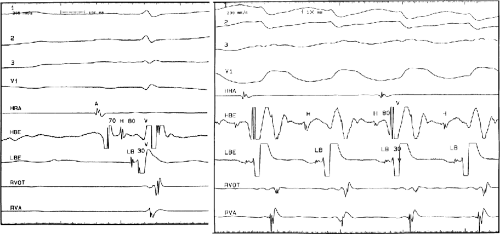 FIGURE 11-93 Bundle branch reentry with antegrade conduction over the left bundle branch. Surface ECG leads 1, 2, 3, and V1 are shown with electrograms from the HRA, HBE, left bundle branch (LBE), RVOT, and RVA. On the left is a sinus beat. The HV is 80 msec and LB-V is 30 msec. Incomplete RBBB is present. On the right bundle branch reentry with a complete RBBB pattern is shown. Note that the HV and LB-V are identical to that seen in sinus rhythm. See text for discussion. |
Because His bundle deflections may be observed in approximately 80% of VTs,16 does this imply that the fascicles are an integral component of the tachycardia circuit? I believe that in patients who have diseased hearts incorporation of a fascicle in the tachycardia circuit is not necessary to explain the presence of a His deflection before or just following the onset of the QRS. The lack of requirement for the more proximal His–Purkinje system has been demonstrated by intermittent His deflections (Fig. 11-96). These are typically in a 2:1 fashion but may also be seen in a 3:2 pattern or, less commonly, in a Wenckebach periodicity (Fig. 11-97). In patients with chronic coronary disease, the relative timing of the retrograde His deflection in the QRS depends on how
quickly the His–Purkinje system is engaged and how slowly the impulse reaches the ventricular myocardium to begin to produce the QRS. Thus, retrograde His potentials can actually precede the QRS or follow it. The retrograde His deflection appears to reflect passive activation of the His–Purkinje system and not involvement of the His–Purkinje system in the reentrant circuit. The bases for this conclusion are threefold: (a) His–Purkinje deflections may appear intermittently, as noted. (b) The changing V-H interval can occur without a change in cycle length (Fig. 11-98). If the His–Purkinje system were involved, a change in V-H interval should be mirrored by a change in tachycardia cycle length. (c) Marked changes in tachycardia cycle length can be present with no change in V-H interval (Fig. 11-99). These data suggest two things. First, the His–Purkinje system is passively activated in VT associated with coronary artery disease and is not related to the reentrant circuit per se. Second, engagement of the His–Purkinje system allows for more rapid activation of the myocardium, which in turn results in a narrower QRS. Our data analyzing the relationship between the V-H interval and QRS duration in VTs of similar morphology in the same patient demonstrate a direct relationship between the V-H interval and the QRS (Fig. 11-100).16 Thus, the His–Purkinje system is important for global ventricular activation, but at least the more
proximal areas do not seem to participate in the tachycardia mechanism. Whether the same is true in patients with normal ventricles and sustained VT has not been evaluated.
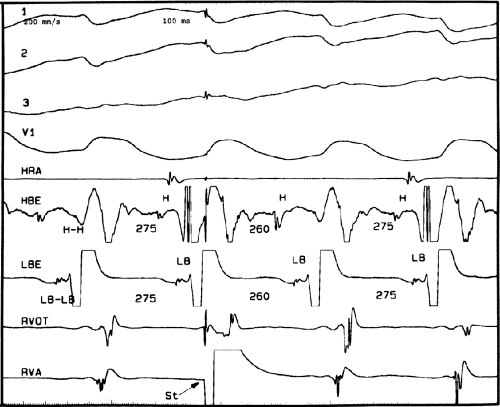 FIGURE 11-94 Proof of bundle branch reentry. This is the same patient as in Figure 11-93. During the tachycardia a VPC is delivered from the RVA. This VPC advances the subsequent H, LB, and V without altering their relationship confirming role of the His–Purkinje system in the tachycardia. See text for discussion. |
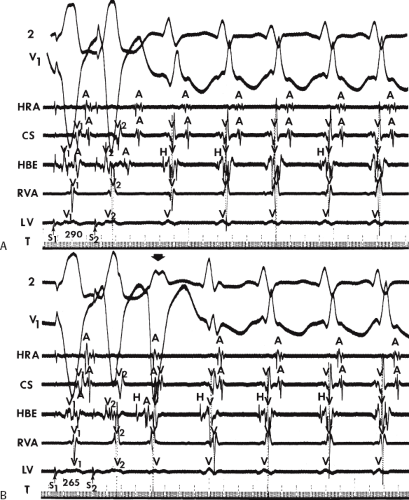 FIGURE 11-95 Initiation of VT in the presence or absence of bundle branch reentry or retrograde His–Purkinje system delay. A and B: ECG leads 2 and V1 and electrograms from the HRA, CS, HBE, RVA, and LV apex are shown along with T. A: At a coupling interval (SlS2) of 290 msec, VT is initiated in the absence of retrograde His–Purkinje delay (no V-H prolongation) or bundle branch reentry. B: At a closer coupling interval of 265 msec, VT occurs following the development of retrograde His–Purkinje delay and bundle branch reentry (broad arrow). His potentials are variably noted during the tachycardia. A: Once tachycardia is initiated, retrograde His potentials with a short V-H interval are observed following every other QRS complex. B: The retrograde His potential bears a variable relationship to the onset of the QRS (From Josephson ME, Horowitz LN, Farshidi A, et al. Sustained ventricular tachycardia: Evidence for protected localized reentry. Am J Cardiol 1978;42:416.) |
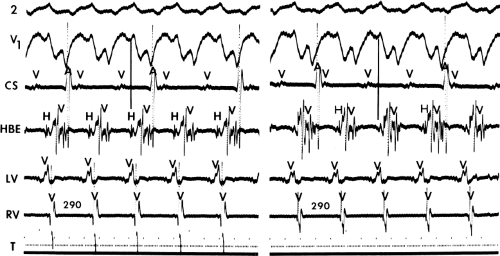 FIGURE 11-96 Relationship of His bundle activation during VT. A left bundle branch block tachycardia is present at a cycle length of 290 msec. Left panel: A retrograde His deflection with a short V-H interval is noted with every QRS complex. Right panel: 2:1 block in the His–Purkinje system is observed; that is, a His deflection is seen, associated with every other QRS. |
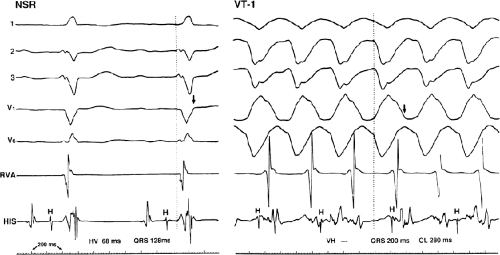 FIGURE 11-97 Retrograde Wenckebach periodicity in the His–Purkinje system during VT. During sinus rhythm (NSR), an incomplete left bundle branch block pattern is seen. The H-V interval is prolonged at 68 msec. During induced VT (VT-l), retrograde His–Purkinje Wenckebach is seen. The V-H interval in the first three QRS complexes demonstrates prolongation, then block, thereby demonstrating 3:2 Wenckebach in the His–Purkinje system. The beat following the block in the His–Purkinje system (vertical dotted line) restarts the sequence. |
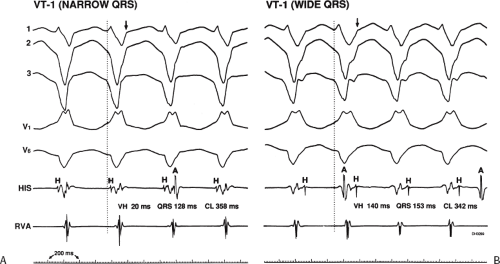 FIGURE 11-98 Lack of relationship between V-H interval and VT cycle length. A and B: VT with right bundle branch block and right superior axis is shown. A: The V-T1 is relatively narrow (QRS = 128 msec). B: The QRS morphology is identical, but the QRS is wider, at 153 msec. In the panel on the left (A, the narrow QRS VT), the V-H interval is 20 msec, and the tachycardia cycle length is 358 msec. In the panel on the right (B, the wide QRS), the V-H interval is 140 msec, and the tachycardia cycle length is slightly shorter, at 342 msec. The prolongation in V-H conduction is therefore unrelated to the tachycardia cycle length. This confirms a lack of participation of the His–Purkinje system in the tachycardia mechanism. See text for discussion. |
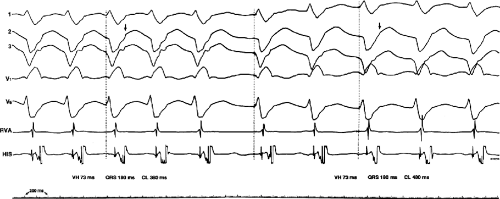 FIGURE 11-99 Change in cycle length of VT without a change in retrograde His–Purkinje activation. VT is present with a right bundle right superior axis morphology. Left: The tachycardia CL is 380 msec and is associated with a QRS of 180 msec and a V-H interval of 73 msec. Middle: Tachycardia cycle length suddenly prolongs to 480 msec without any change in the QRS duration or V-H interval. The failure of tachycardia cycle length changes to be associated with changes in V-H interval suggests lack of involvement of the His–Purkinje system in the tachycardia mechanism. See text for discussion. |
VT due to interfascicular reentry, in contrast to bundle branch reentry, is most commonly seen in patients with coronary artery disease, specifically those with an anterior infarction and either left anterior or posterior hemiblock. A schema is shown in Figure 11-101. In these patients RBBB is complete and bidirectional, so true bundle branch reentry cannot take place. In such cases there is slow conduction in the “apparently blocked” fascicle. Initiation of interfascicular reentry occurs when an APD, increase in heart rate, or a VPD produces transient block in the slowly conducting fascicle. The impulse conducts over the “healthy” fascicle, giving rise to a QRS identical to that in sinus rhythm, and then reenters the blocked fascicle to induce reentrant VT. In this instance the H-V interval will always be >40 msec shorter than the H-V in sinus rhythm, and the LB potential will precede the His potential (Figs. 11-90 and 11-102). When interfascicular reentry occurs in the setting of an anterior infarction, “cure” by
ablation is not possible because other myocardial VTs are, in my experience, always present and the ejection fractions are usually below 30%, thereby mandating a defibrillator to improve survival. This is not the case in the occasional patient with interfascicular reentry in the setting of degenerative conducting system disease with preserved ventricular function. In such a patient cure of the VT is possible by ablation of the diseased fascicle, although a pacemaker would likely be required.
ablation is not possible because other myocardial VTs are, in my experience, always present and the ejection fractions are usually below 30%, thereby mandating a defibrillator to improve survival. This is not the case in the occasional patient with interfascicular reentry in the setting of degenerative conducting system disease with preserved ventricular function. In such a patient cure of the VT is possible by ablation of the diseased fascicle, although a pacemaker would likely be required.
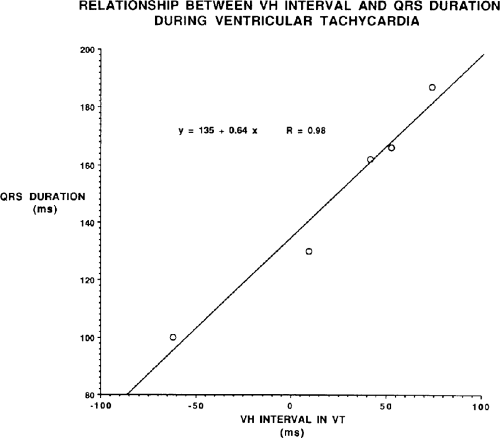 FIGURE 11-100 Relationship between V-H interval and QRS duration during VT. A V-H interval of five tachycardias in the same individual is plotted against the QRS duration of each of the tachycardias. Note the remarkable linear relationship between QRS duration and V-H interval. This suggests the potential role of the His–Purkinje system in overall ventricular activation. See text for discussion. |
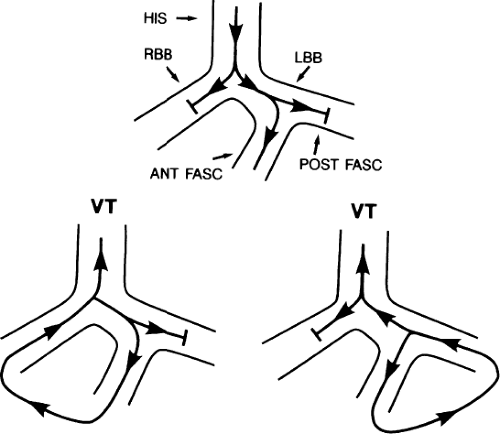 FIGURE 11-101 Schema of interfascicular reentry. A schema of sinus rhythm in a patient with RBBB and left posterior hemiblock is shown on top. Macroreentrant bundle branch reentry with antegrade conduction down the anterior fascicle and retrograde conduction up the right bundle is shown on the lower left. Interfascicular reentrant VT is shown on the lower right. Antegrade conduction is over the anterior fascicle and retrograde conduction up the posterior fascicle. The His bundle is activated retrogradely during antegrade conduction over the posterior fascicle giving rise to a shorter “H-V” than during sinus. See text for discussion. |
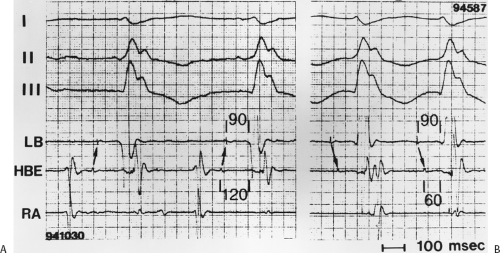 FIGURE 11-102 Intracardiac recordings during interfascicular reentrant VT. Both panels have ECG leads I, II, III, and recordings from the left bundle branch (LB), HBE, and RA. A: Sinus rhythm is present with an H-V interval of 120 msec and an LB-V of 90 msec. During interfascicular tachycardia (B), retrograde activation of the LB precedes the HBE leading to an apparent “H-V” of 60 msec. See text for discussion. |
Initiation of Polymorphic Ventricular Tachycardia-Ventricular Fibrillation
As noted earlier, patients presenting with cardiac arrest may have sustained uniform VT or polymorphic VT leading to VF (Figs. 11-52 and 11-53).6,22,23,43,190,191,192,193,194,195,196,197,198 In addition, patients may have nonsustained polymorphic VT, which may be symptomatic or may result in syncope. Polymorphic VT, with or without degeneration to VF, is most commonly observed in ischemic heart disease followed by other forms of structural heart disease. Another group of patients in whom there is much interest are those with apparently normal hearts and primary inherited arrhythmic syndromes.210 This latter group includes those with congenital long QT syndromes and those with normal or short QT intervals, including the syndromes of idiopathic ventricular fibrillation,211,212,213,214,215,216,217,218,219 Brugada syndrome,112,113,220,221,222 and catecholaminergic PMVT.115,116,118,119
The Brugada syndrome is genetically determined and is characterized by labile ST elevation and T-wave inversion in the right precordial leads (Fig. 11-103).112,113,223 Currently the classic coved ST segment elevation of >2 mm and terminal T-wave inversion only has to be present in only one right precordial lead, regardless of the interspace in which it is recorded, to make the diagnosis of Brugada syndrome.210 Savastano et al.224 recently reviewed the electrocardiographic, molecular, and echocardiographic features of Brugada syndrome. It was initially described as caused by early inactivation of the Na channel leading to early epicardial repolarization, which produces the characteristic ST elevation.112,113,223 More recently genetic defects producing early inactivation of the L-type calcium channel have also been shown to produce the syndrome.209,225 At least 9 genes have now been implicated in the Brugada syndrome. The major problem appears to be in the transient outward current (Ito) which, if it drives the membrane potential below opening of the L-type calcium channel, produces an early shortening of the action potential leading to ST elevation. Sodium channel–blocking drugs accentuate this finding, as does vagal stimulation, while exercise decreases it. Quinidine, at low doses, by virtue of Ito blocking properties, can diminish ST elevation and may prevent spontaneous arrhythmia episodes.214,215,226 At higher doses at which sodium cannel blocking effects are prominent, it can increase ST elevation and theoretically, facilitate arrhythmia occurrence. The current thinking of the pathophysiology of this syndrome has been recently reviewed.112,113,114,227 Controversy exists that the Brugada syndrome is related to conduction delay in the RVOT epicardium and not due to repolarization abnormalities.121 Ablation of high frequency, fractionated electrograms and late potentials recorded on the epicardium of the RVOT have cured the syndrome.121 Regardless of the controversy, the Brugada syndrome, idiopathic VF, and the short QT syndromes are now being lumped under the rubric of “Early Repolarization Syndromes.”228 All of these disorders have very short-coupled VPCs initiating polymorphic VT. In one study the mean coupling interval of initiating VPCs in the idiopathic VF syndrome was 302 ± 52 msec.214 The prematurity index of the initiating VPCs was 0.4, with the VPCs occurring within 40 msec of
the peak of the T wave. In the idiopathic VF group 50% have increasing J point elevation that is pause dependent.229 The mechanism of the sustained arrhythmia associated with early repolarization is believed to be due to Phase 2 reentry.227,230
the peak of the T wave. In the idiopathic VF group 50% have increasing J point elevation that is pause dependent.229 The mechanism of the sustained arrhythmia associated with early repolarization is believed to be due to Phase 2 reentry.227,230
Stay updated, free articles. Join our Telegram channel

Full access? Get Clinical Tree


