Recognizing Cardiac Arrhythmias
 Just the facts
In this chapter, you’ll learn: normal cardiac conduction
♦ application of cardiac rhythm monitoring devices
♦ methods to interpret cardiac rhythms
♦ characteristics of cardiac arrhythmias.
The importance of interpretation
An essential component of advanced cardiac life support (ACLS) is the rapid recognition of cardiac arrhythmias. Frequently, identification of an arrhythmia is what triggers an ACLS response, especially in the hospital setting. Accurate interpretation of a cardiac arrhythmia guides appropriate treatment and may help prevent hemodynamic deterioration.
Understanding cardiac conduction
The cardiovascular system contains specialized pacemaker cells that enable the heart to generate a precise rhythm. These cells have four unique characteristics:
automaticity—the ability to spontaneously initiate an electrical impulse
conductivity—the ability to transmit the impulse to the next cell
contractility—the ability to shorten the fibers in the heart when receiving the impulse
excitability—the ability to respond to an electrical stimulus.
|
Cardiac conduction system
In normal conduction, each electrical impulse travels from the sinoatrial (SA) node through the atria along the internodal and interatrial tracts. The impulse slows momentarily as it passes through the atrioventricular (AV) junction to the bundle of His. Then it descends the left and right bundle branches and finally down the Purkinje fibers.
|
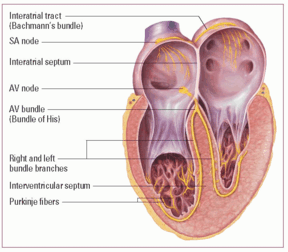
Cardiac conduction begins in the sinoatrial (SA) node and proceeds through the cardiac conduction system. (See Cardiac conduction system)
Key points
Cardiac conduction
• SA node—normal pacemaker
• AV node—impulse conduction.
• AV node will generate impulse if SA node fails.
• Ventricles will generate impulse if SA and AV nodes fail.
Sinoatrial node
The SA node is the heart’s natural pacemaker. It’s located on the endocardial surface of the right atrium near the superior vena cava. When the SA node fires, it sends an impulse throughout the right and left atria that results in an atrial contraction. Normally, the SA node generates an impulse 60 to 100 times/minute.
Atrioventricular node
The atrioventricular (AV) node slows impulse conduction between the atria and the ventricles. Situated low in the septal wall of the right
atrium, this “resistor” node provides time for the contracting atria to fill the ventricles with blood before the lower chambers contract.
atrium, this “resistor” node provides time for the contracting atria to fill the ventricles with blood before the lower chambers contract.
From the AV node to the myocardium
The impulse from the AV node travels to the bundle of His (modified muscle fibers), branching off to the right and left bundle branches. Then it travels to the distal portions of the bundle branches called the Purkinje fibers. These fibers fan across the surface of the ventricles from the endocardium to the myocardium. As the impulse spreads, it signals the blood-filled ventricles to contract.
Safety mechanisms
The conduction system has two built-in safety mechanisms. If the SA node fails to fire, the AV node will generate an impulse 40 to 60 times/minute. If the SA node and AV node both fail, the ventricles can generate their own impulse 20 to 40 times/minute.
|
Abnormal impulses
Abnormal impulse conduction results from disturbances in automaticity, conduction, or both.
It’s automatic
Automaticity can increase or decrease. For example, increased automaticity of pacemaker cells below the SA node commonly causes tachycardia. Likewise, decreased automaticity of cells in the SA node can cause bradycardia or an escape rhythm.
Conduction junction
Conduction may occur too quickly, as in Wolff-Parkinson-White (WPW) syndrome, or too slowly, as in AV block. Atrial tachycardia with a 4:1 block is an example of a combined automaticity and conduction disturbance.
Monitoring cardiac rhythms
An electrocardiogram (ECG) is used to monitor the precise sequence of electrical events in the cardiac cycle. There are two types of ECG recordings: the 12-lead and the single lead, commonly known as a rhythm strip.
You’ll want to get this complex
An ECG complex reflects the electrical events occurring in one cardiac cycle. Each complex consists of five waveforms, labeled
with the letters P, Q, R, S, and T. The middle three letters—Q, R, and S—are collectively referred to as the QRS complex. (See ECG waveform components.)
with the letters P, Q, R, S, and T. The middle three letters—Q, R, and S—are collectively referred to as the QRS complex. (See ECG waveform components.)
Typically, you identify cardiac arrhythmias by recognizing their effects on the ECG waveform. However, ECG interpretation doesn’t replace the need for keen assessment skills. Always remember that ECG findings should correlate with the patient’s physical condition.
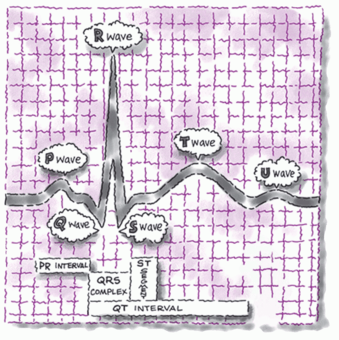
ECG waveform components
An electrocardiogram (ECG) waveform has three basic components: the P wave, the QRS complex, and the T wave. These elements can be further divided into the PR interval, J point, ST segment, U wave, and QT interval.
P wave and PR interval
The P wave represents atrial depolarization. The PR interval represents the time it takes an impulse to travel from the atria through the atrioventricular nodes and the bundle of His. The PR interval measures from the beginning of the P wave to the beginning of the QRS complex.
QRS complex
The QRS complex represents ventricular depolarization (the time it takes for the impulse to travel through the bundle branches to the Purkinje fibers).
The Q wave appears as the first negative deflection in the QRS complex; the R wave as the first positive deflection. The S wave appears as the second negative deflection or the first negative deflection after the R wave.
J point and ST segment
The J point marks the end of the QRS complex and also indicates the beginning of the ST segment. The ST segment represents part of ventricular repolarization; it’s measured from the end of the S wave to the beginning of the T wave.
T wave and U wave
The T wave represents ventricular repolarization and usually follows the same deflection pattern as the P wave. The U wave follows the T wave; however, because the U wave signifies a problem, it isn’t seen in most patients.
QT interval
The QT interval represents ventricular depolarization and repolarization. It extends from the beginning of the QRS complex to the end of the T wave.
|
Applying monitoring devices
An ECG monitor is a tool that provides continuous information about the heart’s electrical activity. Electrodes applied to the patient’s chest pick up the heart’s electrical activity and display it on the monitor.
Commonly monitored leads include the three bipolar leads—I, II, and, III—and MCL1 and MCL6, which are modified versions of leads V1 and V6. You may use a three-, four-, or five-electrode system for cardiac monitoring. (See Using a five-leadwire system.)
Technique matters
To ensure accurate lead monitoring, you must apply the electrodes correctly. Follow these steps for accurate lead placement:
Clip dense hair at each site.
Prepare the skin by briskly rubbing each site until the skin reddens using the rough patch on the back of the electrode or a dry gauze pad.
Remove the backing from the electrodes and apply one to each prepared site by pressing it against the patient’s skin (the electrode gel should be moist in order to conduct properly).
Attach leadwires or cable connections by clipping them to the electrodes. (If you’re using a snap-on leadwire, attach it to the electrode before placing the electrode on the patient’s chest to prevent patient discomfort.)
Turn on the monitor.
Select the lead you wish to view following the monitor’s instructions.
 Peak technique
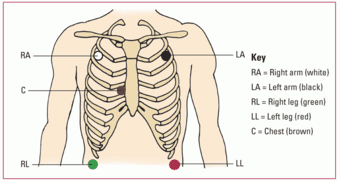
Using a five-leadwire system
This illustration shows the correct placement of leadwires for a five-leadwire system. The chest electrode shown is located in the V1 position, but you can place it in any of the chest lead positions. Each lead’s color is included in the key.
|
Interpreting rhythm strips: An eight-step method
You can learn to analyze and interpret ECGs systematically and correctly by using this eight-step method. First, scan the entire strip and identify the waveform components. Then follow these steps.
|

Step 1: Determine the rhythm
To determine the heart’s atrial and ventricular rhythms, use either the paper-and-pencil method or the calipers
method. (See Methods of measuring rhythm.) Then ask yourself, “Does the rhythm appear to be regular or irregular?”
method. (See Methods of measuring rhythm.) Then ask yourself, “Does the rhythm appear to be regular or irregular?”
 Memory jogger
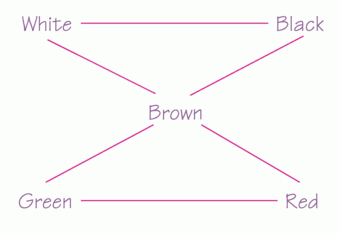
To help you remember where to place electrodes in a five-electrode configuration, think of the phrase “White, upper right.” Then think of snow over trees (white above green), and smoke over fire (black above red). And, of course, chocolate (brown electrode) lies close to the heart!
|
|

Step 2: Determine the rate
Next, calculate the heart’s atrial and ventricular rates, using the times ten method, the 1,500 method, or the sequence method. (See Calculating heart rate, page 26.)
 Peak technique
Methods of measuring rhythm
You can use either of the following methods to determine atrial and ventricular rhythm.
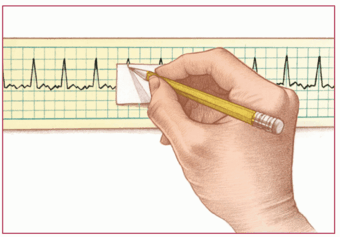
Paper-and-pencil method
Place the electrocardiogram (ECG) strip on a flat surface. Then position the straight edge of a piece of paper along the strip’s baseline. Move the paper up slightly so the straight edge is near the peak of the R wave. With a pencil, mark the paper at the R waves of two consecutive QRS complexes, as shown. This is the R-R interval.
Next, move the paper across the strip and line up those two marks with succeeding R-R intervals. If the distance for each R-R interval is the same, the ventricular rhythm is regular. If the distance varies, the rhythm is irregular.
Use the same method to measure the distance between the P waves (the P-P interval) and determine whether the atrial rhythm is regular or irregular.
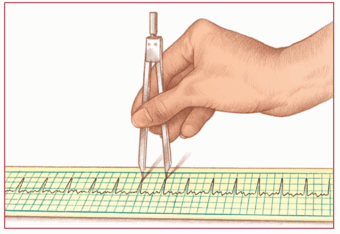
Calipers method
With the ECG strip on a flat surface, place one point of the calipers on the peak of the R wave of two consecutive QRS complexes. Then adjust the legs and place the other point on the peak of the next R wave, as shown. This distance is the R-R interval.
Next, pivot the first point of the calipers toward the third R wave and note whether it falls on the peak of that wave. Check succeeding R-R intervals in the same way. If they’re all the same distance, the ventricular rhythm is regular. If the distance varies, the rhythm is irregular.
Using the same method, measure the P-P intervals to determine whether the atrial rhythm is regular or irregular.
|
|
 Peak technique
Calculating heart rate
You can use one of three methods—the times ten method, the 1,500 method, or the sequence method—to determine atrial and ventricular heart rates from an electrocardiogram waveform.
Times ten method
The simplest, quickest, and most common technique, the times ten method is particularly useful if the patient’s heart rhythm is irregular. First, obtain a rhythm strip. Then locate the small markings at the top of the strip. Each marking represents 3 seconds. Count the number of P waves (to determine atrial rate) or R waves (to determine ventricular rate) over a 6-second time period (two 3-second markings). Multiply by 10.
|
1,500 method
Use the 1,500 method only if the patient’s heart rhythm is regular. First, identify two consecutive P waves on the rhythm strip. Next, select identical points in each wave and count the number of small squares between the points. Then divide 1,500 by the number of small squares counted (1,500 small squares equal 1 minute) to get the atrial rate. To calculate the ventricular rate, use the same procedure but with two consecutive R waves instead of P waves.
Sequence method
The sequence method gives you an estimated heart rate. First, find a P wave that peaks on a heavy black line. Assign the following numbers to the next six heavy black lines: 300, 150, 100, 75, 60, and 50, respectively.
Then find the next P wave peak and estimate the atrial rate based on the number assigned to the nearest heavy black line. Estimate the ventricular rate following the same procedure but use the R wave instead of the P wave.
Determine if the rate is within normal limits (60 to 100 beats/minute). Next, determine if the atrial (P-P interval) rate and ventricular (R-R interval) rate are continually the same measurement. Then determine if they’re associated with each other.
Step 3: Evaluate the P wave
Look at the rhythm strip and ask these questions:
Are P waves present?
Do the P waves have a normal shape (usually upright and rounded)?
Are the P waves similar in size and shape?
Do all the P waves point in the same direction? Are they all upright, inverted, or diphasic?
Do the P waves and QRS complexes have a one-to-one relationship?
Is the distance between each P wave and its QRS complex the same?
|
Step 4: Determine the duration of the PR interval
After you’ve determined the duration of the PR interval (normal duration is 0.12 to 0.20 second), determine if the PR interval is constant.
Step 5: Determine the duration of the QRS complex
Look at the rhythm strip again and ask these questions:
Are all the QRS complexes the same size and shape?
What’s the duration of the QRS complex? (Normal duration is 0.06 to 0.10 second.)
Are all the QRS complexes the same distance from the T waves that follow them?
Do all the QRS complexes point in the same direction?
Do any QRS complexes appear different from the others on the strip? (If so, measure and describe each one individually.)
Step 6: Evaluate the T wave
Examine the strip once more and ask these questions:
Are T waves present?
Do all the T waves have the same size and shape?
Could a P wave be hidden in a T wave?
Do the T waves point in the same direction as the QRS complexes?
Step 7: Determine the duration of the QT interval
Note whether the duration of the QT interval falls within normal limits (0.36 to 0.44 second, or 9 to 11 small squares).
Step 8: Evaluate other components
Finally, observe other components on the ECG strip, including ectopic or aberrantly conducted beats and other abnormalities. Check the ST segment for any abnormalities, such as elevation above or depression below the isoelectric line, and look for a U wave. Note your findings.
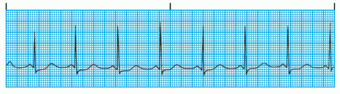
Recognizing normal sinus rhythm
Before you can recognize an arrhythmia, you must be able to recognize a normal sinus rhythm (NSR). NSR is a heart rhythm that starts in the SA node and progresses to the ventricles through a normal conduction pathway—from the SA node to the atria and AV node, through the bundle of His to the bundle branches, and on to the Purkinje fibers. NSR is the standard against which all other rhythms are compared. In NSR:
atrial and ventricular rhythms are regular
atrial and ventricular rates are 60 to100 beats/minute
P wave is normally shaped (upright and rounded in lead II) (All P waves are similar in size and shape; there’s a P wave for every QRS complex.)
PR interval is within normal limits (0.12 to 0.20 second)
QRS complex is within normal limits (0.06 to 0.10 second)
T wave is normally shaped (upright and rounded in lead II)
QT interval is within normal limits (0.36 to 0.44 second).
|
Recognizing narrow complex tachycardias
Narrow complex tachycardias are arrhythmias that involve an accelerated heart rate and a narrow QRS complex. They include sinus tachycardia, atrial fibrillation, atrial flutter, atrial tachycardia, multifocal atrial tachycardia (MAT), WPW syndrome, and junctional tachycardia.
Sinus tachycardia
Sinus tachycardia involves the accelerated firing of the SA node beyond its normal discharge rate, resulting in a heart rate of 100 to 150 beats/minute. The rate rarely exceeds 160 beats/minute, except during strenuous exercise.
Pesty tachy may persist
Persistent sinus tachycardia, especially with acute myocardial infarction (MI), may lead to ischemia and myocardial damage by raising oxygen requirements.
|
What the ECG tells you
Rhythm: Atrial and ventricular rhythms are regular.
Rate: Atrial and ventricular rates are greater than 100 beats/minute (usually between 100 and 150 beats/minute).
P wave: Normal size and configuration; P wave precedes each QRS complex.
PR interval: Within normal limits and constant.
QRS complex: Normal duration and configuration.
T wave: Normal size and configuration.
QT interval: Within normal limits but commonly shortened.
What causes it
Caffeine, nicotine, and alcohol ingestion
Digoxin toxicity
Hypothyroidism and hyperthyroidism
Normal cardiac response to demand for increased oxygen during exercise, fever, stress, pain, and dehydration
Any occurrence that decreases vagal tone and increases sympathetic tone
Inflammatory response after MI (In acute MI, it may be one of the first signs of heart failure, cardiogenic shock, pulmonary embolism, or infarct extension.)
Adrenergics
Anticholinergics
Antiarrhythmics
What to look for
Usually no symptoms
Rapid, regular pulse 100 to 150 beats/minute
Palpitations or angina caused by increased myocardial oxygen consumption and reduced coronary blood flow
How it’s treated
Treatment aims to correct the underlying cause.
If the patient is symptomatic, a beta-adrenergic blocker such as metoprolol (Lopressor) may be given.
Atrial fibrillation
Atrial fibrillation, usually called A-fib, is defined as chaotic, asynchronous, electrical activity in atrial tissue. It stems from the firing of a number of impulses in reentry pathways. Atrial fibrillation results in a loss of atrial kick. The ectopic impulses may fire at a rate of 400 to 600 times/minute, causing the atria to quiver instead of contract.
On impulse
The ventricles respond only to those impulses that make it through the AV node. On an ECG, atrial activity is no longer represented by P waves but by erratic baseline waves called fibrillatory waves, or f waves. This rhythm may be either sustained or paroxysmal (occurring in bursts). It can be preceded by or the result of premature atrial contractions (PACs). The patient may develop an atrial rhythm that frequently varies between a fibrillatory line and flutter waves. This is called A-fib/flutter.
|
|
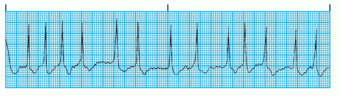
What the ECG tells you
Rhythm: Atrial and ventricular rhythms are grossly irregular.
Rate: The atrial rate (almost indiscernible) usually exceeds 400 beats/minute. The ventricular rate usually varies from 40 to 250 beats/minute.
P wave: Absent. Erratic baseline f waves appear instead. These chaotic f waves represent atrial tetanization from rapid atrial depolarizations.
PR interval: Indiscernible.
QRS complex: Duration and configuration are usually normal.
QT interval: Unmeasurable.
What causes it
Rheumatic heart disease, valvular disorders (especially mitral stenosis), hypertension, MI, coronary artery disease (CAD), heart failure, cardiomyopathy, and pericarditis
Thyrotoxicosis
Chronic obstructive pulmonary disease (COPD)
Drugs such as digoxin (Lanoxin)
Cardiac surgery
Occasional increased sympathetic activity from exercise
What to look for
Irregular pulse rhythm with a normal or rapid rate (“palpitations”); peripheral pulse commonly slower than apical pulse
Signs and symptoms of decreased cardiac output (if ventricular rate is rapid)
How it’s treated
If the patient is hemodynamically unstable, perform synchronized cardioversion immediately (initially, 120 to 200 joules or the biphasic equivalent). If using monophasic energy, start at 200 joules and increase in a stepwise fashion as indicated.
For patients with a rapid rate, consult a practitioner and administer a beta-adrenergic blocker, such as esmolol I.V., or a calcium channel blocker, such as diltiazem (Cardizem), to control ventricular rate.
For patients with atrial fibrillation of 48 hours or less duration, administer amiodarone (Cordarone), ibutilide (Corvert), propafenone (Rhythmol), flecainide (Tambocor), or digoxin to control the rhythm, as ordered by the practitioner.
Consider anticoagulants when deciding how quickly to correct atrial fibrillation that has been present longer than 48 hours because rapid conversion may cause blood clots.
Atrial flutter
Atrial flutter is characterized by an atrial rate of 250 to 400 beats/minute, although it’s generally about 300 beats/minute. Originating in a single atrial focus, this rhythm results from reentry and, possibly, increased automaticity.
Fast flutter, slow kick
The significance of atrial flutter depends on the acceleration of the ventricular rate. The faster the ventricular rate, the more dangerous the arrhythmia. Like atrial fibrillation, atrial flutter results in a loss of atrial kick. Even a small rise in the ventricular rate can cause angina, syncope, hypotension, heart failure, and pulmonary edema. Atrial fibrillation or flutter may appear.
|
|
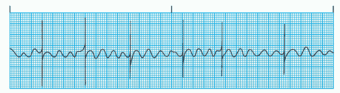
What the ECG tells you
Rhythm: Atrial rhythm is regular. Ventricular rhythm depends on the AV conduction pattern; it’s usually regular, although cycles may alternate. An irregular pattern may signal atrial fibrillation or indicate a block.
Rate: Atrial rate is 250 to 400 beats/minute. Ventricular rate depends on the degree of AV block; usually it’s 60 to 100 beats/minute but it may accelerate to 125 to 150 beats/minute.
P wave: Saw-toothed or picket fence appearance (called flutter waves).
PR interval: Unmeasurable.
QRS complex: Duration is usually within normal limits but the complex may be widened if flutter waves are buried within.
T wave: Not identifiable.
QT interval: Unmeasurable.
What causes it
Acute or chronic cardiac disorder, mitral or tricuspid valve disorder, cor pulmonale, and cardiac inflammation such as pericarditis
MI (transient complication)
Digoxin toxicity
Hyperthyroidism
Alcoholism
Cardiac surgery
What to look for
Absence of symptoms or palpitations
Cardiac, cerebral, and peripheral vascular effects (if ventricular filling and coronary artery blood flow are compromised)


